| Param | Original file | Final file |
|---|---|---|
| Filename | modeM0/AS1A10_050T03_9000004216_29330cztM0_level2.evt | modeM0/AS1A10_050T03_9000004216_29330cztM0_level2_quad_clean.evt |
| Size (bytes) | 950,941,440 | 65,162,880 |
| Size | 906.9 MB | 62.1 MB |
| Events in quadrant A | 3,521,538 | 445,699 |
| Events in quadrant B | 4,075,643 | 444,839 |
| Events in quadrant C | 4,114,488 | 431,072 |
| Events in quadrant D | 16,611,097 | 159,230 |
| Mode M9 | |||
|---|---|---|---|
| Quadrant | BADHDUFLAG | Total packets | Discarded packets |
| A | 0 | 3 | 0 |
| B | 0 | 3 | 0 |
| C | 0 | 3 | 0 |
| D | 0 | 3 | 0 |
| Mode SS | |||
|---|---|---|---|
| Quadrant | BADHDUFLAG | Total packets | Discarded packets |
| A | 0 | 144 | 0 |
| B | 0 | 144 | 0 |
| C | 0 | 144 | 0 |
| D | 0 | 144 | 0 |
| Mode M0 | |||
|---|---|---|---|
| Quadrant | BADHDUFLAG | Total packets | Discarded packets |
| A | 0 | 14840 | 1 |
| B | 0 | 16435 | 1 |
| C | 0 | 16570 | 3 |
| D | 0 | 54084 | 1 |
| Quadrant | Total seconds | Saturated seconds | Saturation percentage |
|---|---|---|---|
| A | 7035 | 181 | 2.572850% |
| B | 7035 | 284 | 4.036958% |
| C | 7035 | 295 | 4.193319% |
| D | 7035 | 6996 | 99.445629% |
Noise dominated data is calculated using 1-second bins in cleaned event files. If a bin has >2000 counts, and if more than 50% of those come from <1% of pixels, then it is considered to be noise-dominated and hence unusable.
| Quadrant | # 1 sec bins | Bins with >0 counts | Bins with >2000 counts | High rate bins dominated by noise | Noise dominated (total time) | Noise dominated (detector-on time) | Marked lightcurve |
|---|---|---|---|---|---|---|---|
| A | 7345 | 7036 | 1 | 1 | 0.01% | 0.01% | 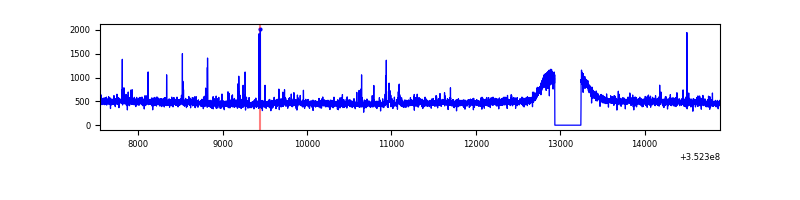 |
| B | 7345 | 7036 | 50 | 50 | 0.68% | 0.71% | 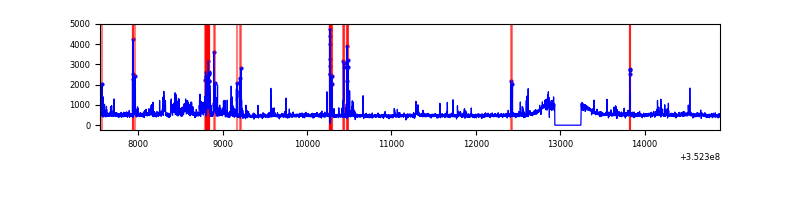 |
| C | 7345 | 7036 | 4 | 4 | 0.05% | 0.06% | 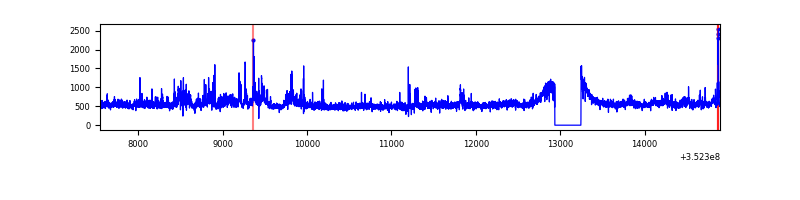 |
| D | 7345 | 7036 | 5447 | 5447 | 74.16% | 77.42% | 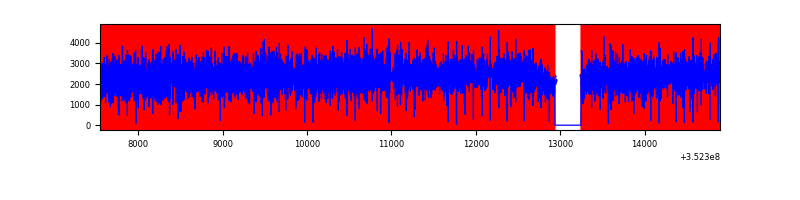 |
Top three noisy pixels from each quadrant. If the there are fewer than three noisy pixels in the level2.evt file, extra rows are filled as -1
| Pixel properties | Quadrant properties | ||||||
|---|---|---|---|---|---|---|---|
| Quadrant | DetID | PixID | Counts | Sigma | Mean | Median | Sigma |
| A | 0 | 13 | 18138 | 95.39 | 896 | 876 | 181.0 |
| A | 13 | 254 | 16883 | 88.46 | 896 | 876 | 181.0 |
| A | 1 | 113 | 15945 | 83.27 | 896 | 876 | 181.0 |
| B | 0 | 190 | 186643 | 1084.58 | 880 | 858 | 171.3 |
| B | 5 | 172 | 154505 | 896.96 | 880 | 858 | 171.3 |
| B | 5 | 255 | 100341 | 580.76 | 880 | 858 | 171.3 |
| C | 3 | 233 | 536667 | 2660.77 | 851 | 858 | 201.4 |
| C | 14 | 238 | 158748 | 784.06 | 851 | 858 | 201.4 |
| C | 7 | 247 | 48498 | 236.57 | 851 | 858 | 201.4 |
| D | 12 | 33 | 11452787 | 123207.74 | 372 | 361 | 93.0 |
| D | 1 | 52 | 1728473 | 18591.41 | 372 | 361 | 93.0 |
| D | 12 | 17 | 1098945 | 11818.81 | 372 | 361 | 93.0 |
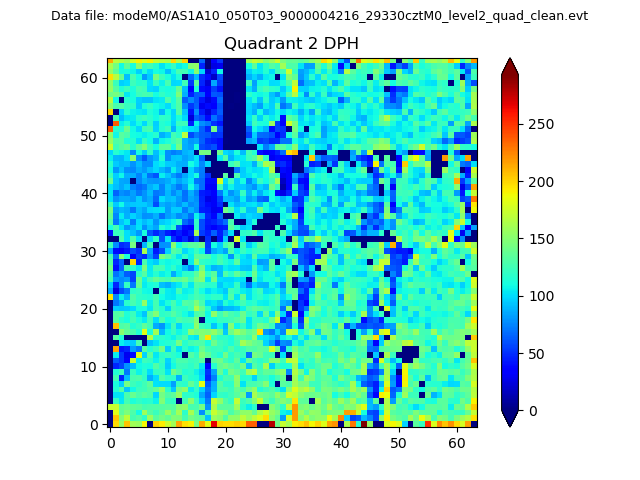
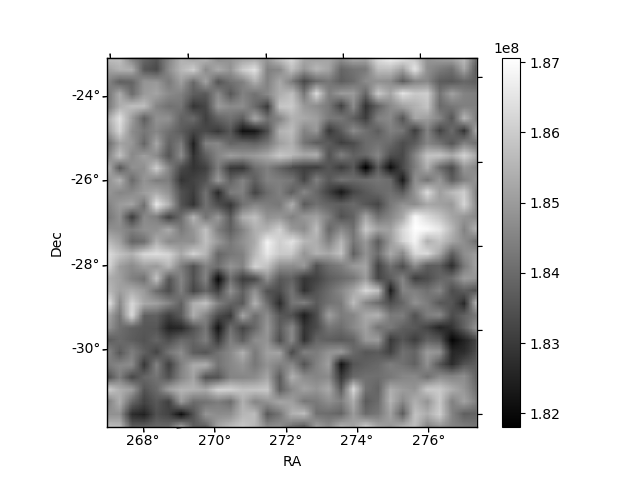
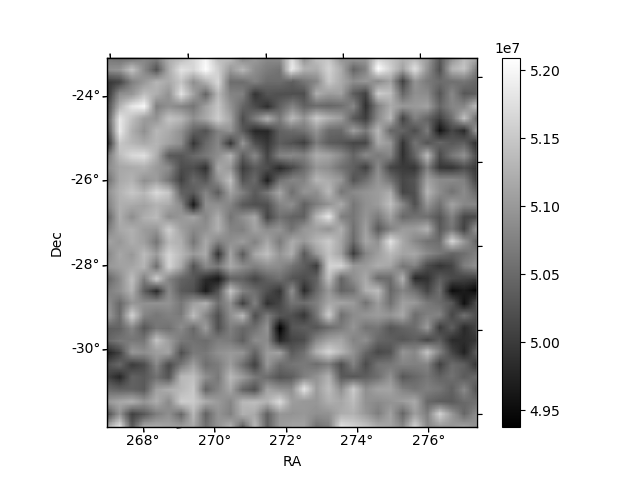
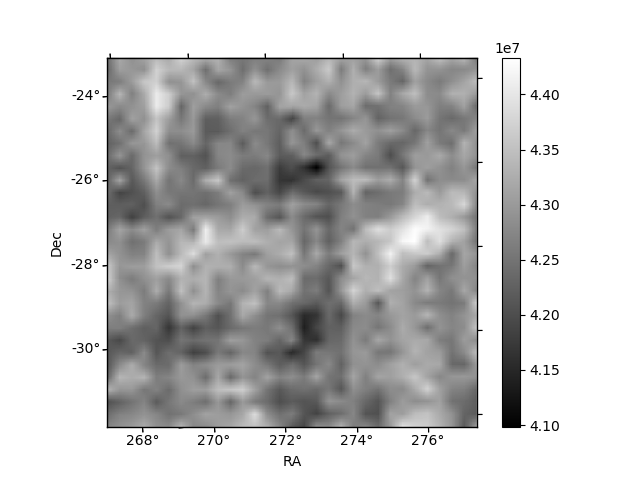
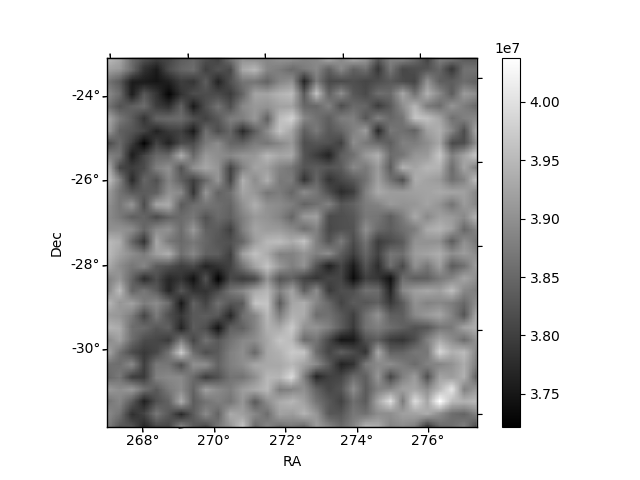
Histogram calculated using DETX and DETY for each event in the final _common_clean file
| Quadrant A | 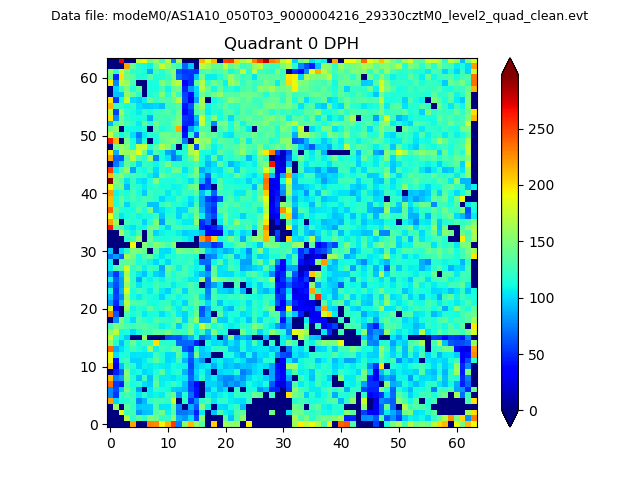 |
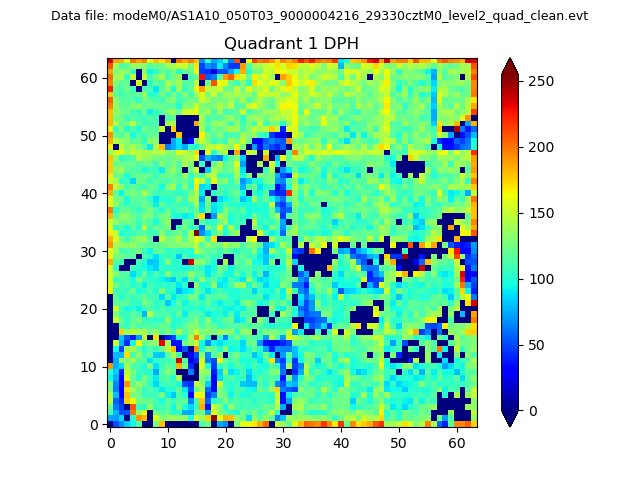 |
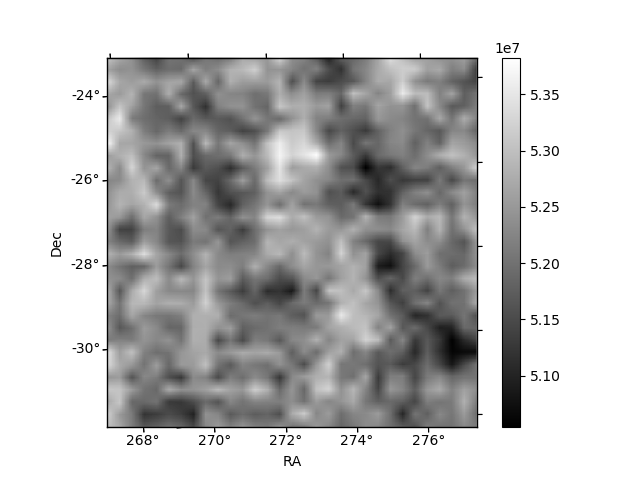
Quadrant B |
|---|---|---|---|
| Quadrant D | 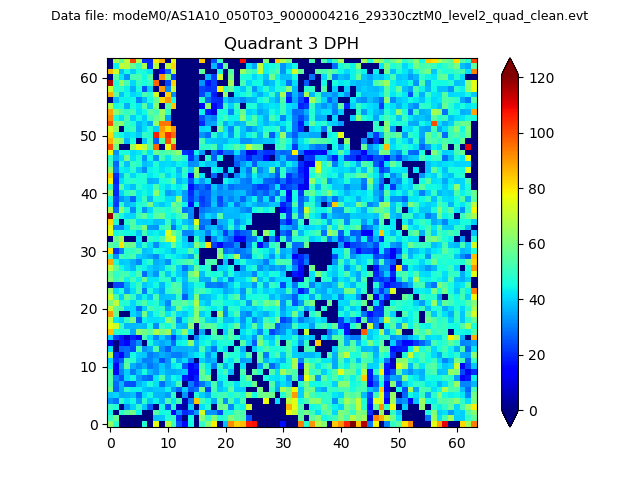 |
 |
Quadrant C |
| Plot type | Count rate plots | Images |
|---|---|---|
| Comparison with Poisson distribution Blue bars denote a histogram of data divided into 1 sec bins. Red curve is a Poisson curve with rate = median count rate of data. |
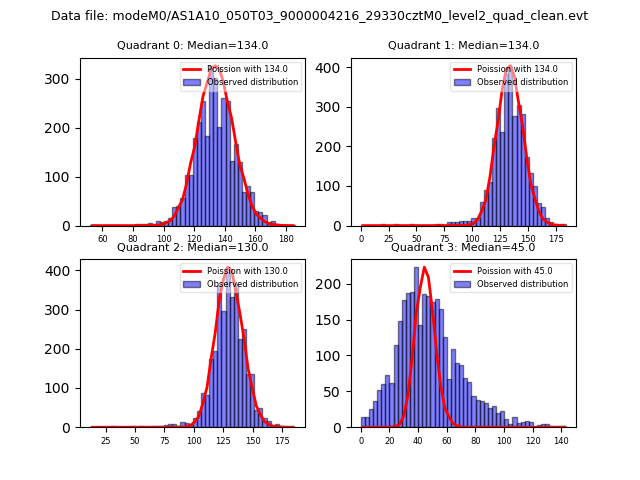 |
 |
| Quadrant-wise count rates Data is divided into 100 sec bins |
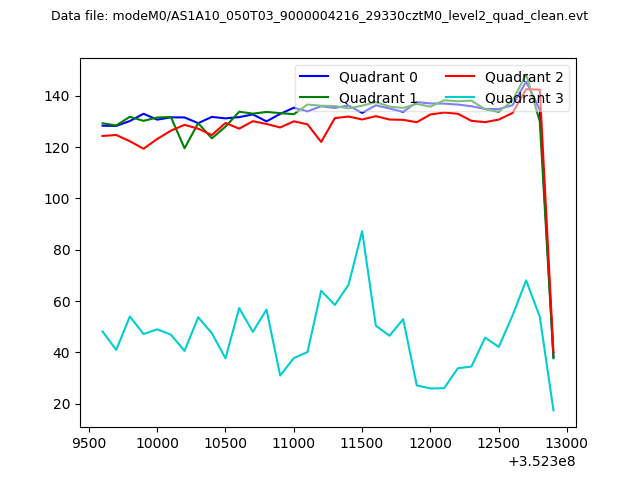 |
|
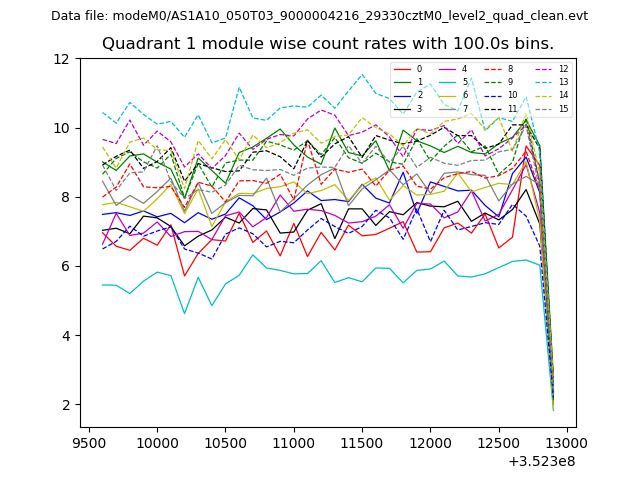
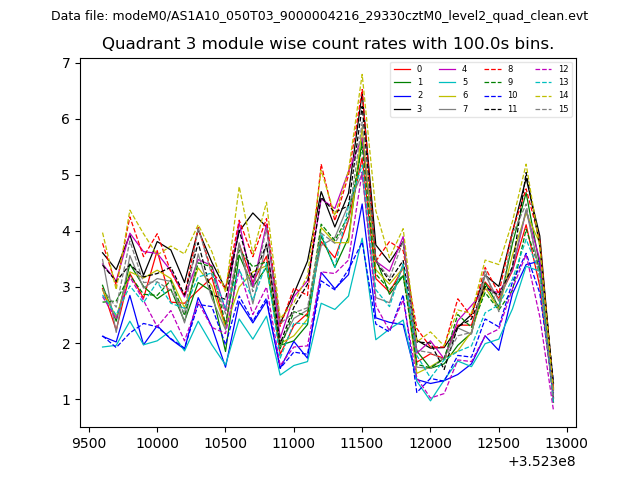
| Module-wise count rates for Quadrant A Data is divided into 100 sec bins |
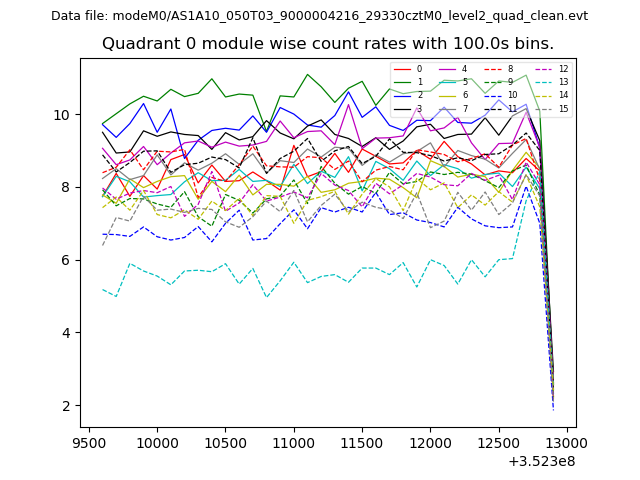 |
 |
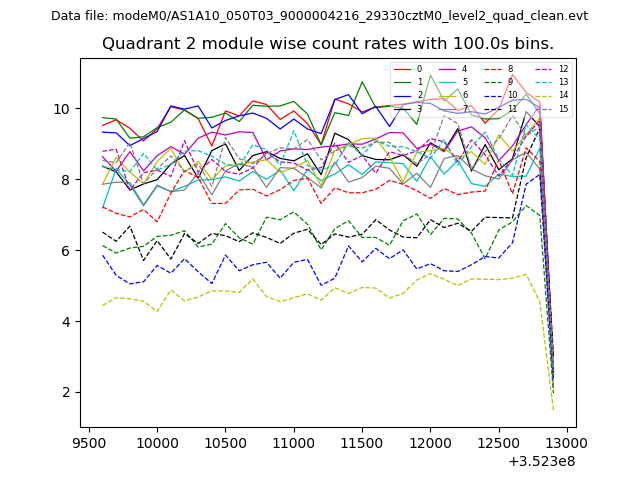
| Module-wise count rates for Quadrant B Data is divided into 100 sec bins |
 |
 |
| Module-wise count rates for Quadrant C Data is divided into 100 sec bins |
 |
 |
| Module-wise count rates for Quadrant D Data is divided into 100 sec bins |
 |
 |
| Parameter | Plot |
|---|---|
| CZT HV Monitor | 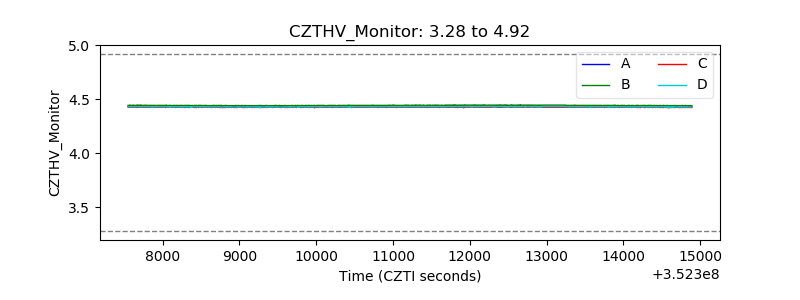 |
| D_VDD | 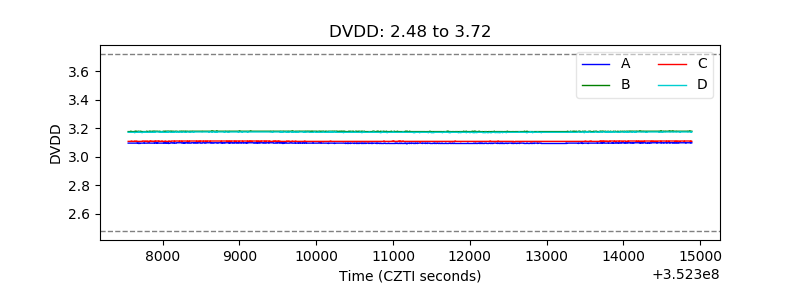 |
| Temperature 1 | 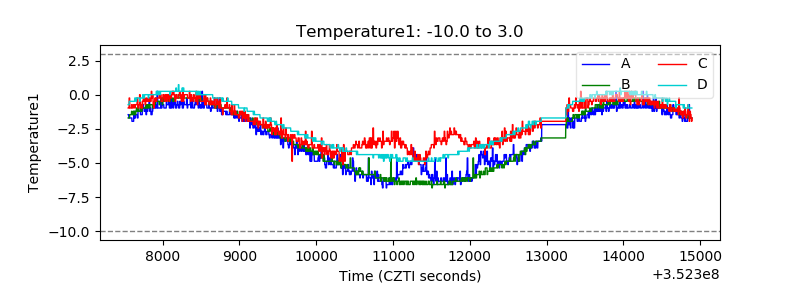 |
| Veto HV Monitor |  |
| Veto LLD | 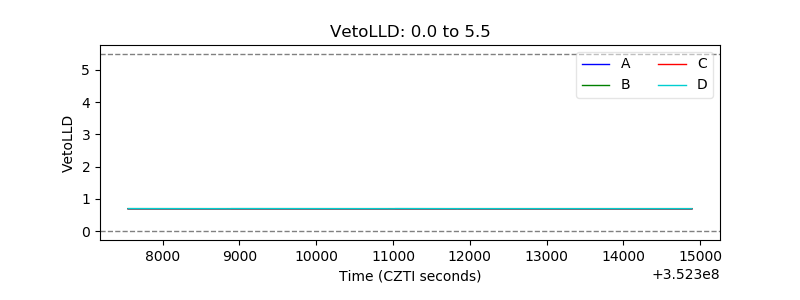 |
| Alpha Counter | 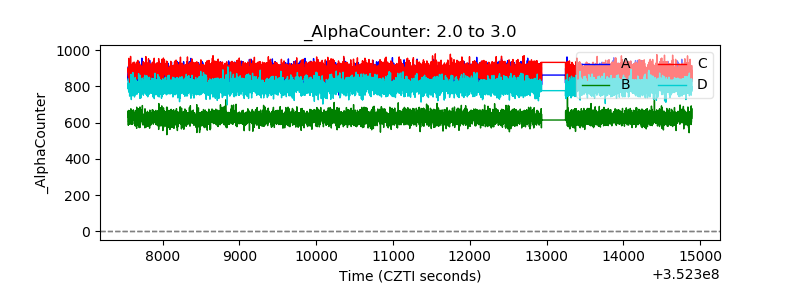 |
| _CPM_Rate | 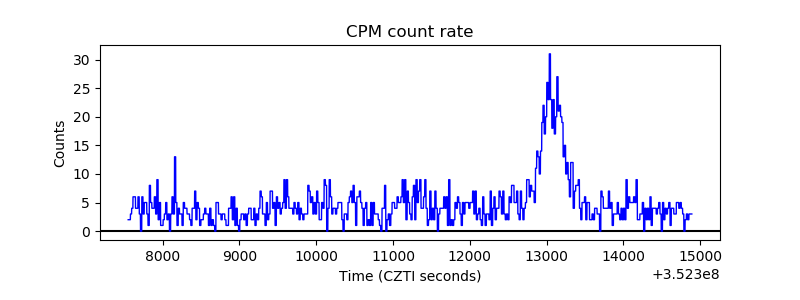 |
| CZT Counter | 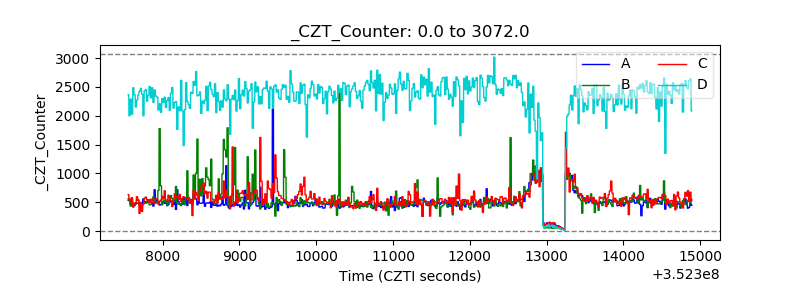 |
| +2.5 Volts monitor |  |
| +5 Volts monitor | 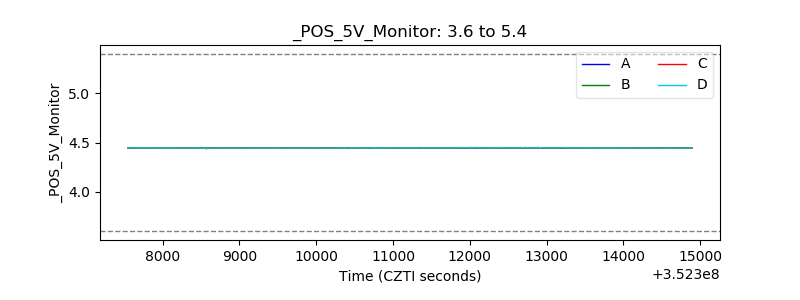 |
| _ROLL_ROT | 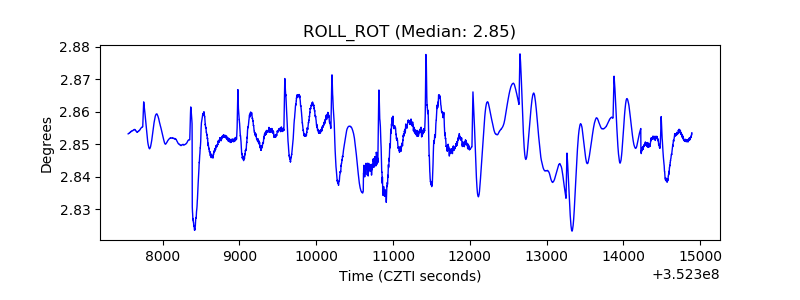 |
| _Roll_DEC |  |
| _Roll_RA | 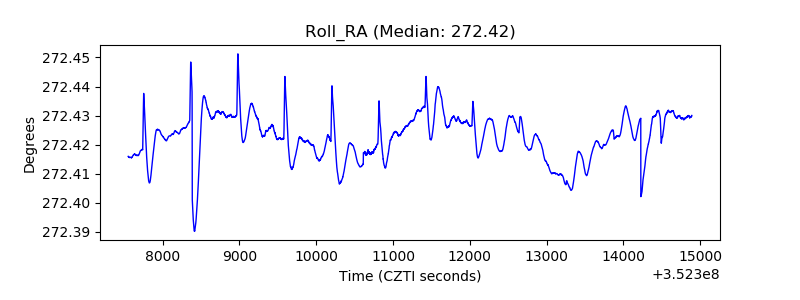 |
| Veto Counter | 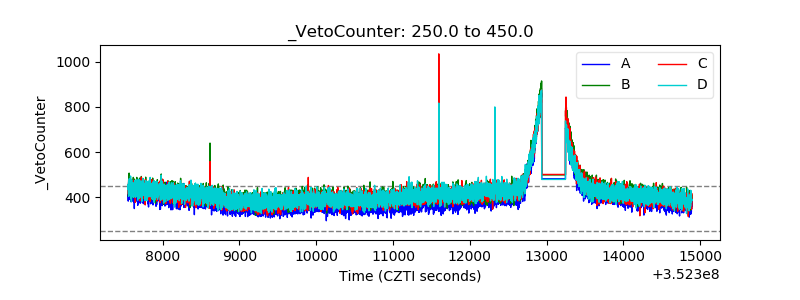 |