| Param | Original file | Final file |
|---|---|---|
| Filename | modeM0/AS1A10_050T03_9000004216_29331cztM0_level2.evt | modeM0/AS1A10_050T03_9000004216_29331cztM0_level2_quad_clean.evt |
| Size (bytes) | 1,026,411,840 | 69,425,280 |
| Size | 978.9 MB | 66.2 MB |
| Events in quadrant A | 3,718,875 | 473,594 |
| Events in quadrant B | 4,245,742 | 474,868 |
| Events in quadrant C | 4,328,561 | 460,272 |
| Events in quadrant D | 18,279,710 | 164,962 |
| Mode M9 | |||
|---|---|---|---|
| Quadrant | BADHDUFLAG | Total packets | Discarded packets |
| A | 0 | 2 | 0 |
| B | 0 | 2 | 0 |
| C | 0 | 2 | 0 |
| D | 0 | 2 | 0 |
| Mode SS | |||
|---|---|---|---|
| Quadrant | BADHDUFLAG | Total packets | Discarded packets |
| A | 0 | 154 | 0 |
| B | 0 | 154 | 0 |
| C | 0 | 154 | 0 |
| D | 0 | 154 | 0 |
| Mode M0 | |||
|---|---|---|---|
| Quadrant | BADHDUFLAG | Total packets | Discarded packets |
| A | 0 | 15807 | 1 |
| B | 0 | 17286 | 1 |
| C | 0 | 17716 | 1 |
| D | 0 | 59287 | 1 |
| Quadrant | Total seconds | Saturated seconds | Saturation percentage |
|---|---|---|---|
| A | 7565 | 117 | 1.546596% |
| B | 7566 | 248 | 3.277822% |
| C | 7566 | 217 | 2.868094% |
| D | 7566 | 7542 | 99.682791% |
Noise dominated data is calculated using 1-second bins in cleaned event files. If a bin has >2000 counts, and if more than 50% of those come from <1% of pixels, then it is considered to be noise-dominated and hence unusable.
| Quadrant | # 1 sec bins | Bins with >0 counts | Bins with >2000 counts | High rate bins dominated by noise | Noise dominated (total time) | Noise dominated (detector-on time) | Marked lightcurve |
|---|---|---|---|---|---|---|---|
| A | 7795 | 7566 | 4 | 4 | 0.05% | 0.05% | 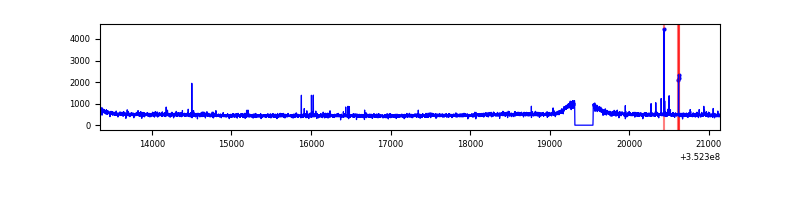 |
| B | 7796 | 7567 | 64 | 64 | 0.82% | 0.85% | 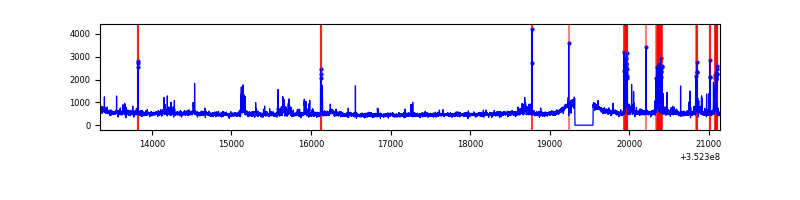 |
| C | 7796 | 7567 | 13 | 13 | 0.17% | 0.17% | 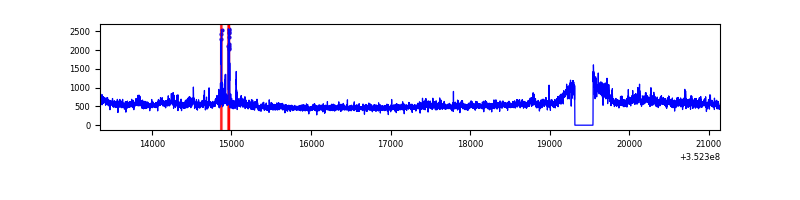 |
| D | 7796 | 7567 | 6230 | 6230 | 79.91% | 82.33% | 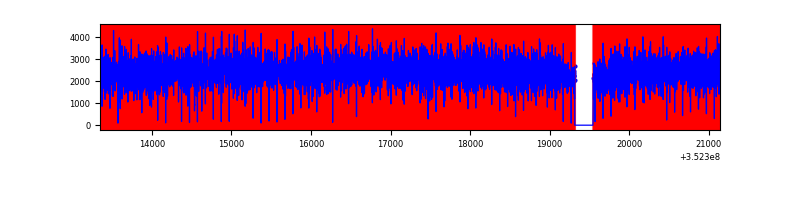 |
Top three noisy pixels from each quadrant. If the there are fewer than three noisy pixels in the level2.evt file, extra rows are filled as -1
| Pixel properties | Quadrant properties | ||||||
|---|---|---|---|---|---|---|---|
| Quadrant | DetID | PixID | Counts | Sigma | Mean | Median | Sigma |
| A | 1 | 113 | 20243 | 99.51 | 951 | 929 | 194.1 |
| A | 13 | 254 | 18777 | 91.95 | 951 | 929 | 194.1 |
| A | 15 | 174 | 14457 | 69.7 | 951 | 929 | 194.1 |
| B | 5 | 172 | 153749 | 850.75 | 938 | 915 | 179.6 |
| B | 10 | 245 | 131401 | 726.35 | 938 | 915 | 179.6 |
| B | 5 | 255 | 109765 | 605.92 | 938 | 915 | 179.6 |
| C | 3 | 233 | 542646 | 2526.96 | 906 | 914 | 214.4 |
| C | 14 | 238 | 156472 | 725.62 | 906 | 914 | 214.4 |
| C | 7 | 247 | 61505 | 282.63 | 906 | 914 | 214.4 |
| D | 12 | 33 | 14471483 | 157401.8 | 375 | 364 | 91.9 |
| D | 1 | 52 | 1456909 | 15842.78 | 375 | 364 | 91.9 |
| D | 12 | 17 | 299856 | 3257.56 | 375 | 364 | 91.9 |
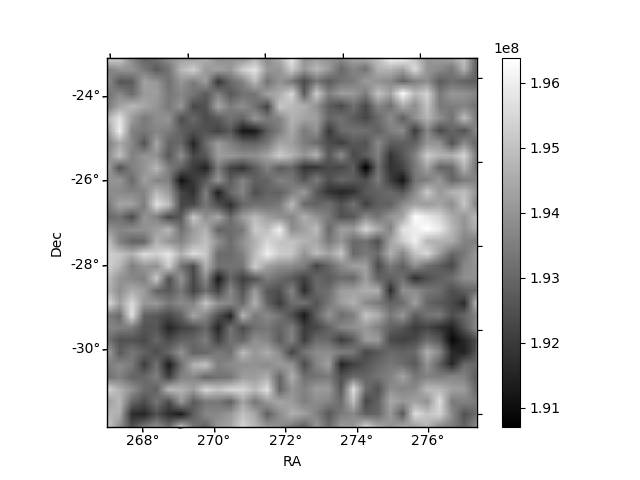
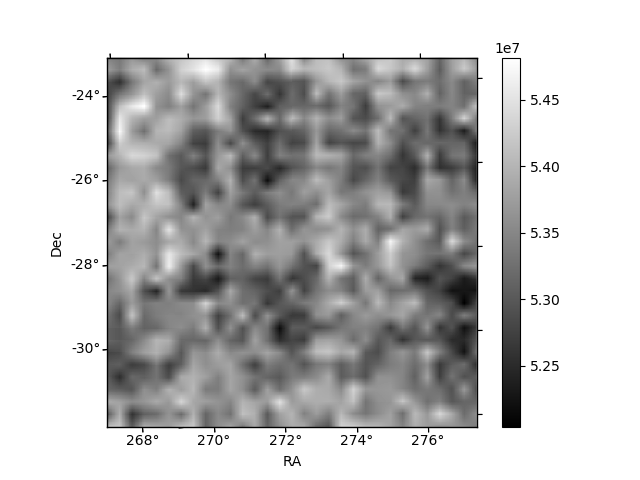
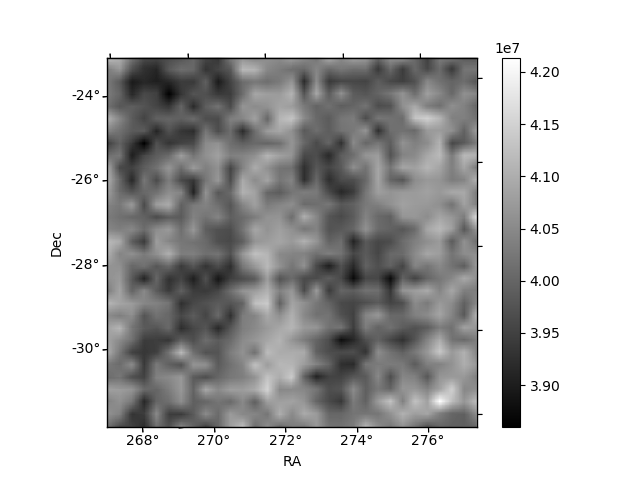
Histogram calculated using DETX and DETY for each event in the final _common_clean file
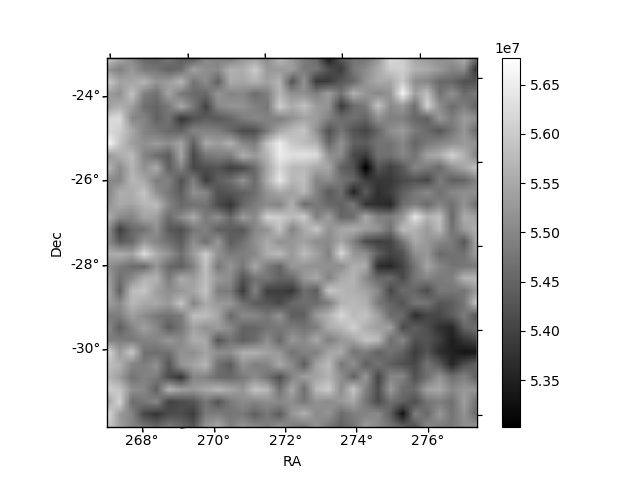
| Quadrant A | 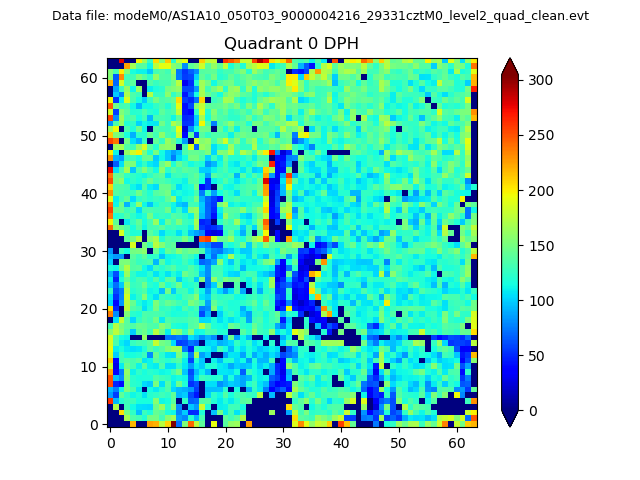 |
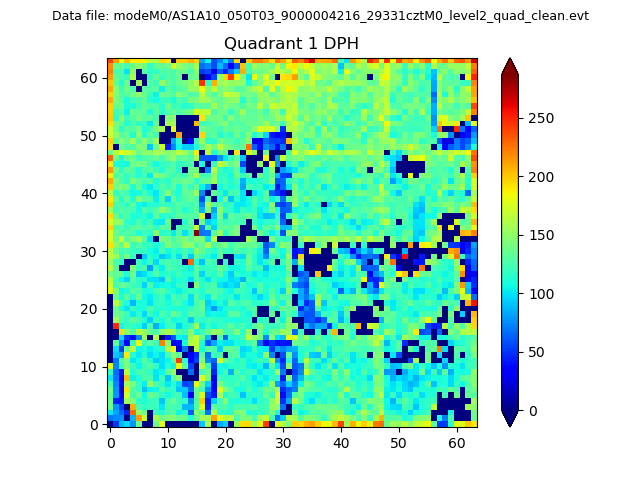 |
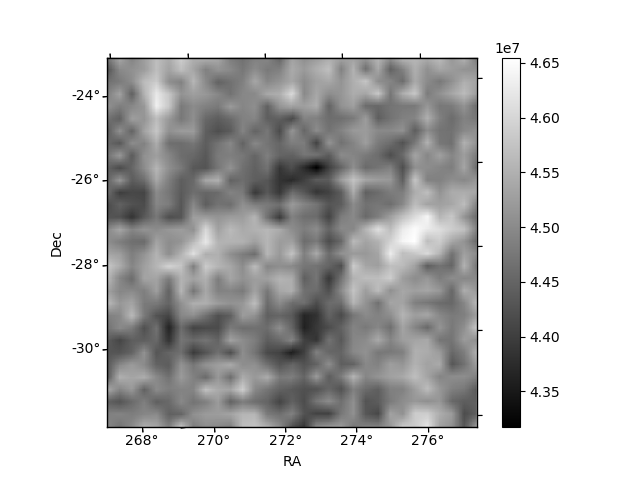
Quadrant B |
|---|---|---|---|
| Quadrant D |  |
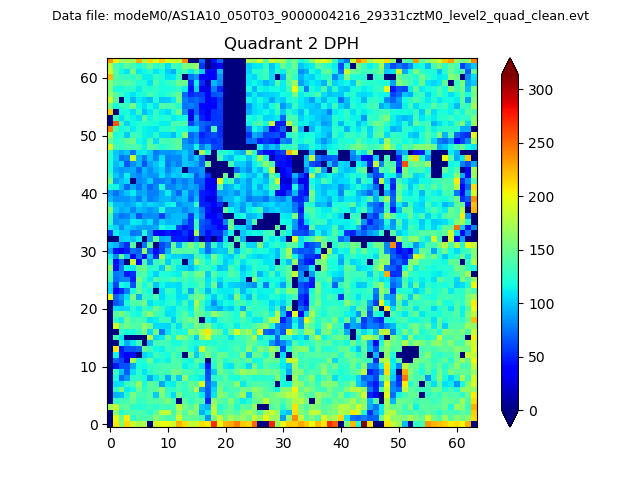 |
Quadrant C |
| Plot type | Count rate plots | Images |
|---|---|---|
| Comparison with Poisson distribution Blue bars denote a histogram of data divided into 1 sec bins. Red curve is a Poisson curve with rate = median count rate of data. |
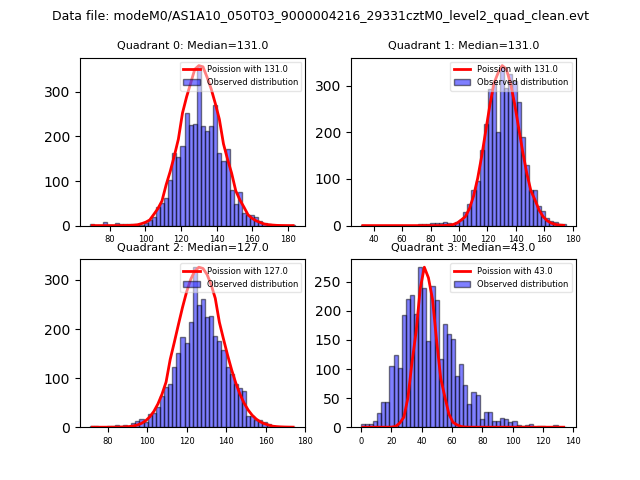 |
 |
| Quadrant-wise count rates Data is divided into 100 sec bins |
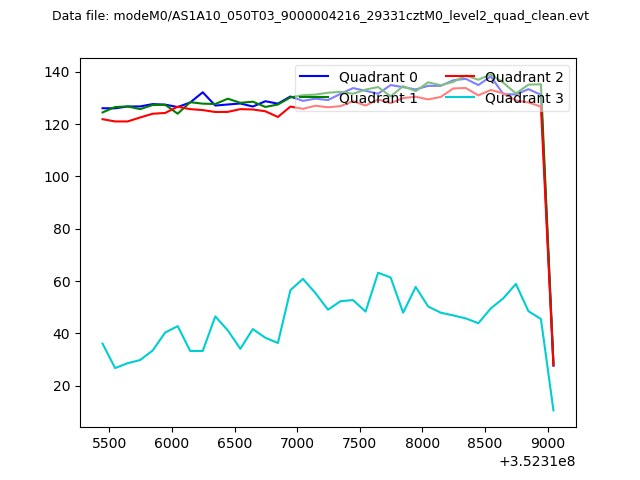 |
|
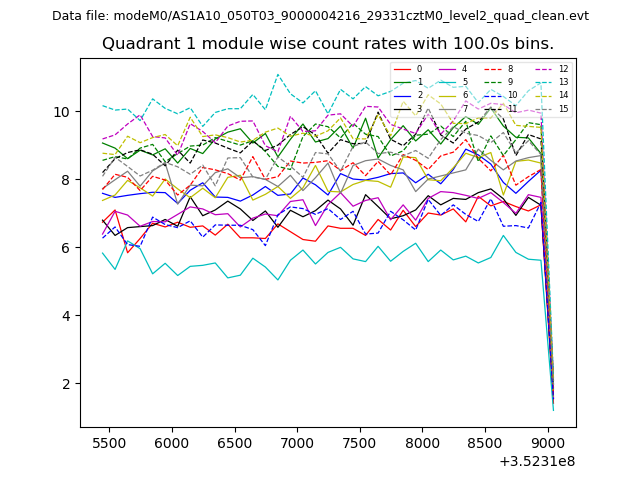
| Module-wise count rates for Quadrant A Data is divided into 100 sec bins |
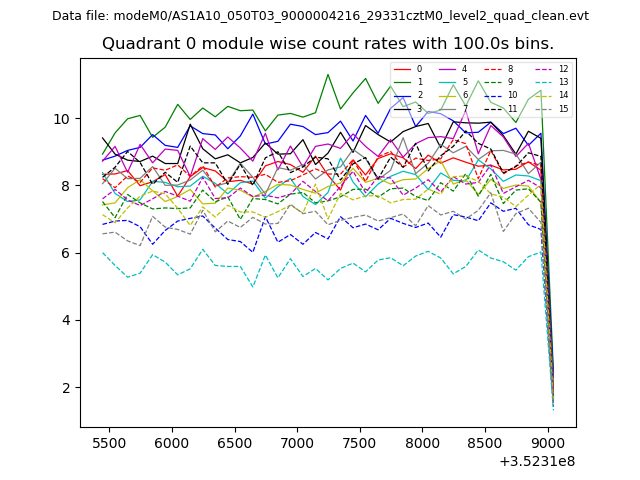 |
 |
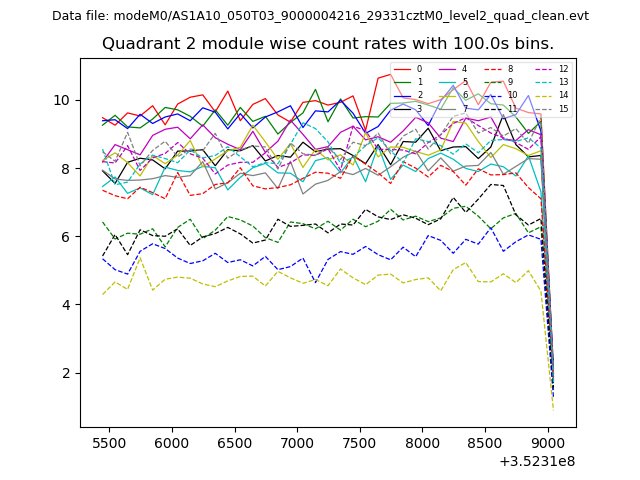
| Module-wise count rates for Quadrant B Data is divided into 100 sec bins |
 |
 |
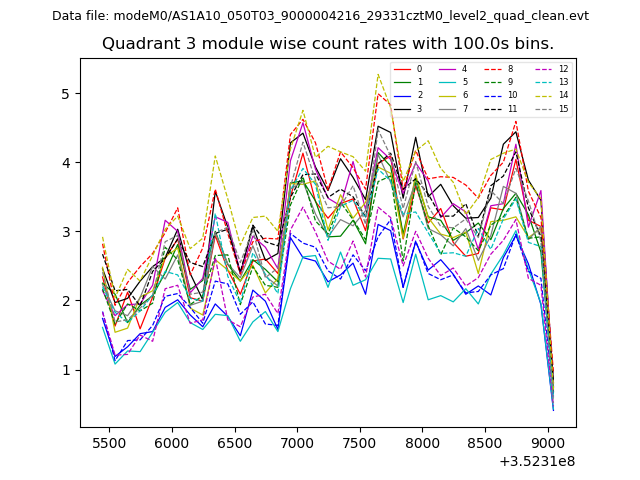
| Module-wise count rates for Quadrant C Data is divided into 100 sec bins |
 |
 |
| Module-wise count rates for Quadrant D Data is divided into 100 sec bins |
 |
 |
| Parameter | Plot |
|---|---|
| CZT HV Monitor | 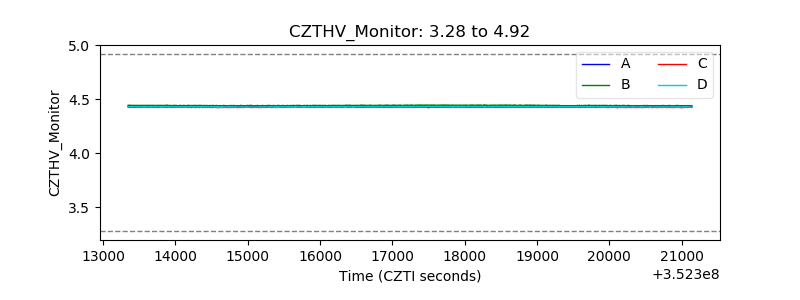 |
| D_VDD | 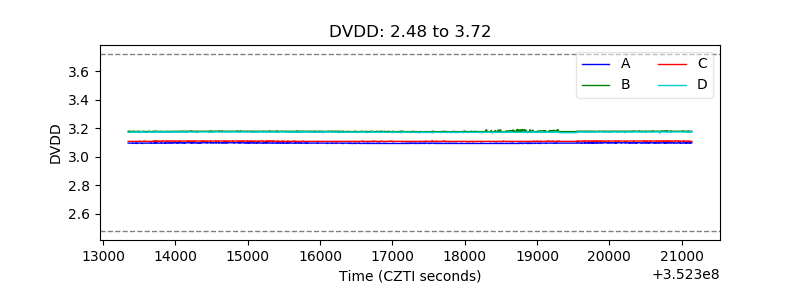 |
| Temperature 1 | 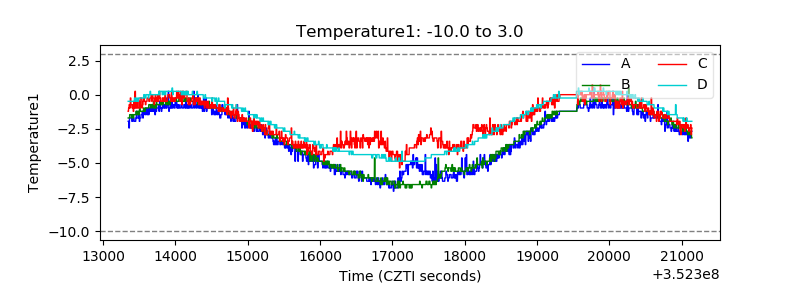 |
| Veto HV Monitor |  |
| Veto LLD | 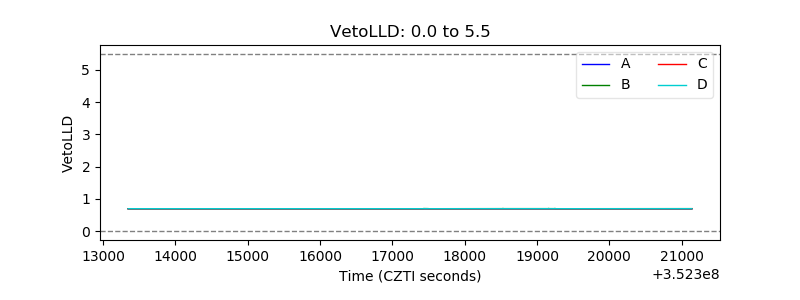 |
| Alpha Counter | 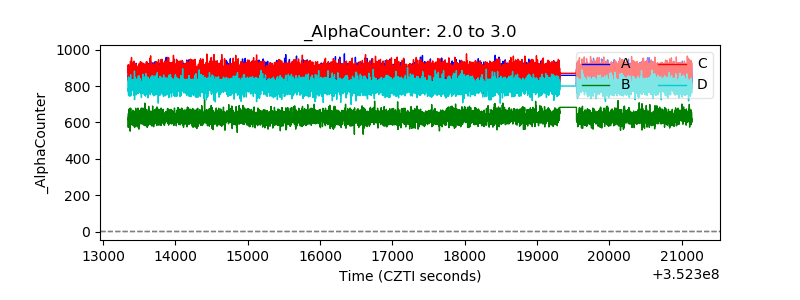 |
| _CPM_Rate |  |
| CZT Counter | 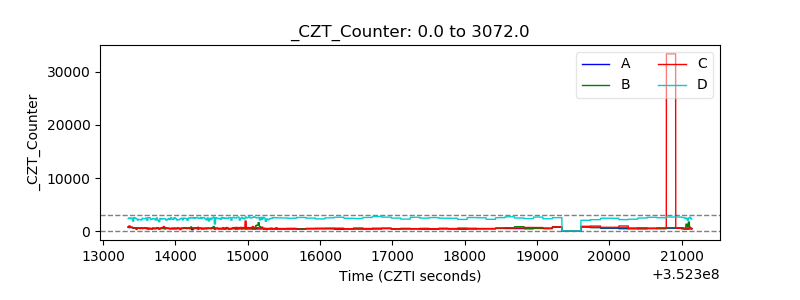 |
| +2.5 Volts monitor | 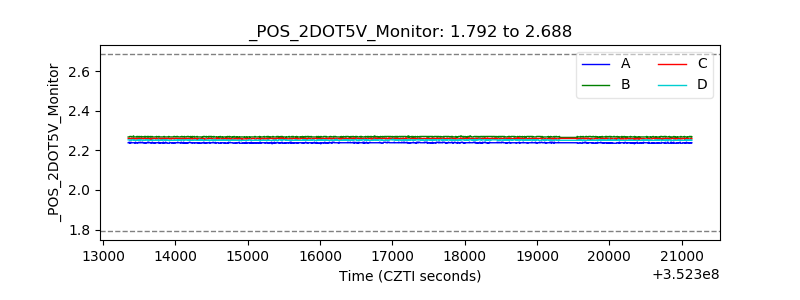 |
| +5 Volts monitor |  |
| _ROLL_ROT | 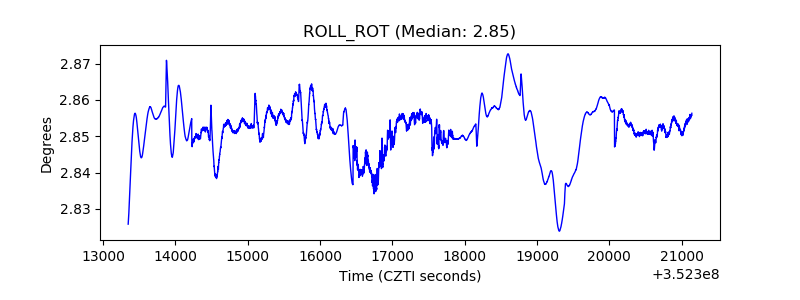 |
| _Roll_DEC | 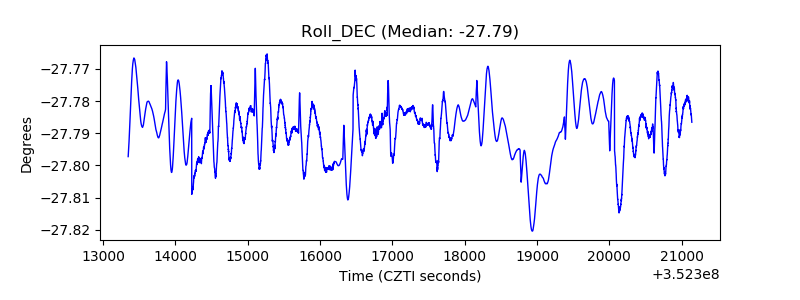 |
| _Roll_RA | 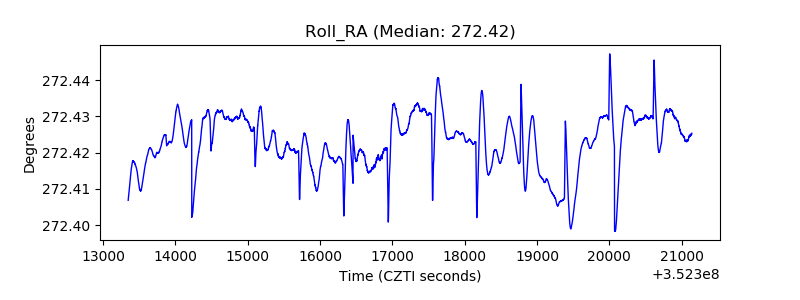 |
| Veto Counter | 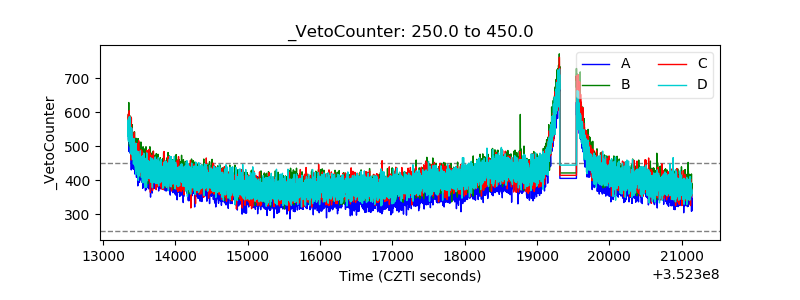 |