| Param | Original file | Final file |
|---|---|---|
| Filename | modeM0/AS1A10_050T03_9000004216_29332cztM0_level2.evt | modeM0/AS1A10_050T03_9000004216_29332cztM0_level2_quad_clean.evt |
| Size (bytes) | 942,552,000 | 74,733,120 |
| Size | 898.9 MB | 71.3 MB |
| Events in quadrant A | 3,384,323 | 512,014 |
| Events in quadrant B | 4,147,085 | 512,405 |
| Events in quadrant C | 3,784,884 | 500,322 |
| Events in quadrant D | 16,763,293 | 256,707 |
| Mode M9 | |||
|---|---|---|---|
| Quadrant | BADHDUFLAG | Total packets | Discarded packets |
| A | 0 | 4 | 0 |
| B | 0 | 4 | 0 |
| C | 0 | 4 | 0 |
| D | 0 | 4 | 0 |
| Mode SS | |||
|---|---|---|---|
| Quadrant | BADHDUFLAG | Total packets | Discarded packets |
| A | 0 | 140 | 0 |
| B | 0 | 140 | 0 |
| C | 0 | 140 | 0 |
| D | 0 | 140 | 0 |
| Mode M0 | |||
|---|---|---|---|
| Quadrant | BADHDUFLAG | Total packets | Discarded packets |
| A | 0 | 14389 | 1 |
| B | 0 | 16733 | 1 |
| C | 0 | 15677 | 1 |
| D | 0 | 54391 | 1 |
| Quadrant | Total seconds | Saturated seconds | Saturation percentage |
|---|---|---|---|
| A | 6881 | 95 | 1.380613% |
| B | 6882 | 270 | 3.923278% |
| C | 6882 | 140 | 2.034292% |
| D | 6882 | 6789 | 98.648649% |
Noise dominated data is calculated using 1-second bins in cleaned event files. If a bin has >2000 counts, and if more than 50% of those come from <1% of pixels, then it is considered to be noise-dominated and hence unusable.
| Quadrant | # 1 sec bins | Bins with >0 counts | Bins with >2000 counts | High rate bins dominated by noise | Noise dominated (total time) | Noise dominated (detector-on time) | Marked lightcurve |
|---|---|---|---|---|---|---|---|
| A | 7271 | 6883 | 28 | 28 | 0.39% | 0.41% | 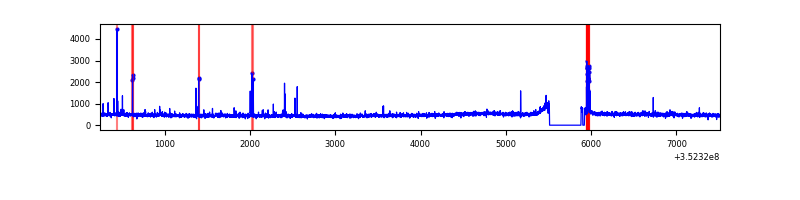 |
| B | 7272 | 6884 | 121 | 121 | 1.66% | 1.76% | 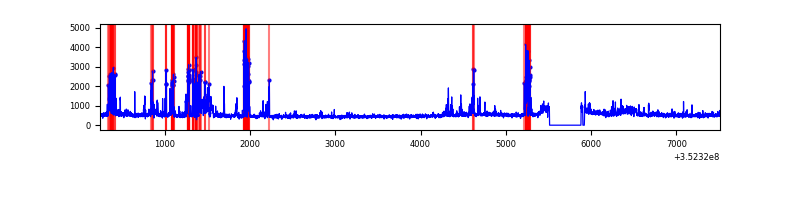 |
| C | 7272 | 6884 | 2 | 2 | 0.03% | 0.03% | 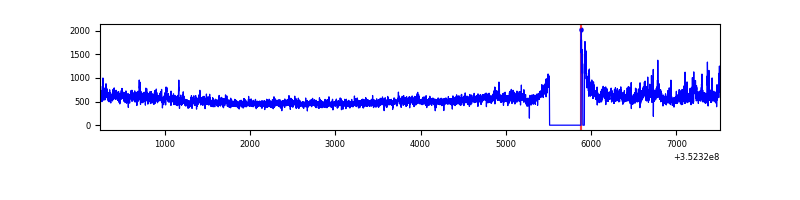 |
| D | 7272 | 6884 | 5917 | 5917 | 81.37% | 85.95% | 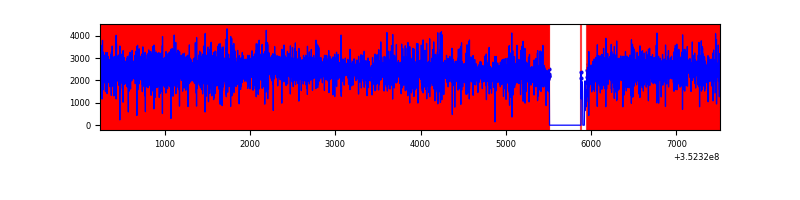 |
Top three noisy pixels from each quadrant. If the there are fewer than three noisy pixels in the level2.evt file, extra rows are filled as -1
| Pixel properties | Quadrant properties | ||||||
|---|---|---|---|---|---|---|---|
| Quadrant | DetID | PixID | Counts | Sigma | Mean | Median | Sigma |
| A | 15 | 174 | 91877 | 537.37 | 838 | 818 | 169.5 |
| A | 1 | 113 | 22612 | 128.61 | 838 | 818 | 169.5 |
| A | 13 | 254 | 16642 | 93.38 | 838 | 818 | 169.5 |
| B | 5 | 255 | 378232 | 2369.75 | 827 | 805 | 159.3 |
| B | 5 | 172 | 180436 | 1127.85 | 827 | 805 | 159.3 |
| B | 10 | 245 | 96914 | 603.44 | 827 | 805 | 159.3 |
| C | 3 | 233 | 484159 | 2531.93 | 805 | 809 | 190.9 |
| C | 14 | 238 | 132433 | 689.49 | 805 | 809 | 190.9 |
| C | 2 | 114 | 16947 | 84.54 | 805 | 809 | 190.9 |
| D | 12 | 33 | 12919183 | 118911.54 | 443 | 430 | 108.6 |
| D | 1 | 52 | 1400521 | 12887.23 | 443 | 430 | 108.6 |
| D | 13 | 104 | 353952 | 3254.02 | 443 | 430 | 108.6 |
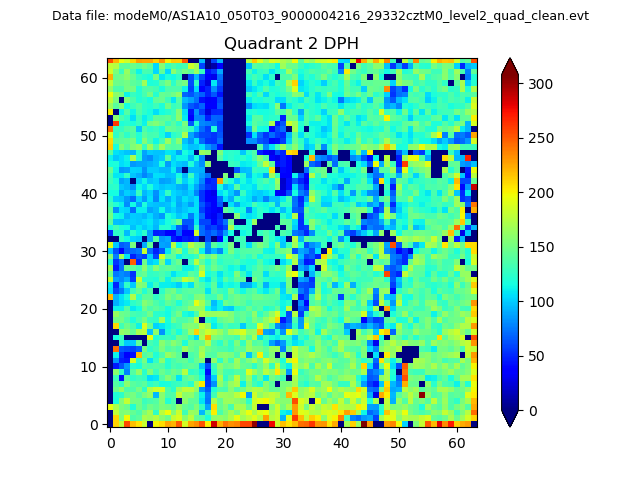
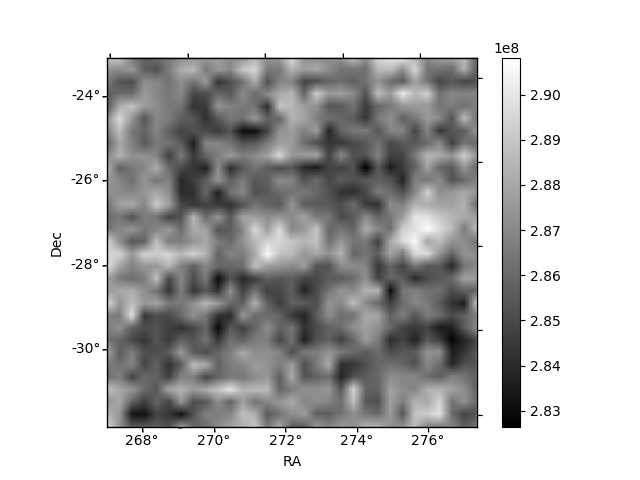
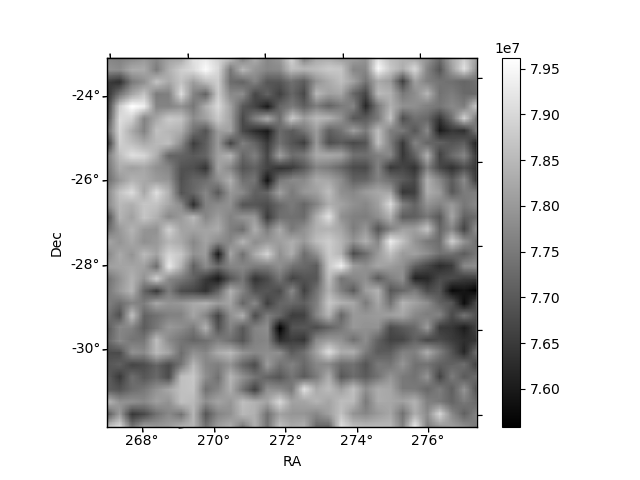
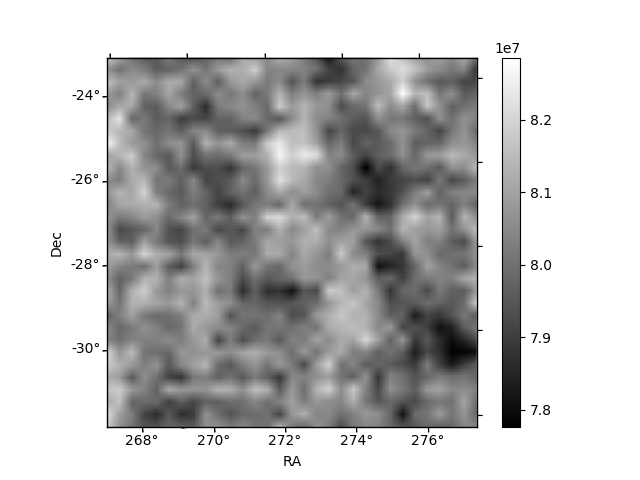
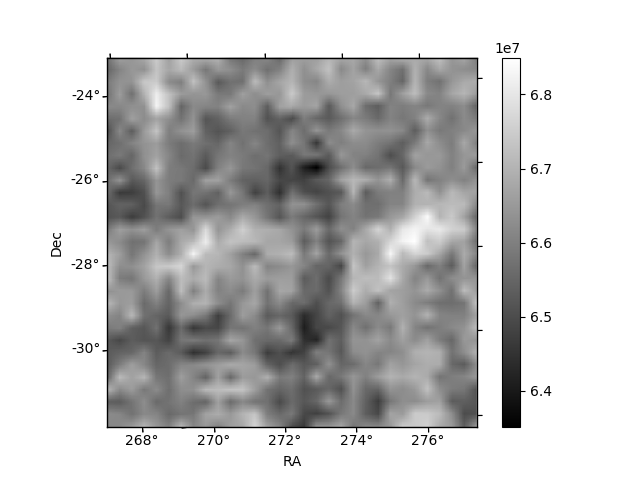
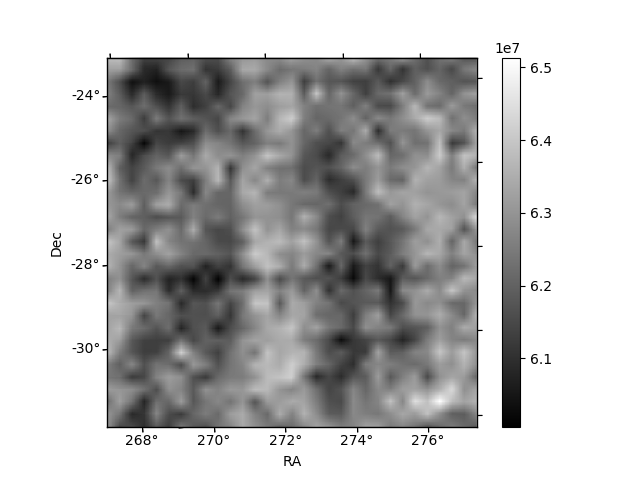
Histogram calculated using DETX and DETY for each event in the final _common_clean file
| Quadrant A | 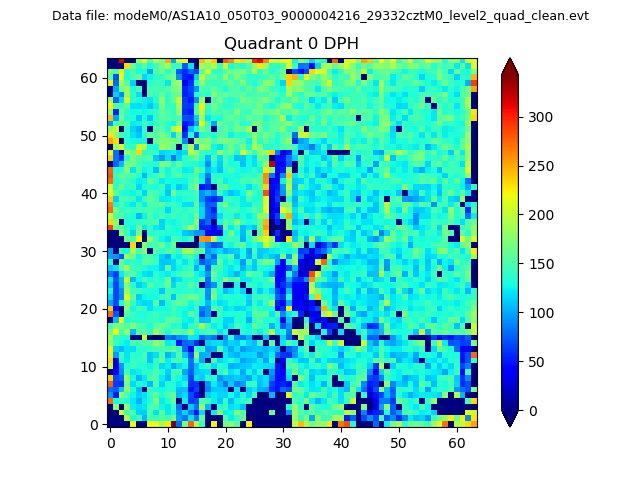 |
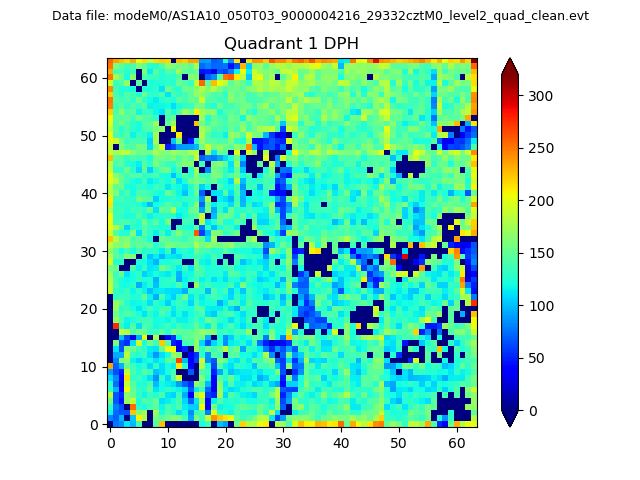 |
Quadrant B |
|---|---|---|---|
| Quadrant D | 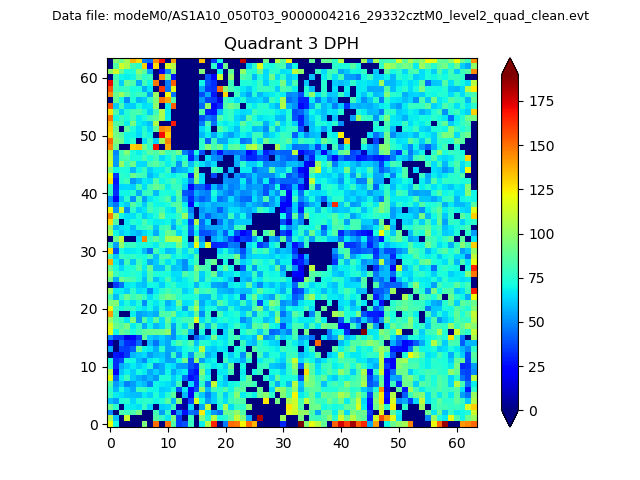 |
 |
Quadrant C |
| Plot type | Count rate plots | Images |
|---|---|---|
| Comparison with Poisson distribution Blue bars denote a histogram of data divided into 1 sec bins. Red curve is a Poisson curve with rate = median count rate of data. |
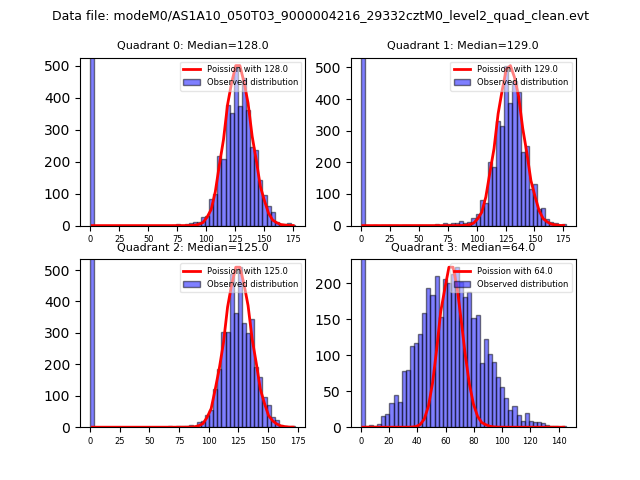 |
 |
| Quadrant-wise count rates Data is divided into 100 sec bins |
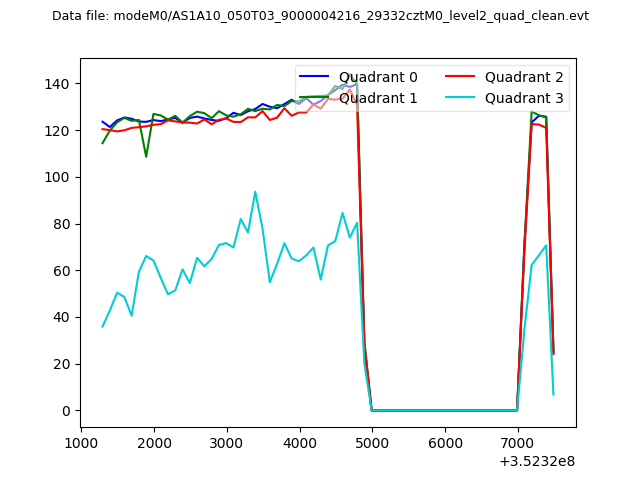 |
|
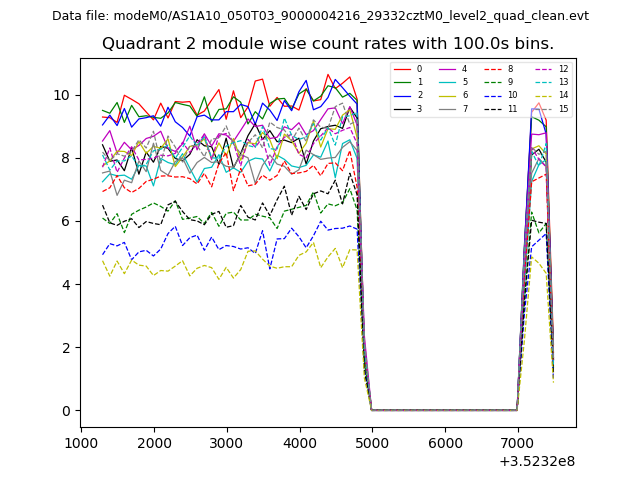
| Module-wise count rates for Quadrant A Data is divided into 100 sec bins |
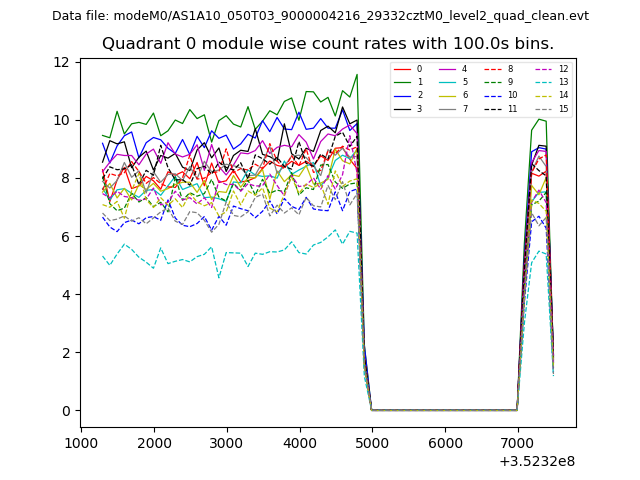 |
 |
| Module-wise count rates for Quadrant B Data is divided into 100 sec bins |
 |
 |
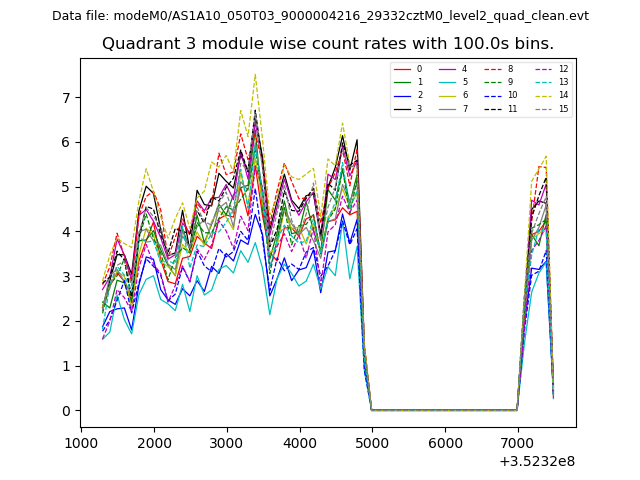
| Module-wise count rates for Quadrant C Data is divided into 100 sec bins |
 |
 |
| Module-wise count rates for Quadrant D Data is divided into 100 sec bins |
 |
 |
| Parameter | Plot |
|---|---|
| CZT HV Monitor | 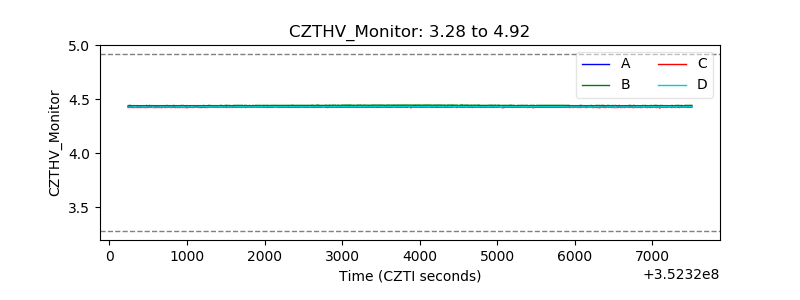 |
| D_VDD | 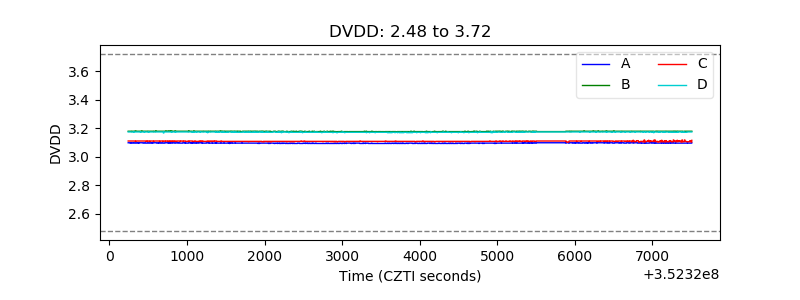 |
| Temperature 1 | 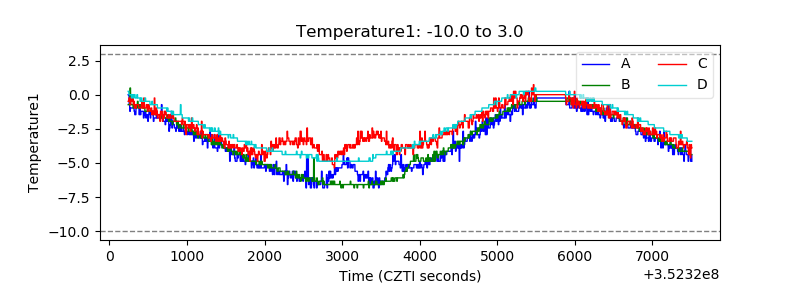 |
| Veto HV Monitor | 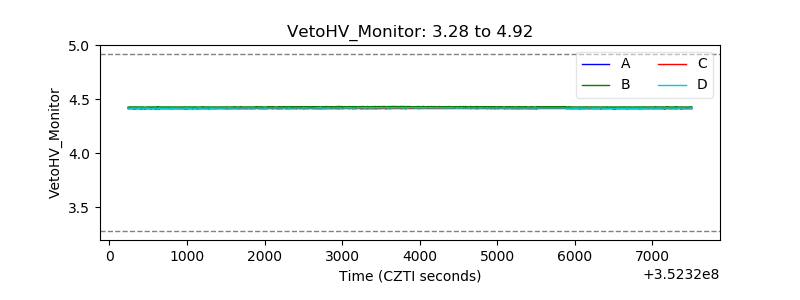 |
| Veto LLD | 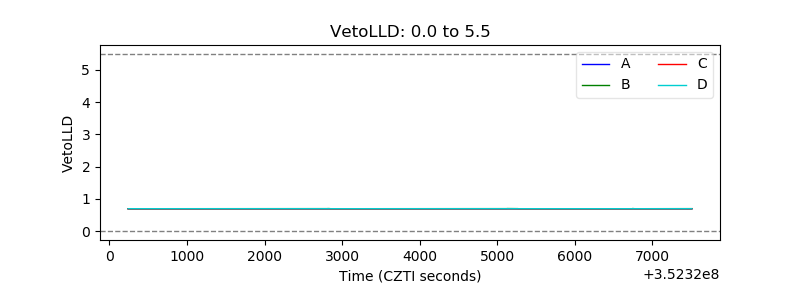 |
| Alpha Counter | 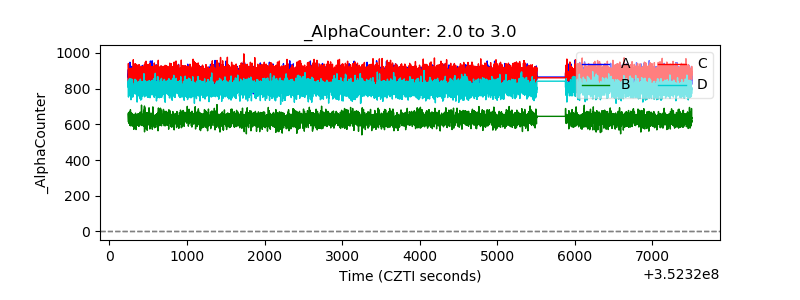 |
| _CPM_Rate | 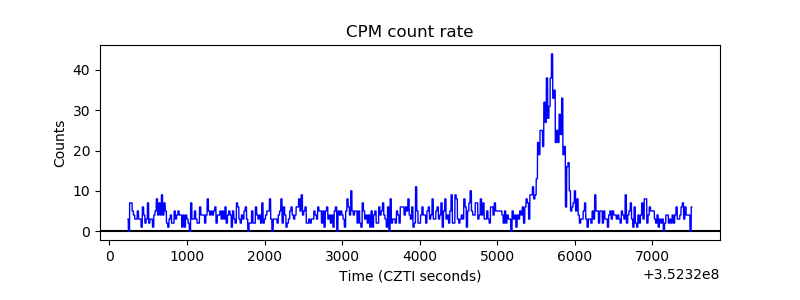 |
| CZT Counter | 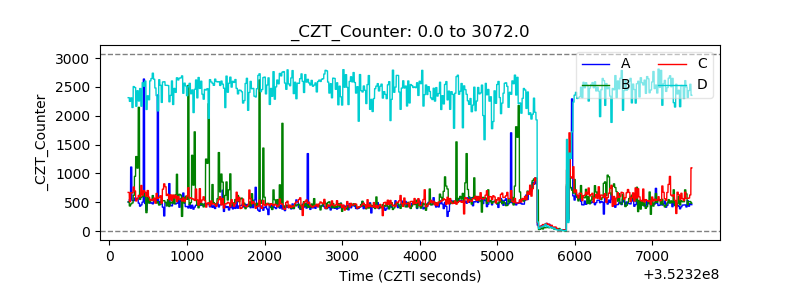 |
| +2.5 Volts monitor |  |
| +5 Volts monitor |  |
| _ROLL_ROT | 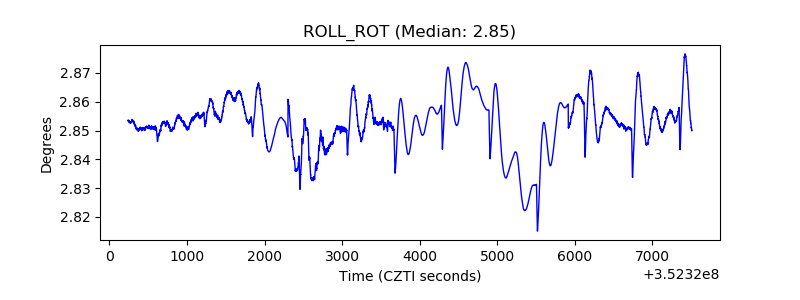 |
| _Roll_DEC | 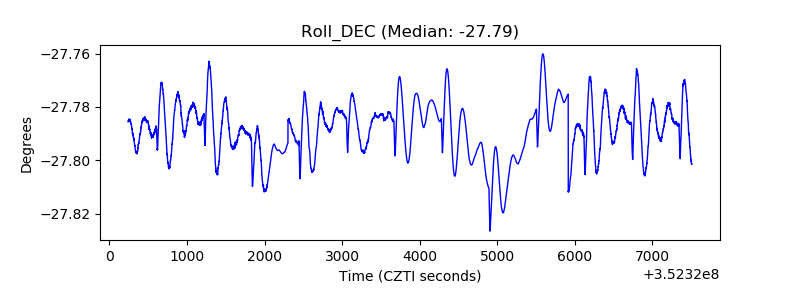 |
| _Roll_RA | 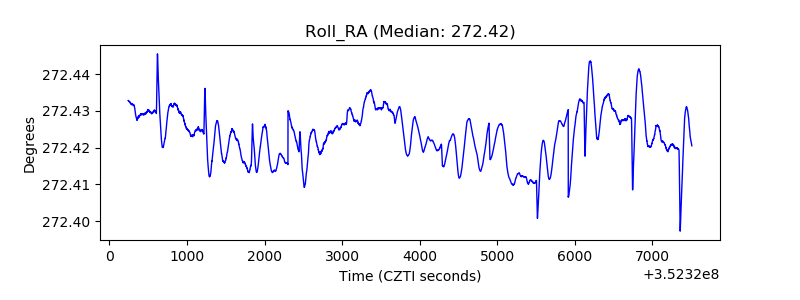 |
| Veto Counter | 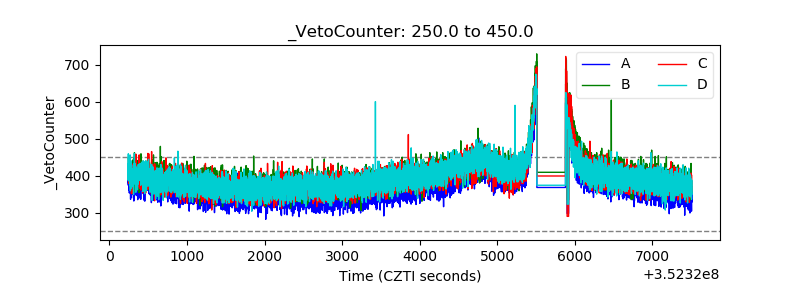 |