| Param | Original file | Final file |
|---|---|---|
| Filename | modeM0/AS1A10_050T03_9000004216_29334cztM0_level2.evt | modeM0/AS1A10_050T03_9000004216_29334cztM0_level2_quad_clean.evt |
| Size (bytes) | 958,299,840 | 95,967,360 |
| Size | 913.9 MB | 91.5 MB |
| Events in quadrant A | 3,703,813 | 641,048 |
| Events in quadrant B | 4,429,084 | 641,256 |
| Events in quadrant C | 4,727,002 | 620,467 |
| Events in quadrant D | 15,636,230 | 460,483 |
| Mode M9 | |||
|---|---|---|---|
| Quadrant | BADHDUFLAG | Total packets | Discarded packets |
| A | 0 | 6 | 0 |
| B | 0 | 6 | 0 |
| C | 0 | 6 | 0 |
| D | 0 | 6 | 0 |
| Mode SS | |||
|---|---|---|---|
| Quadrant | BADHDUFLAG | Total packets | Discarded packets |
| A | 0 | 156 | 0 |
| B | 0 | 156 | 0 |
| C | 0 | 156 | 0 |
| D | 0 | 156 | 0 |
| Mode M0 | |||
|---|---|---|---|
| Quadrant | BADHDUFLAG | Total packets | Discarded packets |
| A | 0 | 16035 | 1 |
| B | 0 | 18101 | 1 |
| C | 0 | 19151 | 1 |
| D | 0 | 51792 | 6 |
| Quadrant | Total seconds | Saturated seconds | Saturation percentage |
|---|---|---|---|
| A | 7798 | 35 | 0.448833% |
| B | 7799 | 151 | 1.936146% |
| C | 7799 | 114 | 1.461726% |
| D | 7798 | 4988 | 63.965119% |
Noise dominated data is calculated using 1-second bins in cleaned event files. If a bin has >2000 counts, and if more than 50% of those come from <1% of pixels, then it is considered to be noise-dominated and hence unusable.
| Quadrant | # 1 sec bins | Bins with >0 counts | Bins with >2000 counts | High rate bins dominated by noise | Noise dominated (total time) | Noise dominated (detector-on time) | Marked lightcurve |
|---|---|---|---|---|---|---|---|
| A | 8348 | 7799 | 1 | 1 | 0.01% | 0.01% | 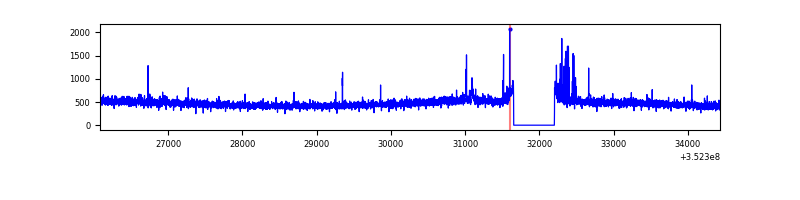 |
| B | 8349 | 7799 | 90 | 90 | 1.08% | 1.15% | 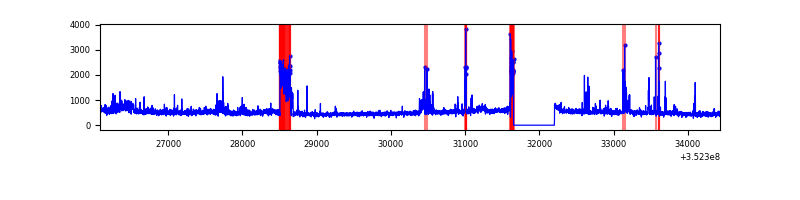 |
| C | 8349 | 7800 | 3 | 3 | 0.04% | 0.04% | 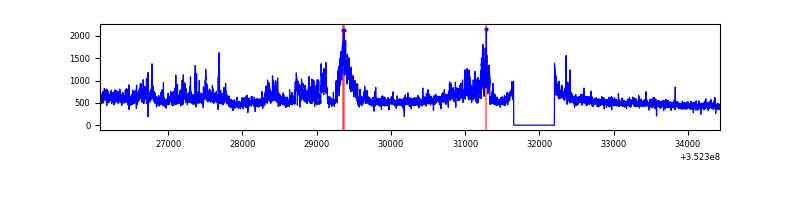 |
| D | 8348 | 7798 | 4542 | 4542 | 54.41% | 58.25% | 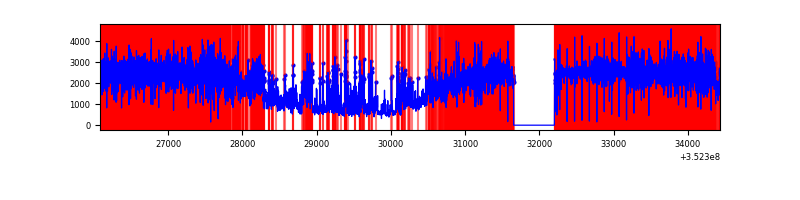 |
Top three noisy pixels from each quadrant. If the there are fewer than three noisy pixels in the level2.evt file, extra rows are filled as -1
| Pixel properties | Quadrant properties | ||||||
|---|---|---|---|---|---|---|---|
| Quadrant | DetID | PixID | Counts | Sigma | Mean | Median | Sigma |
| A | 1 | 113 | 31432 | 160.74 | 940 | 922 | 189.8 |
| A | 15 | 174 | 20087 | 100.97 | 940 | 922 | 189.8 |
| A | 13 | 254 | 18565 | 92.95 | 940 | 922 | 189.8 |
| B | 10 | 245 | 459991 | 2572.02 | 930 | 907 | 178.5 |
| B | 5 | 172 | 123095 | 684.56 | 930 | 907 | 178.5 |
| B | 0 | 190 | 60133 | 331.81 | 930 | 907 | 178.5 |
| C | 3 | 233 | 1013544 | 4716.19 | 903 | 908 | 214.7 |
| C | 14 | 238 | 144632 | 669.37 | 903 | 908 | 214.7 |
| C | 2 | 114 | 19078 | 84.62 | 903 | 908 | 214.7 |
| D | 12 | 33 | 10723620 | 72902.4 | 609 | 592 | 147.1 |
| D | 1 | 52 | 1618263 | 10998.02 | 609 | 592 | 147.1 |
| D | 13 | 104 | 476004 | 3232.17 | 609 | 592 | 147.1 |
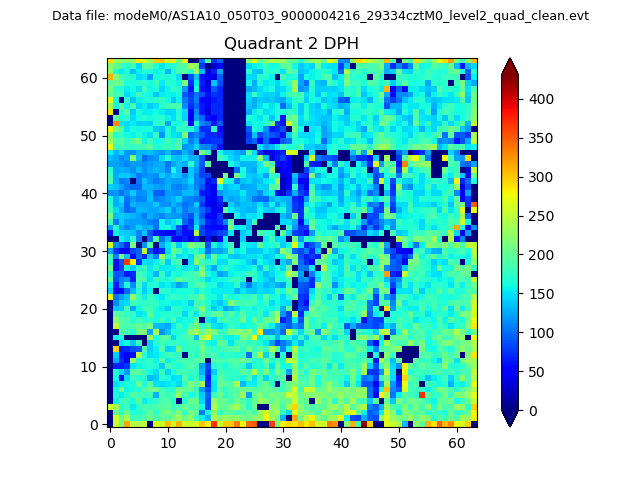
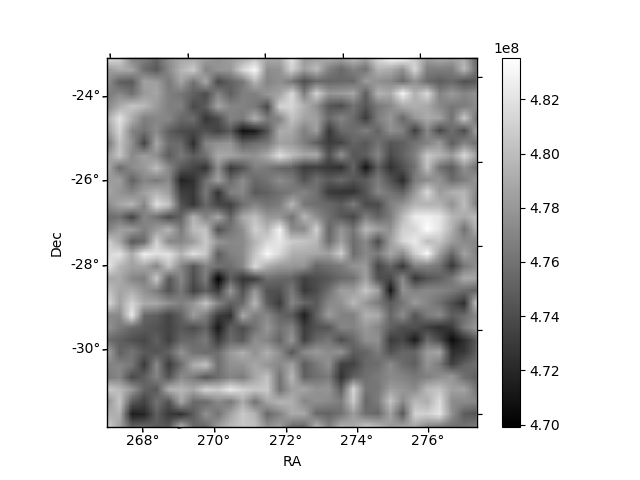
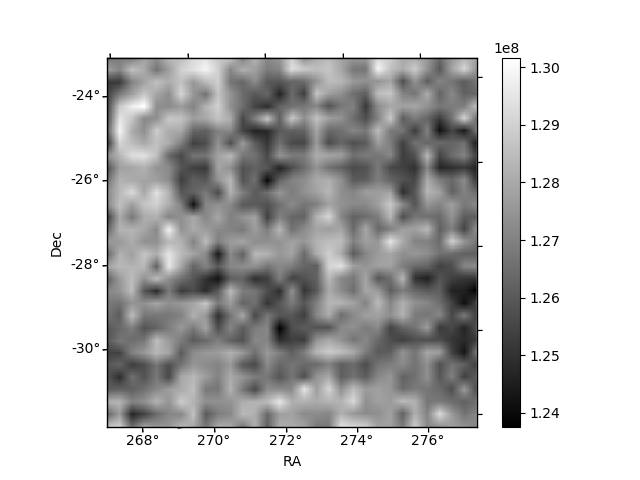
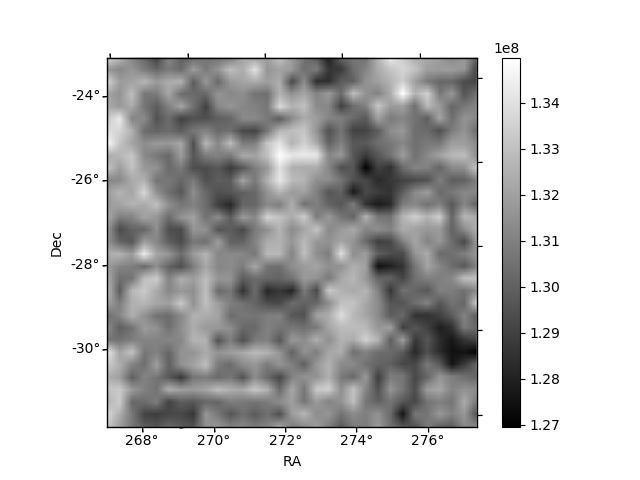
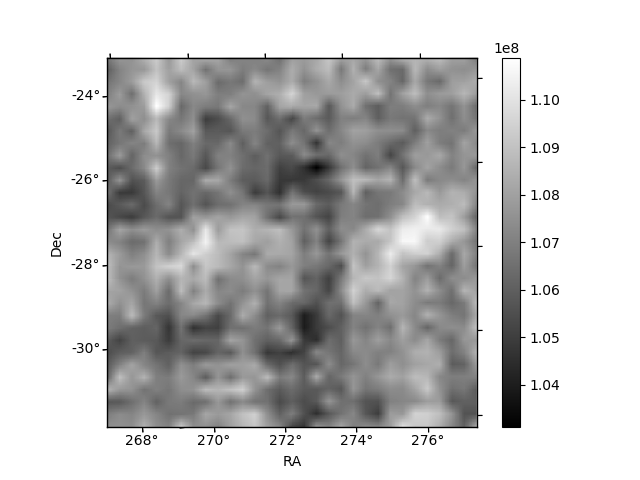
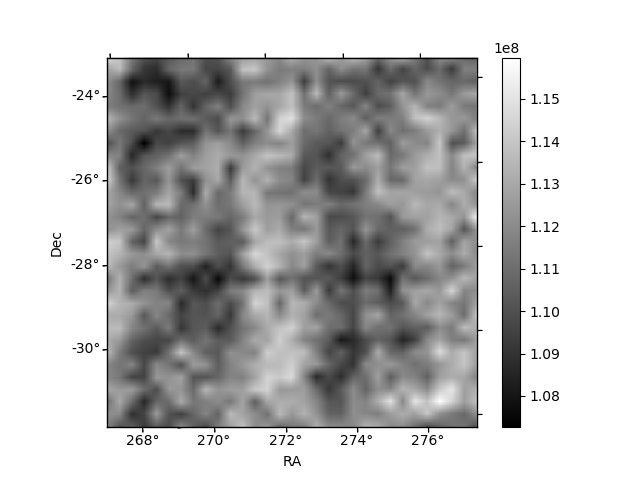
Histogram calculated using DETX and DETY for each event in the final _common_clean file
| Quadrant A | 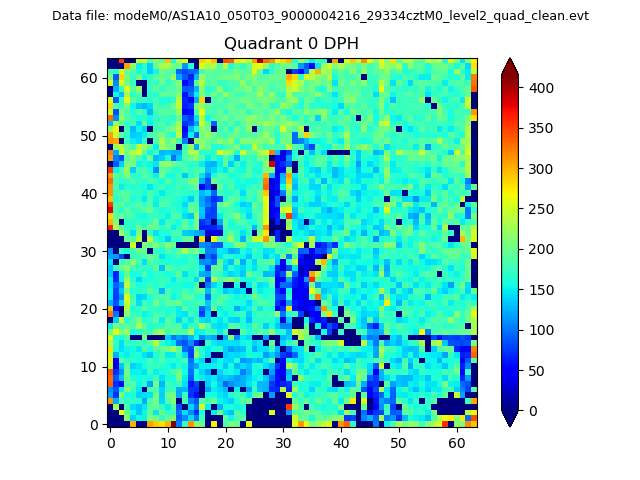 |
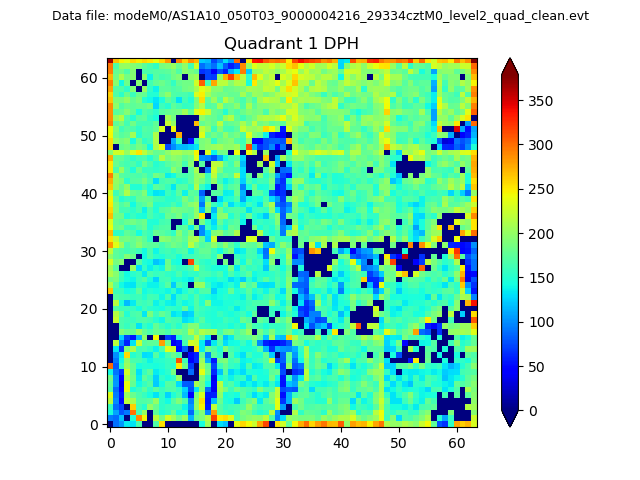 |
Quadrant B |
|---|---|---|---|
| Quadrant D | 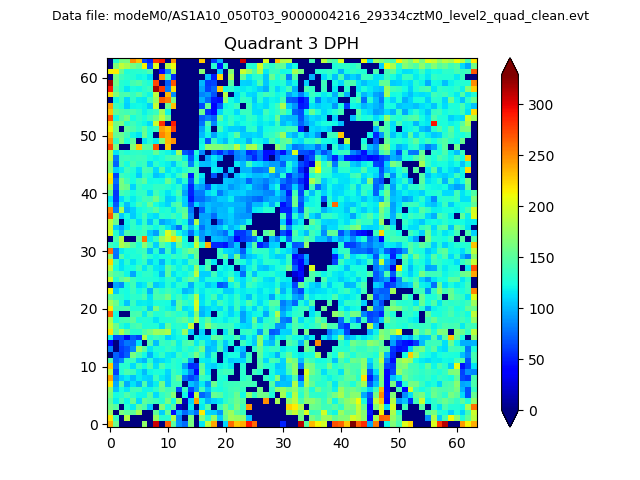 |
 |
Quadrant C |
| Plot type | Count rate plots | Images |
|---|---|---|
| Comparison with Poisson distribution Blue bars denote a histogram of data divided into 1 sec bins. Red curve is a Poisson curve with rate = median count rate of data. |
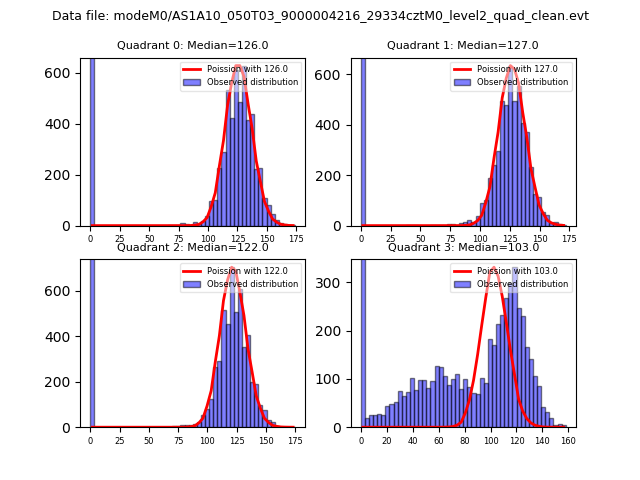 |
 |
| Quadrant-wise count rates Data is divided into 100 sec bins |
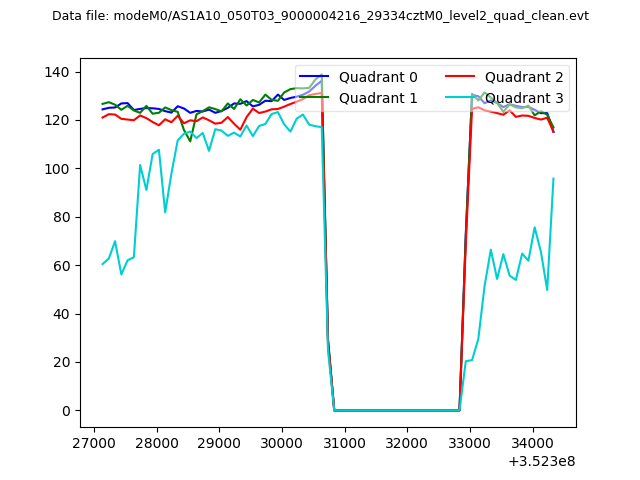 |
|
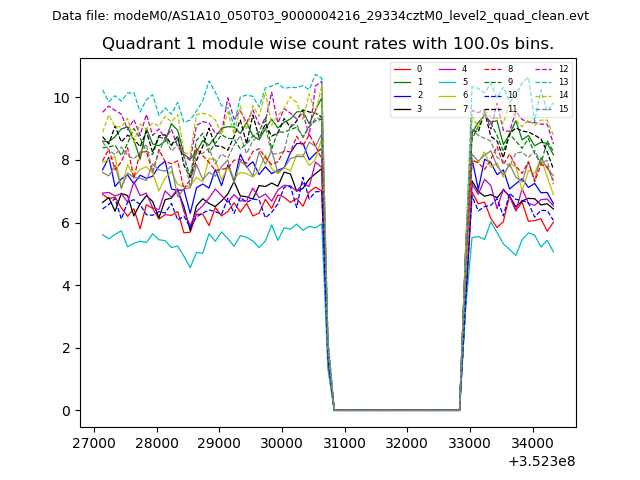
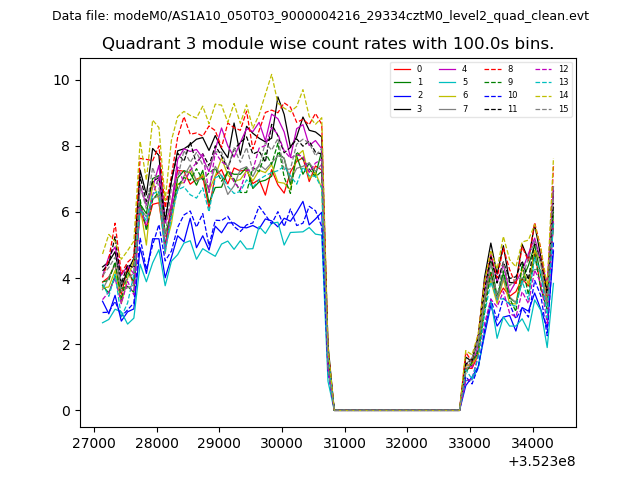
| Module-wise count rates for Quadrant A Data is divided into 100 sec bins |
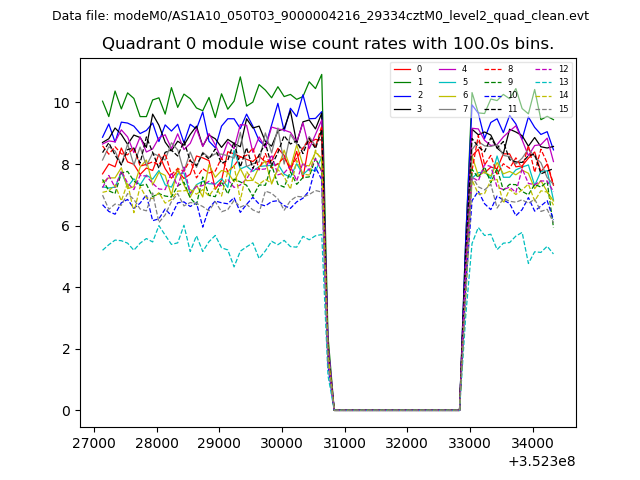 |
 |
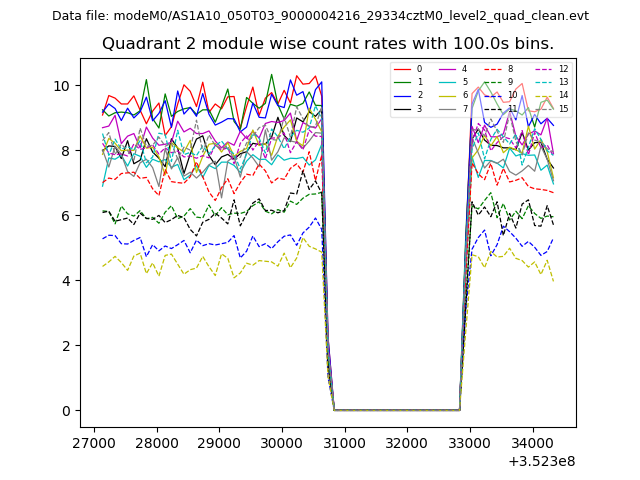
| Module-wise count rates for Quadrant B Data is divided into 100 sec bins |
 |
 |
| Module-wise count rates for Quadrant C Data is divided into 100 sec bins |
 |
 |
| Module-wise count rates for Quadrant D Data is divided into 100 sec bins |
 |
 |
| Parameter | Plot |
|---|---|
| CZT HV Monitor | 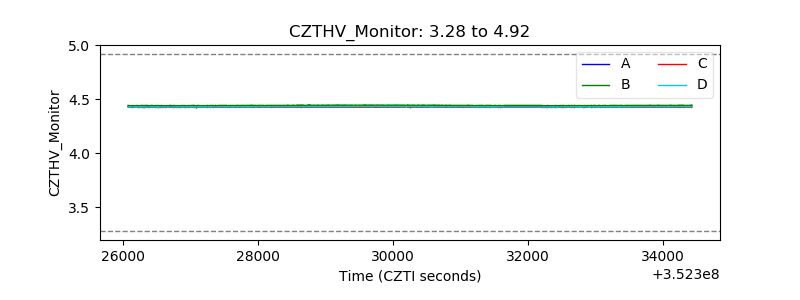 |
| D_VDD | 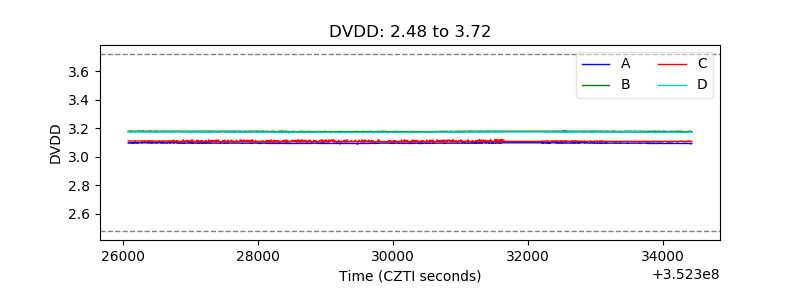 |
| Temperature 1 | 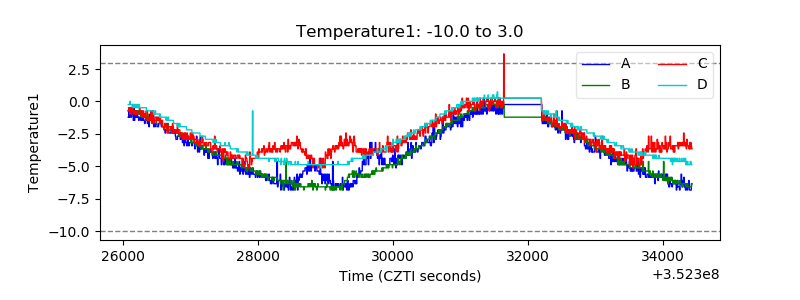 |
| Veto HV Monitor | 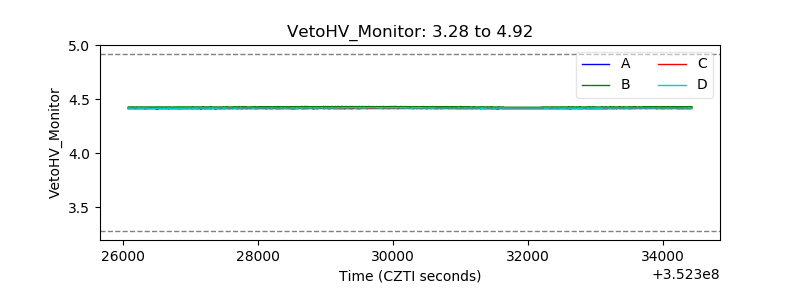 |
| Veto LLD | 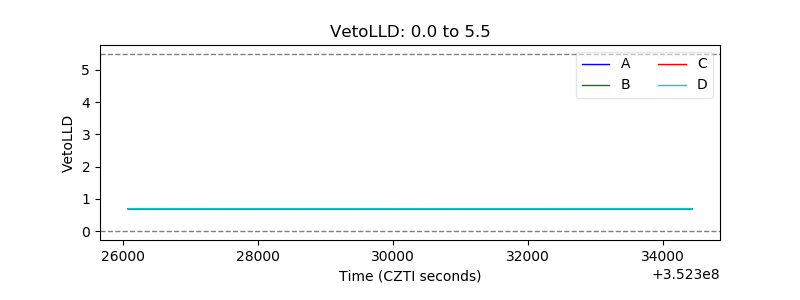 |
| Alpha Counter | 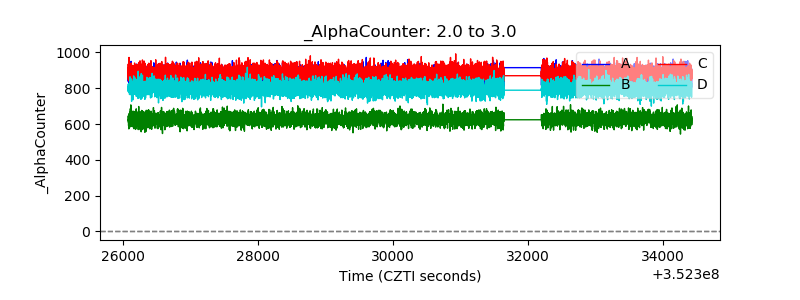 |
| _CPM_Rate | 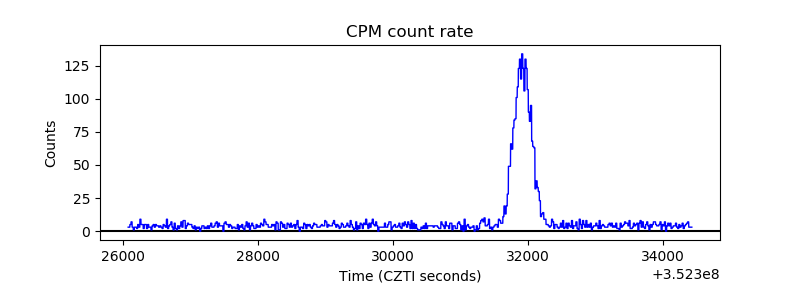 |
| CZT Counter | 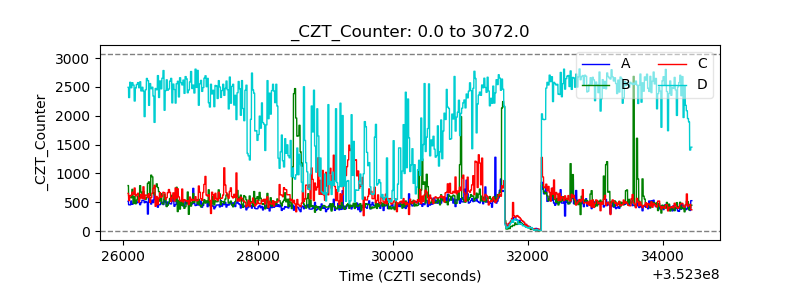 |
| +2.5 Volts monitor |  |
| +5 Volts monitor |  |
| _ROLL_ROT | 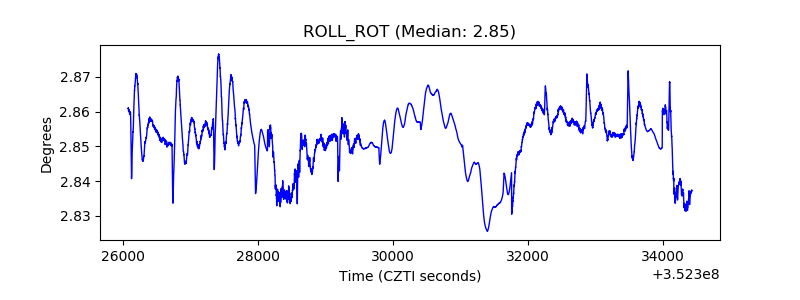 |
| _Roll_DEC | 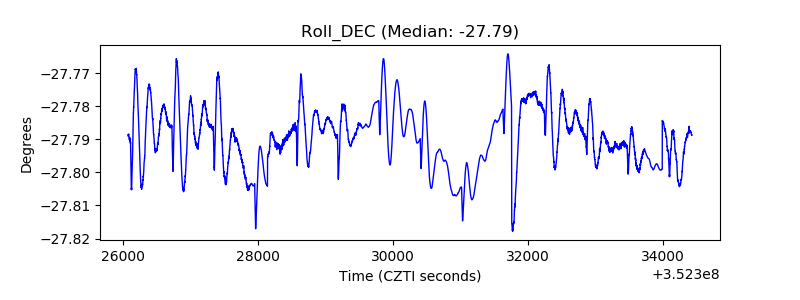 |
| _Roll_RA | 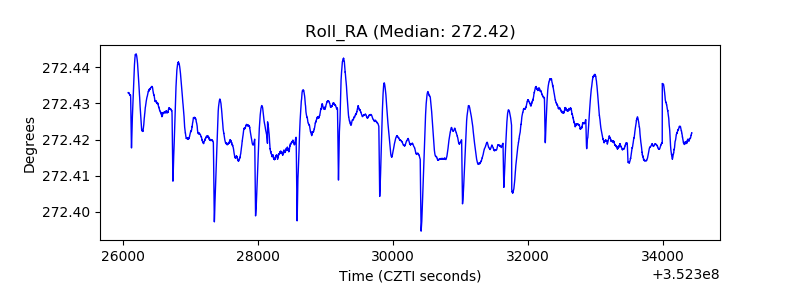 |
| Veto Counter | 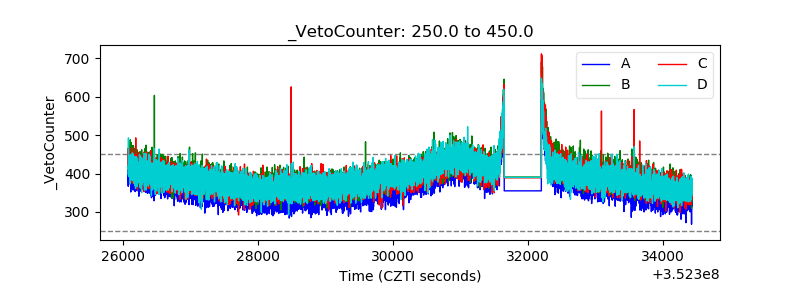 |