| Param | Original file | Final file |
|---|---|---|
| Filename | modeM0/AS1A10_050T03_9000004216_29335cztM0_level2.evt | modeM0/AS1A10_050T03_9000004216_29335cztM0_level2_quad_clean.evt |
| Size (bytes) | 917,657,280 | 111,781,440 |
| Size | 875.1 MB | 106.6 MB |
| Events in quadrant A | 3,585,188 | 773,104 |
| Events in quadrant B | 3,853,840 | 780,844 |
| Events in quadrant C | 3,725,374 | 760,994 |
| Events in quadrant D | 16,103,978 | 530,665 |
| Mode M9 | |||
|---|---|---|---|
| Quadrant | BADHDUFLAG | Total packets | Discarded packets |
| A | 0 | 7 | 0 |
| B | 0 | 7 | 0 |
| C | 0 | 7 | 0 |
| D | 0 | 7 | 0 |
| Mode SS | |||
|---|---|---|---|
| Quadrant | BADHDUFLAG | Total packets | Discarded packets |
| A | 0 | 158 | 0 |
| B | 0 | 158 | 0 |
| C | 0 | 158 | 0 |
| D | 0 | 158 | 0 |
| Mode M0 | |||
|---|---|---|---|
| Quadrant | BADHDUFLAG | Total packets | Discarded packets |
| A | 0 | 15912 | 1 |
| B | 0 | 16649 | 1 |
| C | 0 | 15882 | 1 |
| D | 0 | 53154 | 1 |
| Quadrant | Total seconds | Saturated seconds | Saturation percentage |
|---|---|---|---|
| A | 7733 | 33 | 0.426743% |
| B | 7734 | 106 | 1.370572% |
| C | 7734 | 74 | 0.956814% |
| D | 7734 | 4959 | 64.119472% |
Noise dominated data is calculated using 1-second bins in cleaned event files. If a bin has >2000 counts, and if more than 50% of those come from <1% of pixels, then it is considered to be noise-dominated and hence unusable.
| Quadrant | # 1 sec bins | Bins with >0 counts | Bins with >2000 counts | High rate bins dominated by noise | Noise dominated (total time) | Noise dominated (detector-on time) | Marked lightcurve |
|---|---|---|---|---|---|---|---|
| A | 8458 | 7734 | 3 | 3 | 0.04% | 0.04% | 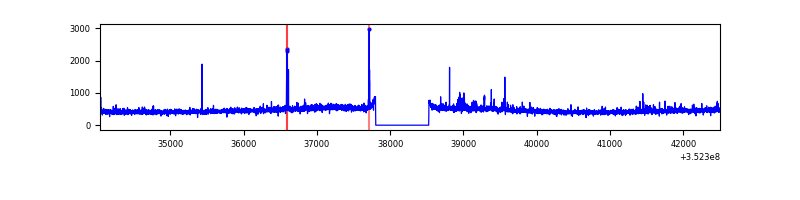 |
| B | 8459 | 7735 | 39 | 39 | 0.46% | 0.50% | 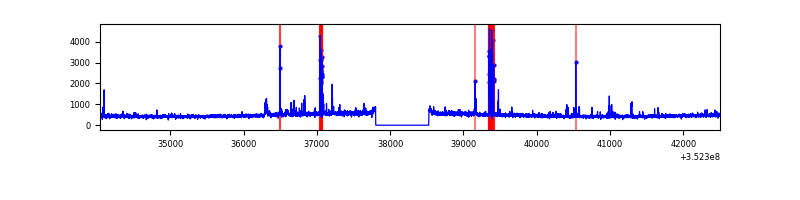 |
| C | 8459 | 7735 | 0 | 0 | 0.00% | 0.00% | 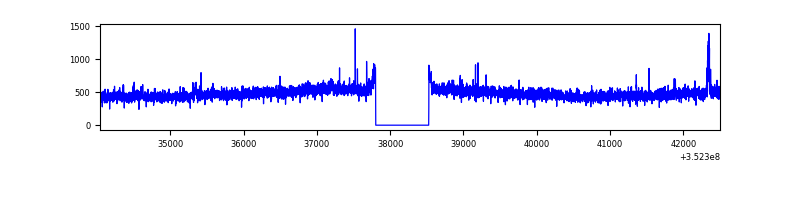 |
| D | 8459 | 7734 | 4668 | 4668 | 55.18% | 60.36% | 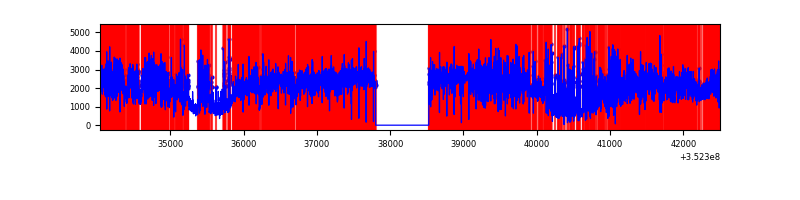 |
Top three noisy pixels from each quadrant. If the there are fewer than three noisy pixels in the level2.evt file, extra rows are filled as -1
| Pixel properties | Quadrant properties | ||||||
|---|---|---|---|---|---|---|---|
| Quadrant | DetID | PixID | Counts | Sigma | Mean | Median | Sigma |
| A | 1 | 113 | 28715 | 152.12 | 909 | 891 | 182.9 |
| A | 15 | 174 | 22879 | 120.21 | 909 | 891 | 182.9 |
| A | 13 | 254 | 15887 | 81.99 | 909 | 891 | 182.9 |
| B | 4 | 171 | 87093 | 495.91 | 901 | 877 | 173.9 |
| B | 5 | 172 | 80752 | 459.43 | 901 | 877 | 173.9 |
| B | 10 | 245 | 74813 | 425.27 | 901 | 877 | 173.9 |
| C | 14 | 238 | 142473 | 673.86 | 883 | 888 | 210.1 |
| C | 3 | 233 | 94342 | 444.78 | 883 | 888 | 210.1 |
| C | 4 | 175 | 21479 | 98.0 | 883 | 888 | 210.1 |
| D | 12 | 33 | 10330151 | 68608.27 | 625 | 608 | 150.6 |
| D | 7 | 80 | 1986037 | 13187.11 | 625 | 608 | 150.6 |
| D | 1 | 52 | 1070640 | 7107.09 | 625 | 608 | 150.6 |
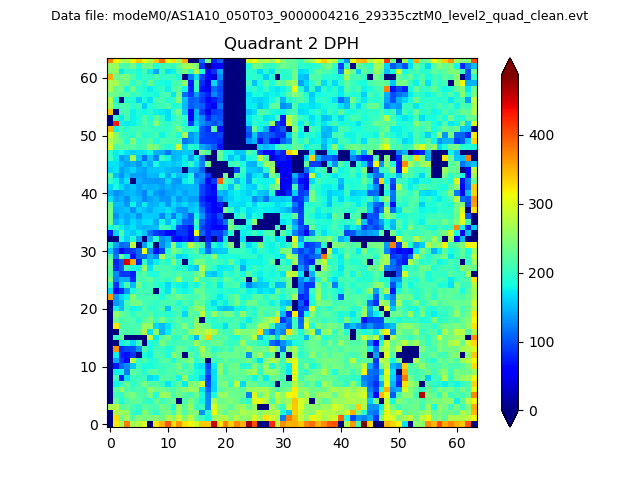
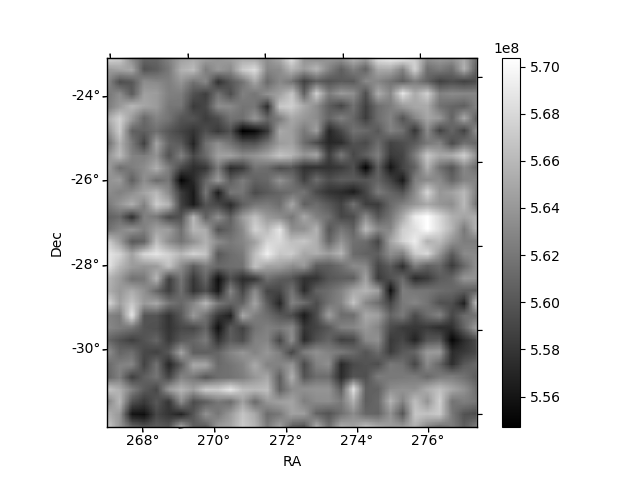
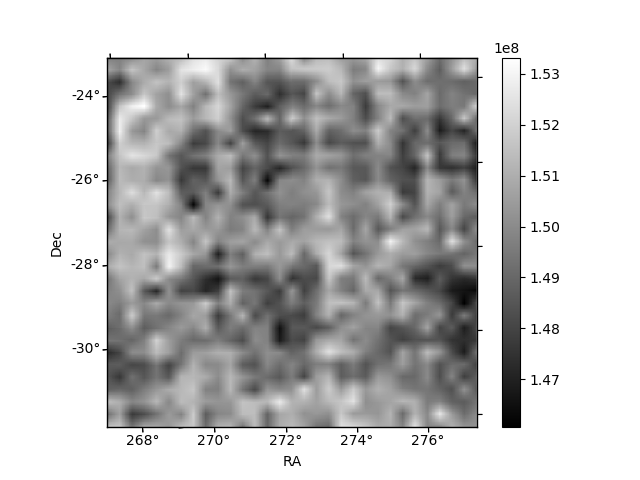
Histogram calculated using DETX and DETY for each event in the final _common_clean file
| Quadrant A | 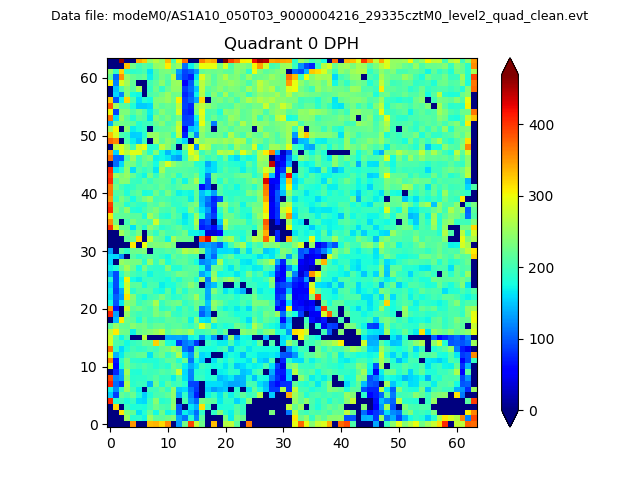 |
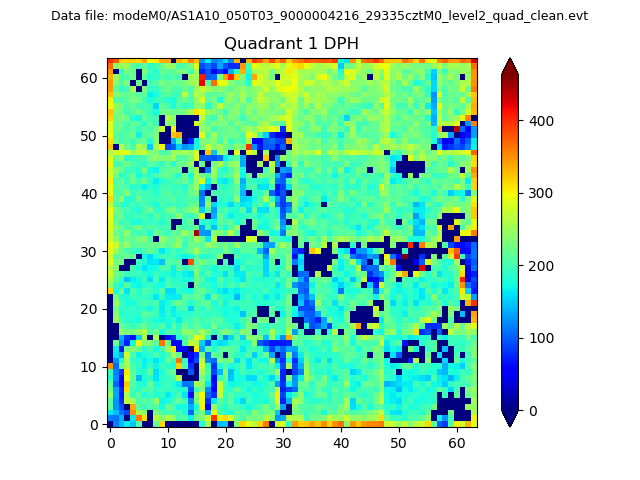 |
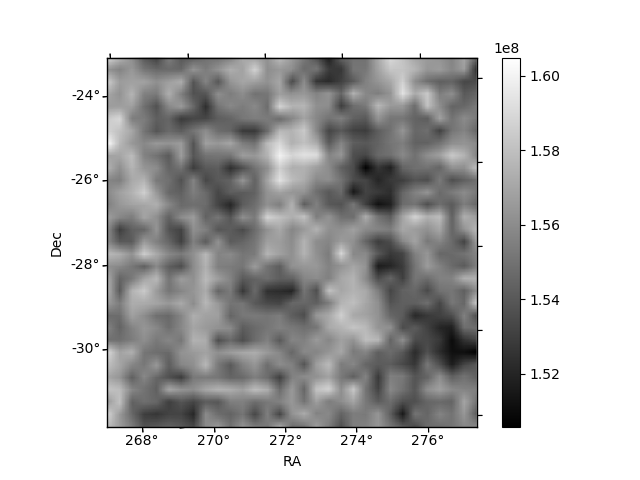
Quadrant B |
|---|---|---|---|
| Quadrant D | 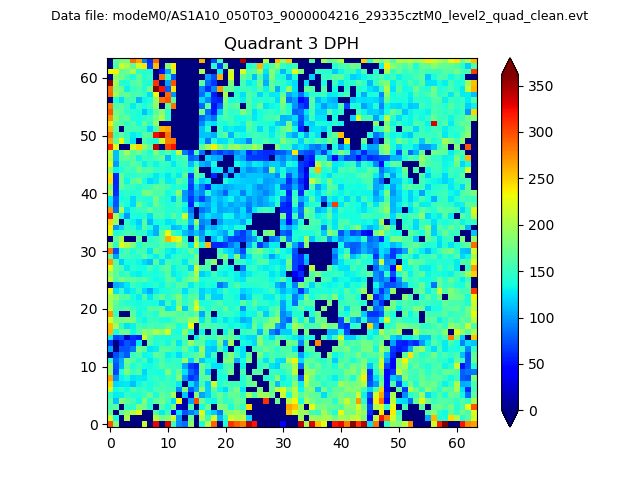 |
 |
Quadrant C |
| Plot type | Count rate plots | Images |
|---|---|---|
| Comparison with Poisson distribution Blue bars denote a histogram of data divided into 1 sec bins. Red curve is a Poisson curve with rate = median count rate of data. |
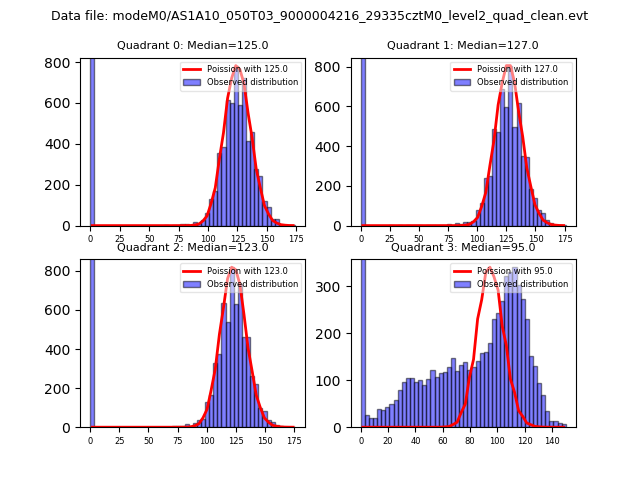 |
 |
| Quadrant-wise count rates Data is divided into 100 sec bins |
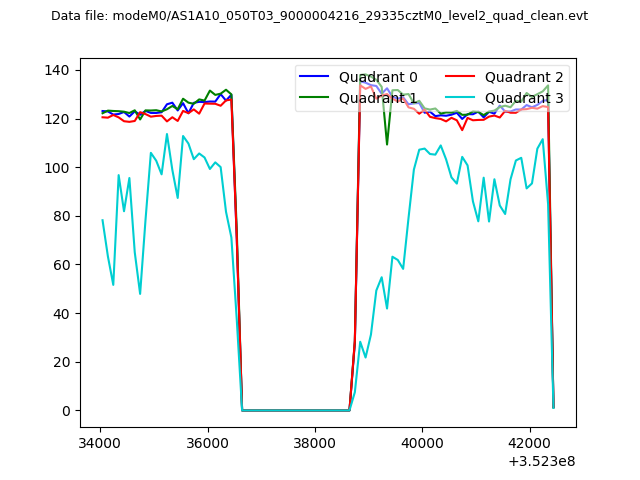 |
|
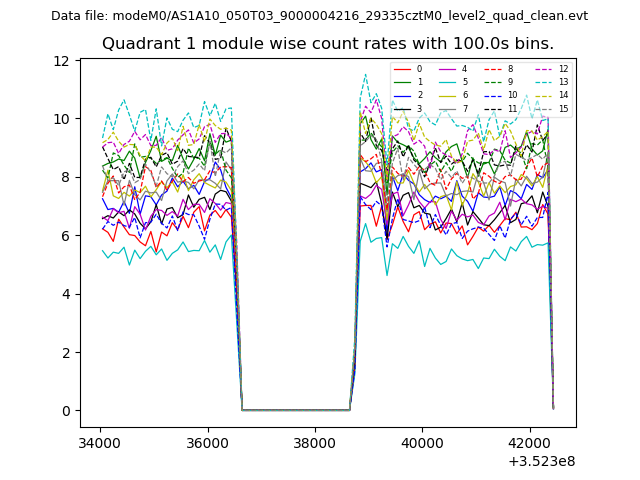
| Module-wise count rates for Quadrant A Data is divided into 100 sec bins |
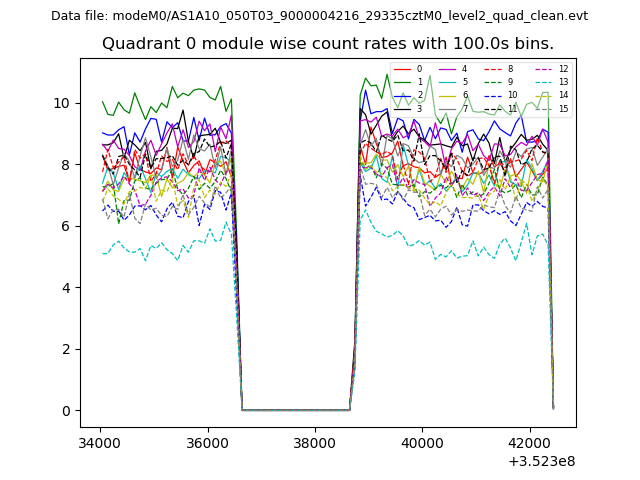 |
 |
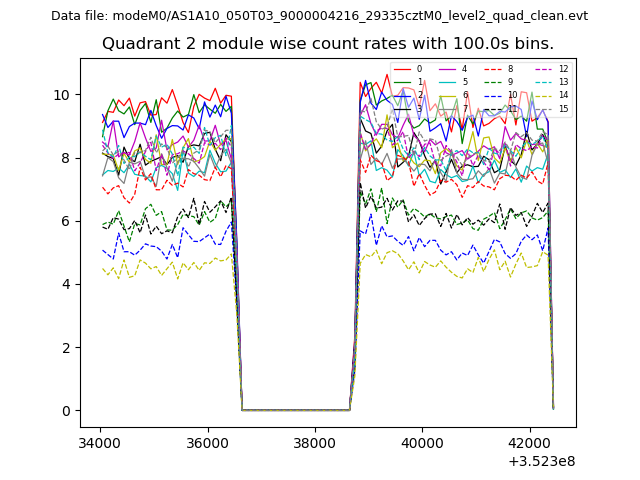
| Module-wise count rates for Quadrant B Data is divided into 100 sec bins |
 |
 |
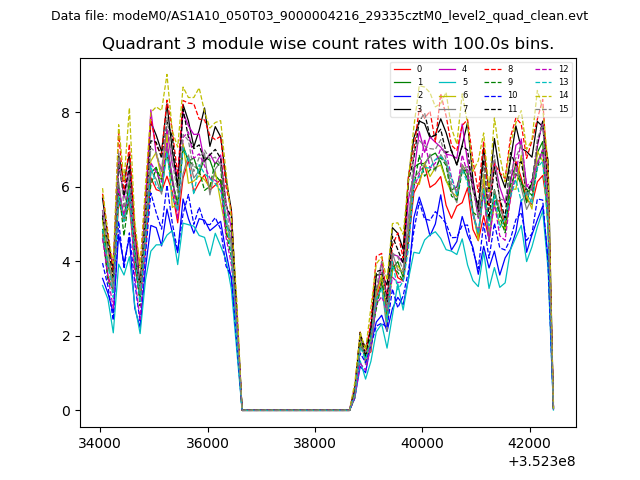
| Module-wise count rates for Quadrant C Data is divided into 100 sec bins |
 |
 |
| Module-wise count rates for Quadrant D Data is divided into 100 sec bins |
 |
 |
| Parameter | Plot |
|---|---|
| CZT HV Monitor | 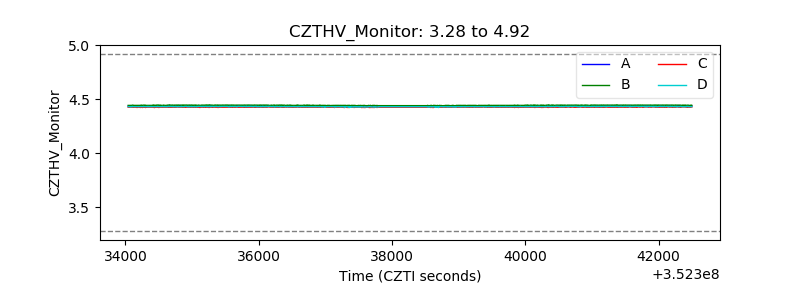 |
| D_VDD | 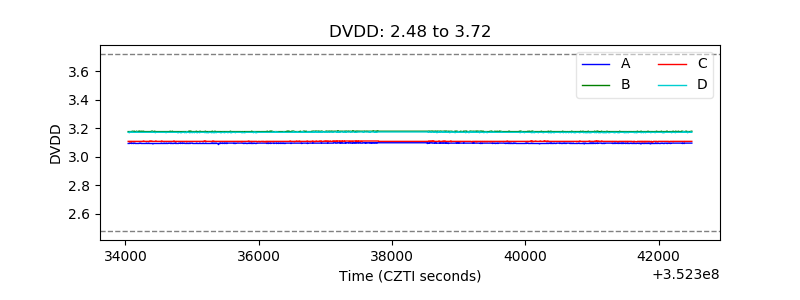 |
| Temperature 1 | 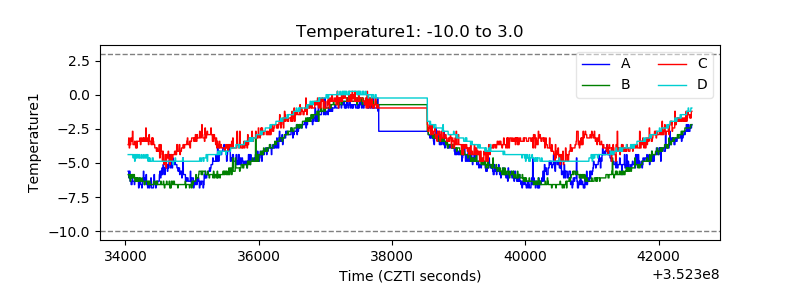 |
| Veto HV Monitor | 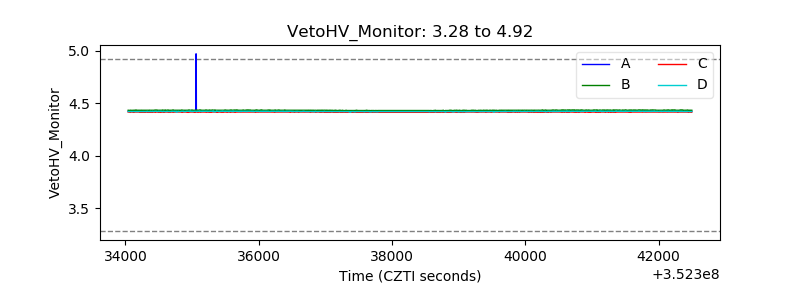 |
| Veto LLD | 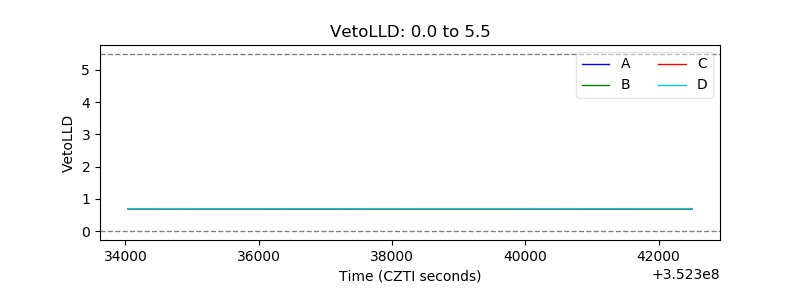 |
| Alpha Counter | 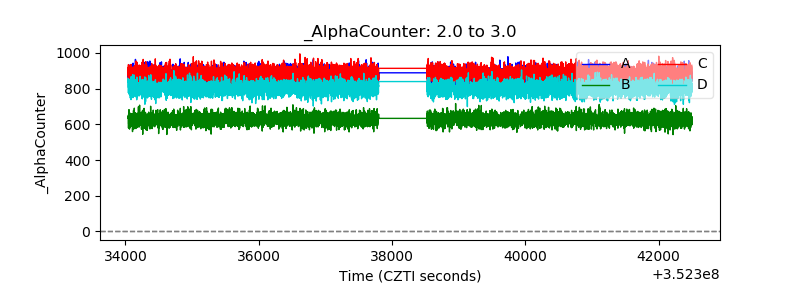 |
| _CPM_Rate | 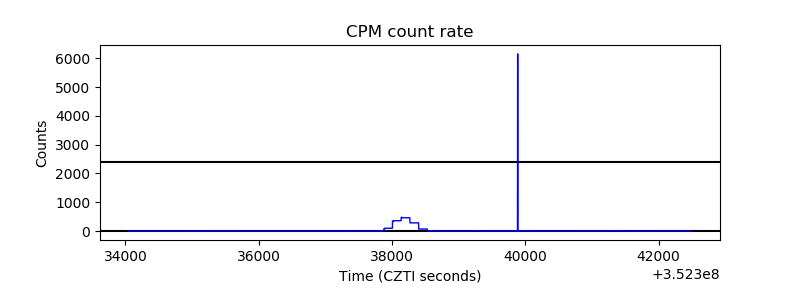 |
| CZT Counter | 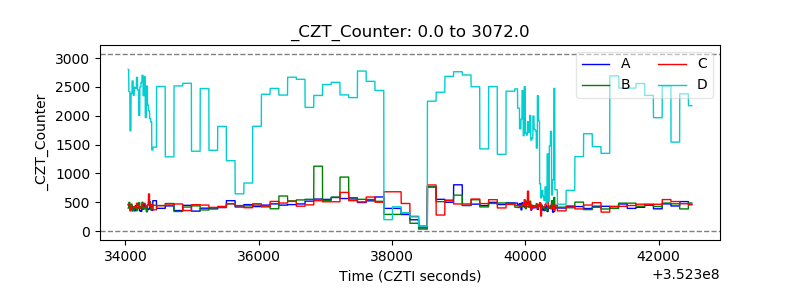 |
| +2.5 Volts monitor |  |
| +5 Volts monitor | 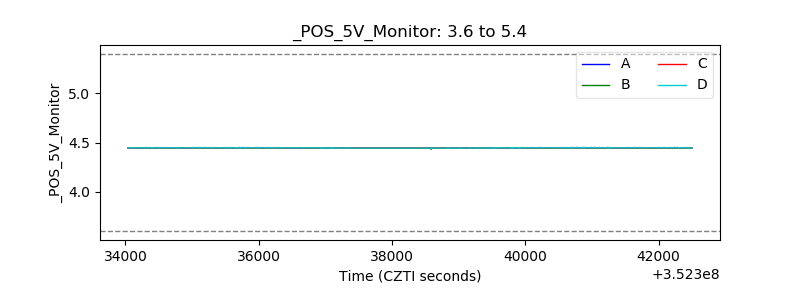 |
| _ROLL_ROT | 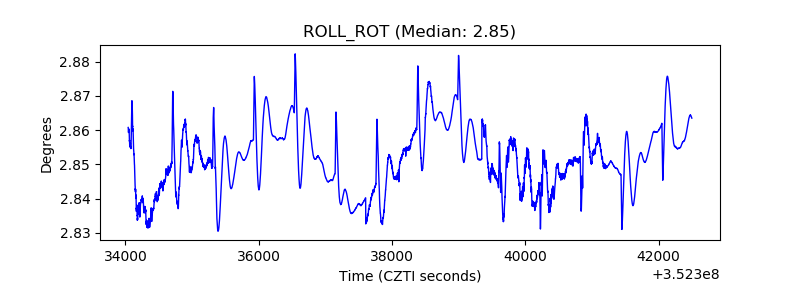 |
| _Roll_DEC | 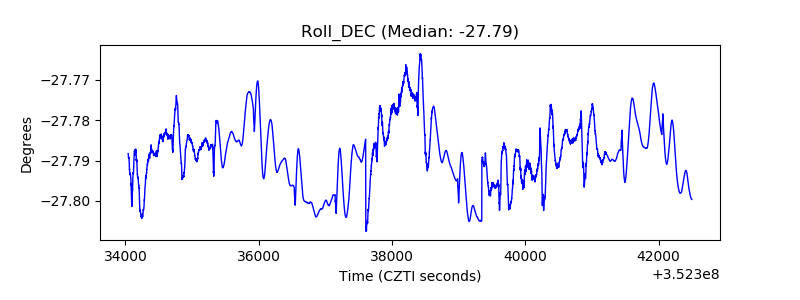 |
| _Roll_RA | 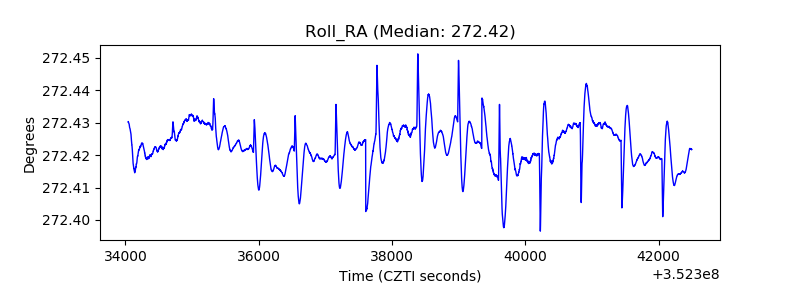 |
| Veto Counter | 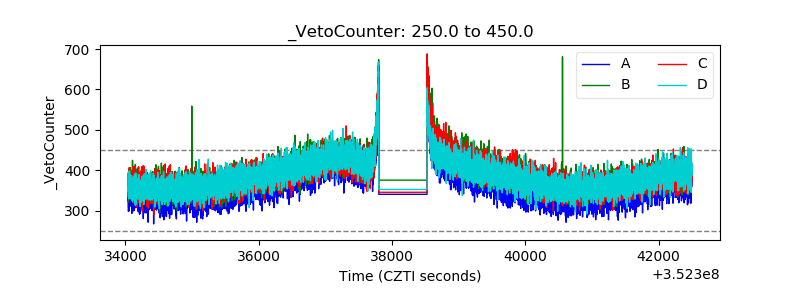 |