| Param | Original file | Final file |
|---|---|---|
| Filename | modeM0/AS1A10_083T01_9000004214_29311cztM0_level2.evt | modeM0/AS1A10_083T01_9000004214_29311cztM0_level2_quad_clean.evt |
| Size (bytes) | 236,779,200 | 43,012,800 |
| Size | 225.8 MB | 41.0 MB |
| Events in quadrant A | 1,038,702 | 315,325 |
| Events in quadrant B | 1,425,384 | 312,590 |
| Events in quadrant C | 2,704,903 | 272,710 |
| Events in quadrant D | 1,881,417 | 272,855 |
| Mode SS | |||
|---|---|---|---|
| Quadrant | BADHDUFLAG | Total packets | Discarded packets |
| A | 0 | 34 | 0 |
| B | 0 | 34 | 0 |
| C | 0 | 34 | 0 |
| D | 0 | 34 | 0 |
| Mode M9 | |||
|---|---|---|---|
| Quadrant | BADHDUFLAG | Total packets | Discarded packets |
| A | 0 | 11 | 0 |
| B | 0 | 11 | 0 |
| C | 0 | 11 | 0 |
| D | 0 | 11 | 0 |
| Mode M0 | |||
|---|---|---|---|
| Quadrant | BADHDUFLAG | Total packets | Discarded packets |
| A | 0 | 4314 | 1 |
| B | 0 | 5527 | 1 |
| C | 0 | 9261 | 1 |
| D | 0 | 6891 | 1 |
| Quadrant | Total seconds | Saturated seconds | Saturation percentage |
|---|---|---|---|
| A | 1759 | 7 | 0.397953% |
| B | 1759 | 47 | 2.671973% |
| C | 1759 | 430 | 24.445708% |
| D | 1759 | 243 | 13.814667% |
Noise dominated data is calculated using 1-second bins in cleaned event files. If a bin has >2000 counts, and if more than 50% of those come from <1% of pixels, then it is considered to be noise-dominated and hence unusable.
| Quadrant | # 1 sec bins | Bins with >0 counts | Bins with >2000 counts | High rate bins dominated by noise | Noise dominated (total time) | Noise dominated (detector-on time) | Marked lightcurve |
|---|---|---|---|---|---|---|---|
| A | 1759 | 1759 | 0 | 0 | 0.00% | 0.00% | 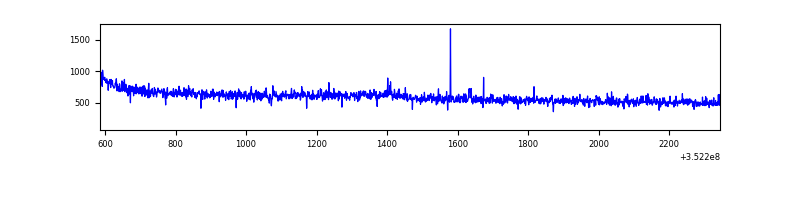 |
| B | 1759 | 1759 | 15 | 15 | 0.85% | 0.85% | 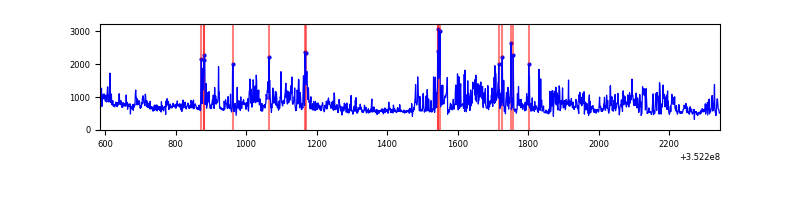 |
| C | 1759 | 1759 | 197 | 197 | 11.20% | 11.20% | 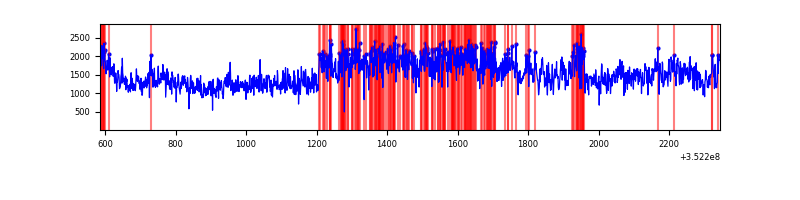 |
| D | 1759 | 1759 | 127 | 127 | 7.22% | 7.22% | 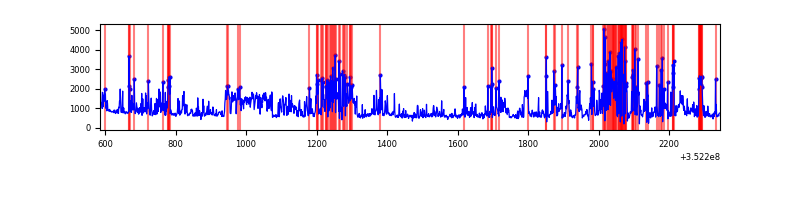 |
Top three noisy pixels from each quadrant. If the there are fewer than three noisy pixels in the level2.evt file, extra rows are filled as -1
| Pixel properties | Quadrant properties | ||||||
|---|---|---|---|---|---|---|---|
| Quadrant | DetID | PixID | Counts | Sigma | Mean | Median | Sigma |
| A | 15 | 174 | 18329 | 343.89 | 264 | 260 | 52.5 |
| A | 13 | 254 | 3269 | 57.27 | 264 | 260 | 52.5 |
| A | 0 | 226 | 2221 | 37.32 | 264 | 260 | 52.5 |
| B | 5 | 255 | 383427 | 7923.49 | 253 | 247 | 48.4 |
| B | 0 | 190 | 36273 | 744.95 | 253 | 247 | 48.4 |
| B | 10 | 245 | 17546 | 357.71 | 253 | 247 | 48.4 |
| C | 3 | 233 | 1724813 | 31040.91 | 239 | 241 | 55.6 |
| C | 14 | 238 | 39411 | 705.03 | 239 | 241 | 55.6 |
| C | 2 | 114 | 3960 | 66.94 | 239 | 241 | 55.6 |
| D | 1 | 52 | 773666 | 13388.08 | 243 | 238 | 57.8 |
| D | 8 | 195 | 102943 | 1777.83 | 243 | 238 | 57.8 |
| D | 7 | 80 | 26684 | 457.78 | 243 | 238 | 57.8 |
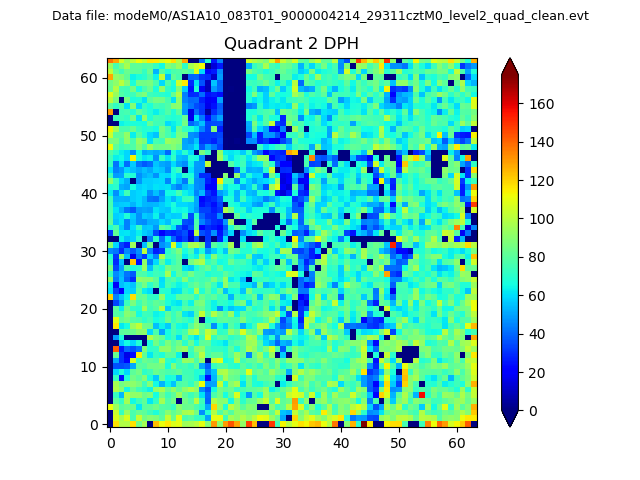
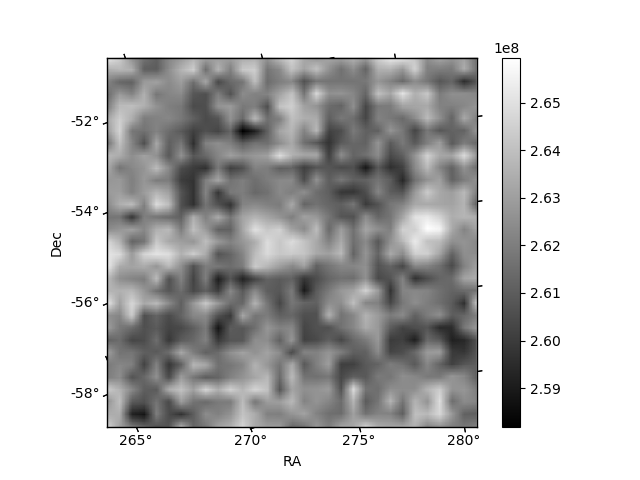
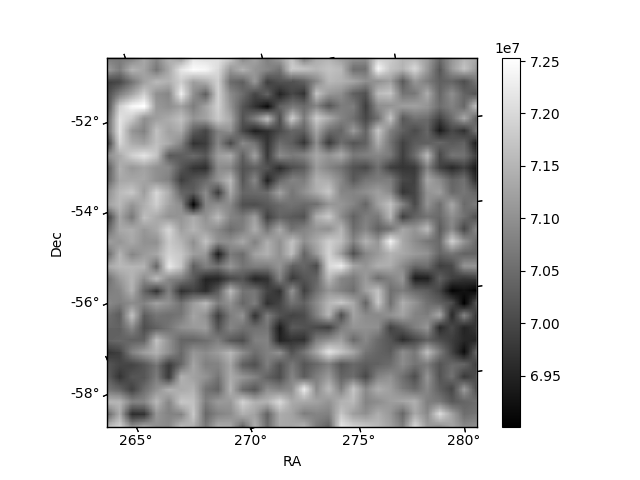
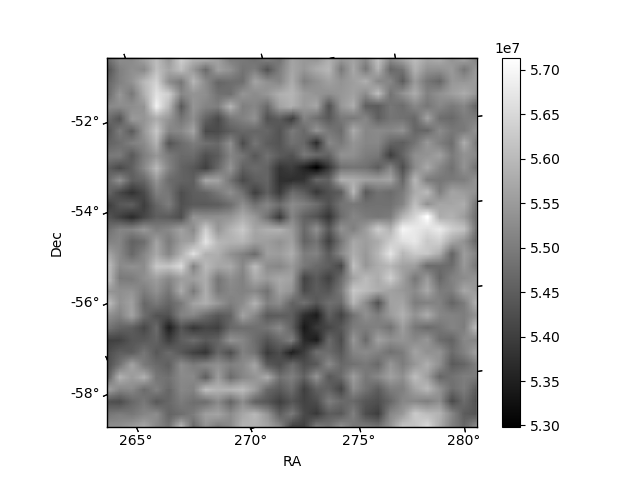
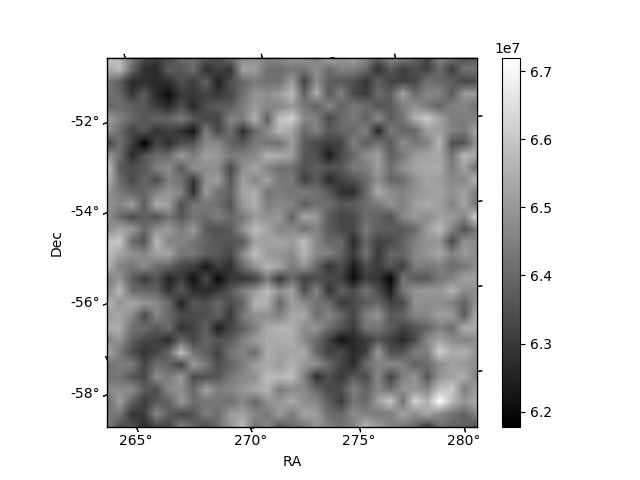
Histogram calculated using DETX and DETY for each event in the final _common_clean file
| Quadrant A | 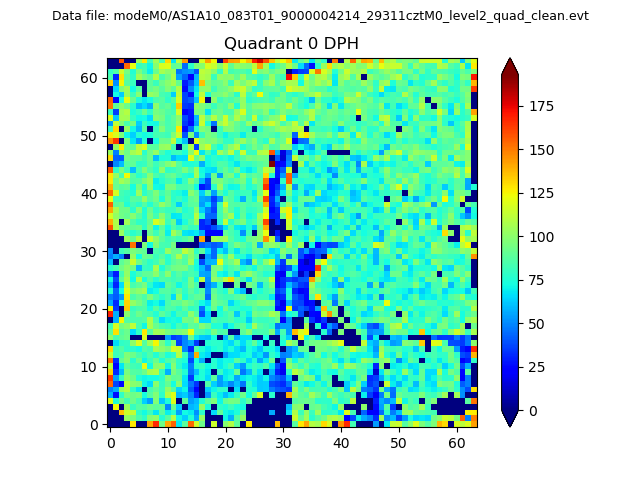 |
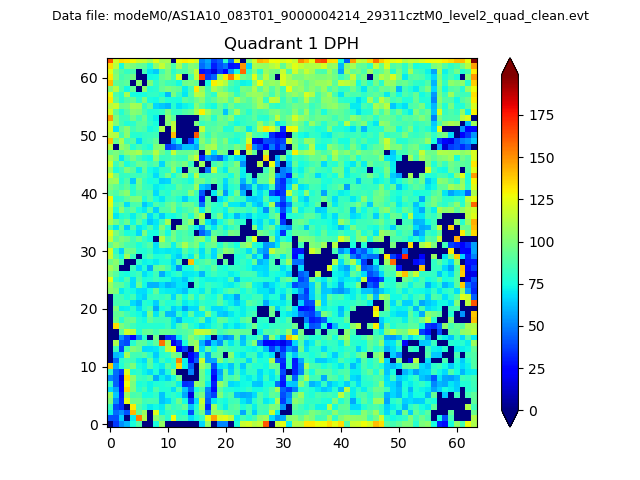 |
Quadrant B |
|---|---|---|---|
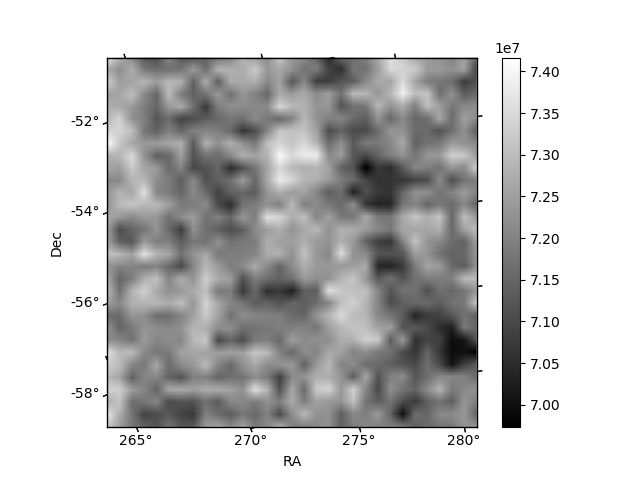
| Quadrant D | 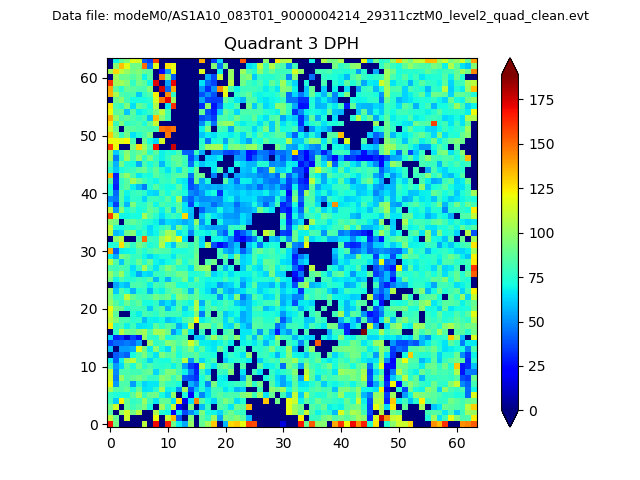 |
 |
Quadrant C |
| Plot type | Count rate plots | Images |
|---|---|---|
| Comparison with Poisson distribution Blue bars denote a histogram of data divided into 1 sec bins. Red curve is a Poisson curve with rate = median count rate of data. |
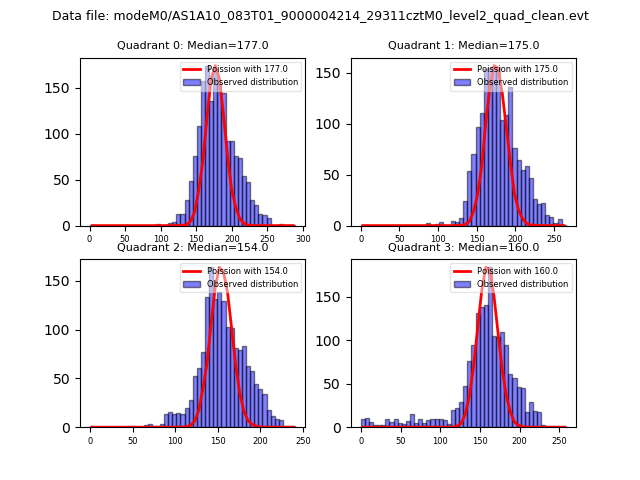 |
 |
| Quadrant-wise count rates Data is divided into 100 sec bins |
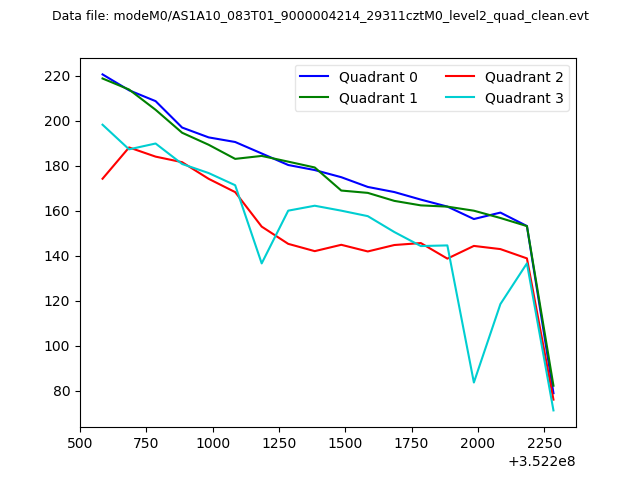 |
|
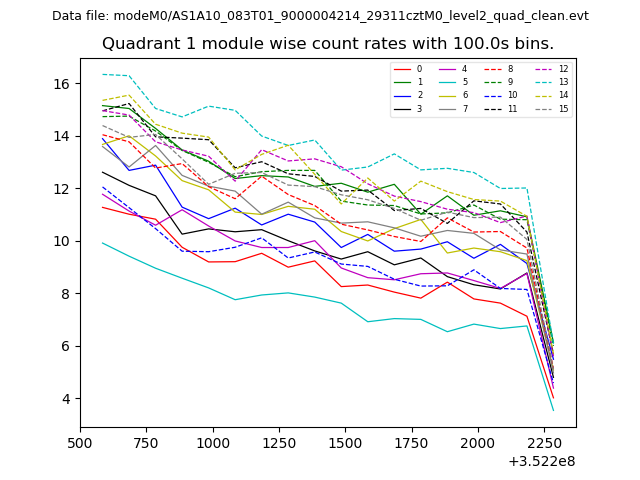
| Module-wise count rates for Quadrant A Data is divided into 100 sec bins |
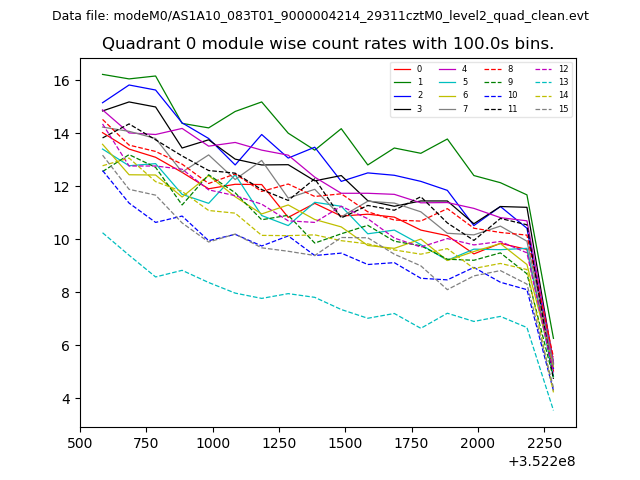 |
 |
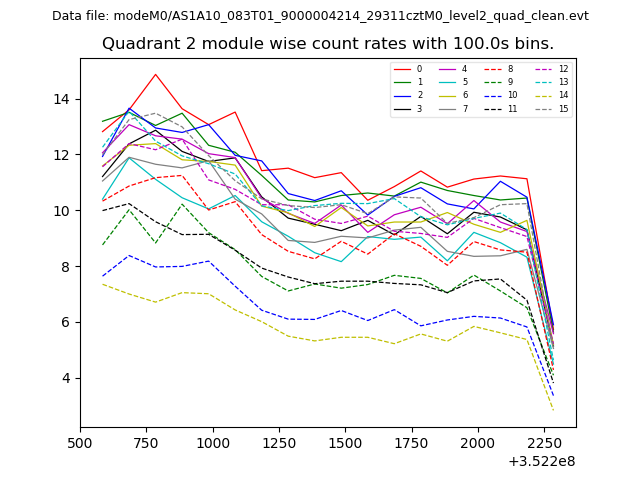
| Module-wise count rates for Quadrant B Data is divided into 100 sec bins |
 |
 |
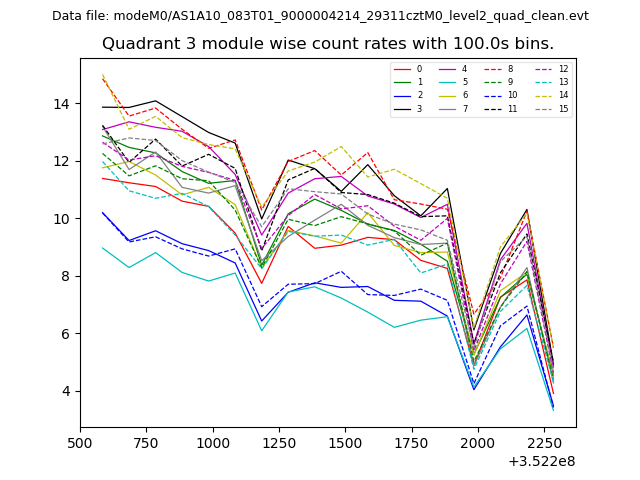
| Module-wise count rates for Quadrant C Data is divided into 100 sec bins |
 |
 |
| Module-wise count rates for Quadrant D Data is divided into 100 sec bins |
 |
 |
| Parameter | Plot |
|---|---|
| CZT HV Monitor | 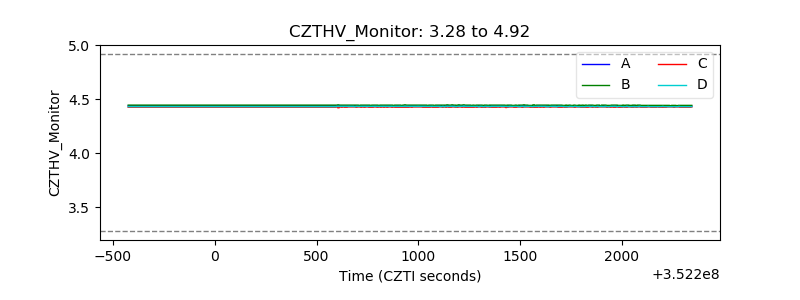 |
| D_VDD |  |
| Temperature 1 | 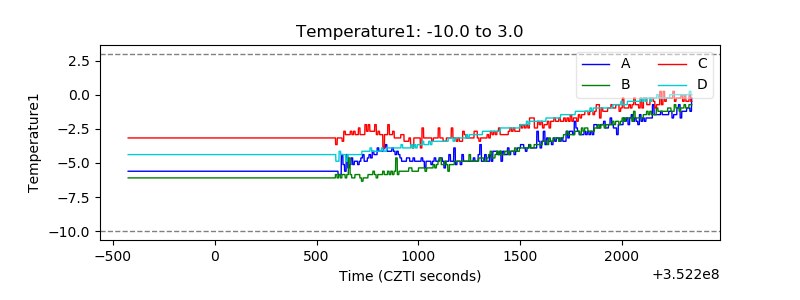 |
| Veto HV Monitor | 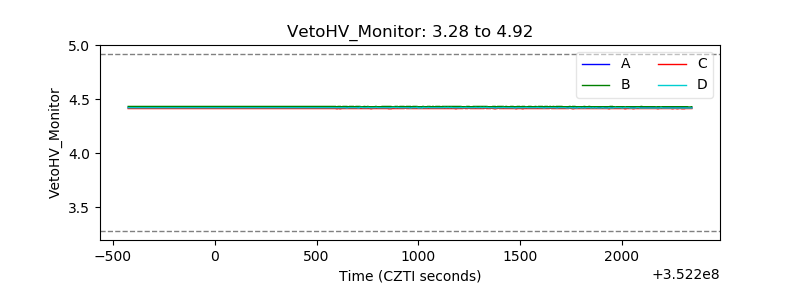 |
| Veto LLD | 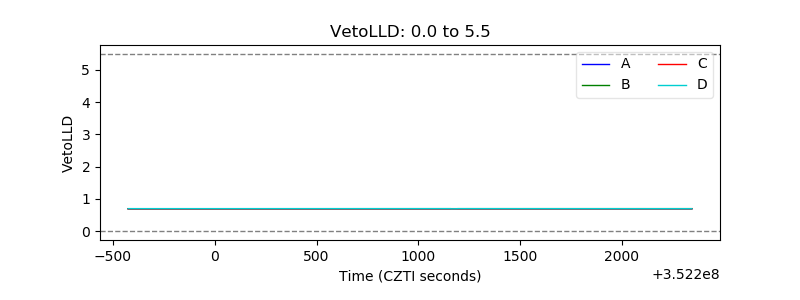 |
| Alpha Counter | 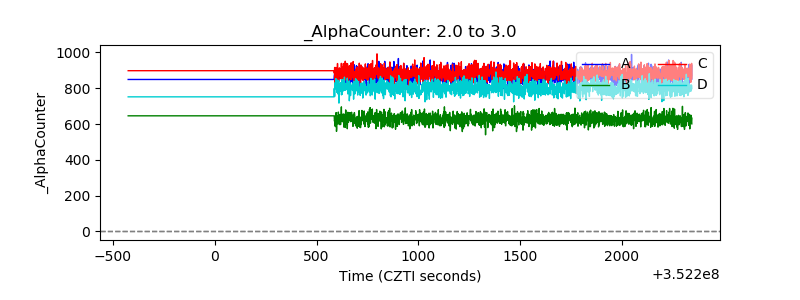 |
| _CPM_Rate | 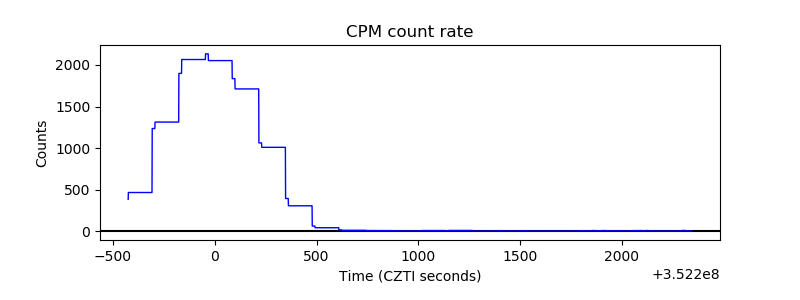 |
| CZT Counter | 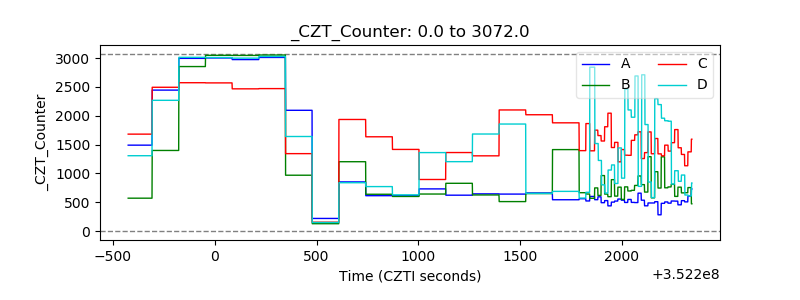 |
| +2.5 Volts monitor | 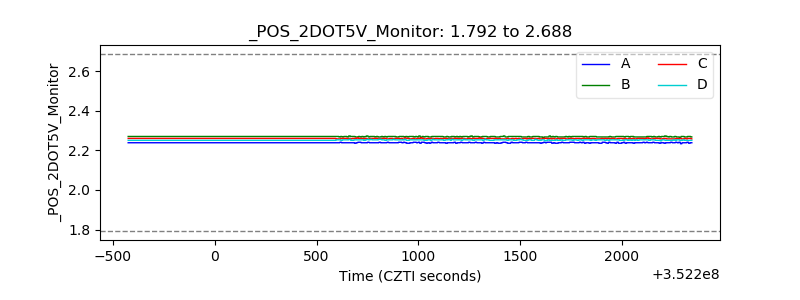 |
| +5 Volts monitor | 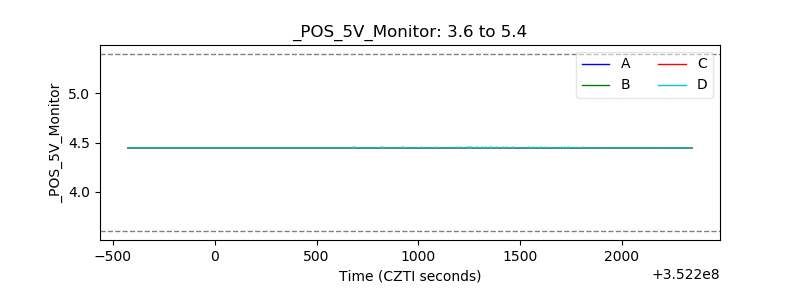 |
| _ROLL_ROT | 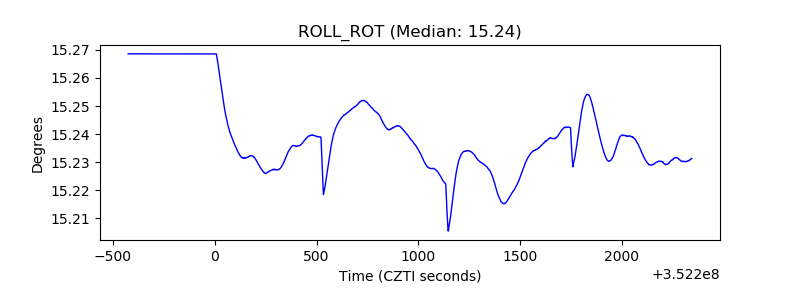 |
| _Roll_DEC | 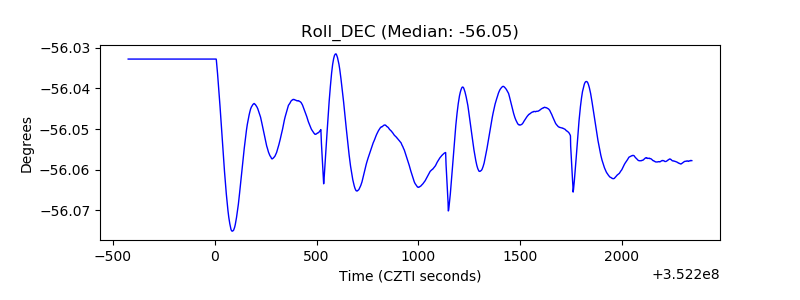 |
| _Roll_RA | 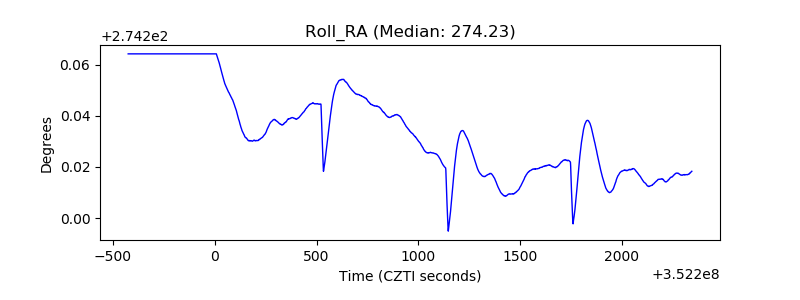 |
| Veto Counter | 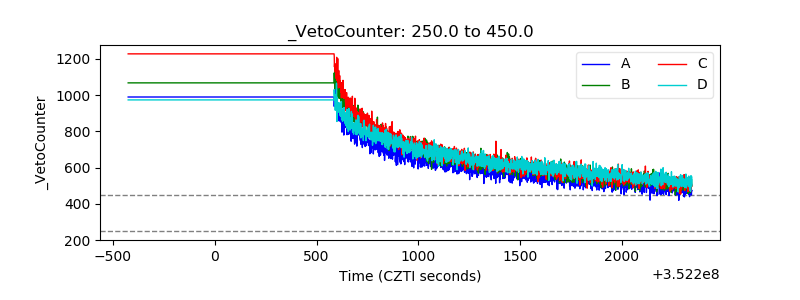 |