| Param | Original file | Final file |
|---|---|---|
| Filename | modeM0/AS1A10_083T01_9000004214_29312cztM0_level2.evt | modeM0/AS1A10_083T01_9000004214_29312cztM0_level2_quad_clean.evt |
| Size (bytes) | 853,692,480 | 79,179,840 |
| Size | 814.1 MB | 75.5 MB |
| Events in quadrant A | 3,693,368 | 547,757 |
| Events in quadrant B | 3,583,002 | 562,402 |
| Events in quadrant C | 11,207,527 | 415,313 |
| Events in quadrant D | 6,992,601 | 478,581 |
| Mode SS | |||
|---|---|---|---|
| Quadrant | BADHDUFLAG | Total packets | Discarded packets |
| A | 0 | 114 | 0 |
| B | 0 | 114 | 0 |
| C | 0 | 114 | 0 |
| D | 0 | 114 | 0 |
| Mode M9 | |||
|---|---|---|---|
| Quadrant | BADHDUFLAG | Total packets | Discarded packets |
| A | 0 | 13 | 0 |
| B | 0 | 13 | 0 |
| C | 0 | 13 | 0 |
| D | 0 | 13 | 0 |
| Mode M0 | |||
|---|---|---|---|
| Quadrant | BADHDUFLAG | Total packets | Discarded packets |
| A | 0 | 14338 | 1 |
| B | 0 | 14179 | 1 |
| C | 0 | 37121 | 6 |
| D | 0 | 24820 | 1 |
| Quadrant | Total seconds | Saturated seconds | Saturation percentage |
|---|---|---|---|
| A | 5609 | 191 | 3.405242% |
| B | 5609 | 84 | 1.497593% |
| C | 5609 | 3819 | 68.087003% |
| D | 5609 | 954 | 17.008379% |
Noise dominated data is calculated using 1-second bins in cleaned event files. If a bin has >2000 counts, and if more than 50% of those come from <1% of pixels, then it is considered to be noise-dominated and hence unusable.
| Quadrant | # 1 sec bins | Bins with >0 counts | Bins with >2000 counts | High rate bins dominated by noise | Noise dominated (total time) | Noise dominated (detector-on time) | Marked lightcurve |
|---|---|---|---|---|---|---|---|
| A | 6929 | 5611 | 101 | 101 | 1.46% | 1.80% | 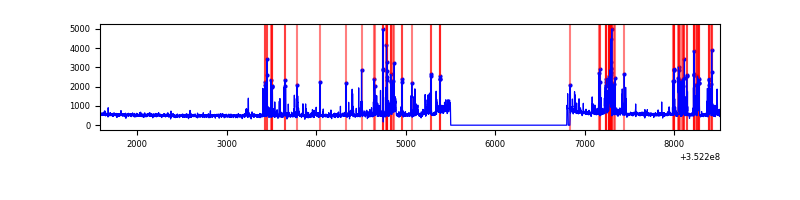 |
| B | 6929 | 5611 | 20 | 20 | 0.29% | 0.36% | 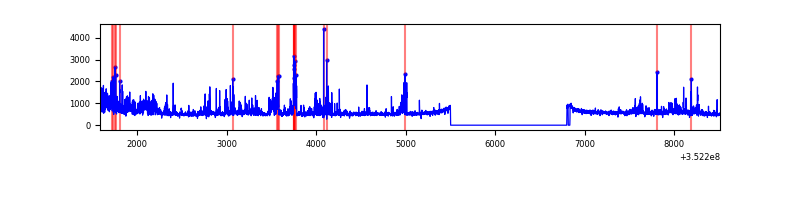 |
| C | 6929 | 5611 | 2915 | 2915 | 42.07% | 51.95% | 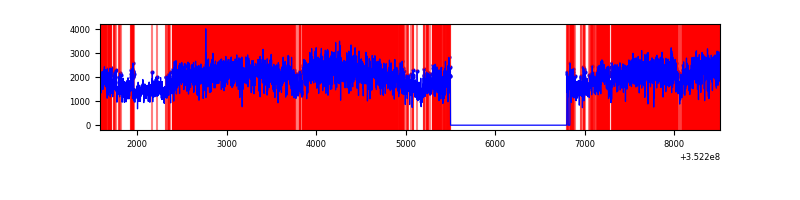 |
| D | 6929 | 5611 | 709 | 709 | 10.23% | 12.64% | 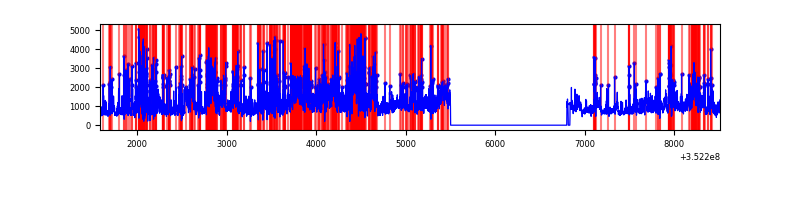 |
Top three noisy pixels from each quadrant. If the there are fewer than three noisy pixels in the level2.evt file, extra rows are filled as -1
| Pixel properties | Quadrant properties | ||||||
|---|---|---|---|---|---|---|---|
| Quadrant | DetID | PixID | Counts | Sigma | Mean | Median | Sigma |
| A | 0 | 13 | 727226 | 4857.65 | 755 | 742 | 149.6 |
| A | 15 | 174 | 17950 | 115.06 | 755 | 742 | 149.6 |
| A | 14 | 235 | 17869 | 114.52 | 755 | 742 | 149.6 |
| B | 0 | 190 | 301959 | 2194.91 | 744 | 729 | 137.2 |
| B | 5 | 255 | 268328 | 1949.86 | 744 | 729 | 137.2 |
| B | 15 | 35 | 44379 | 318.06 | 744 | 729 | 137.2 |
| C | 3 | 233 | 8774226 | 64609.16 | 595 | 600 | 135.8 |
| C | 14 | 238 | 94138 | 688.82 | 595 | 600 | 135.8 |
| C | 2 | 114 | 11734 | 81.99 | 595 | 600 | 135.8 |
| D | 1 | 52 | 1814538 | 11273.5 | 693 | 675 | 160.9 |
| D | 7 | 80 | 895044 | 5558.67 | 693 | 675 | 160.9 |
| D | 8 | 195 | 863139 | 5360.38 | 693 | 675 | 160.9 |
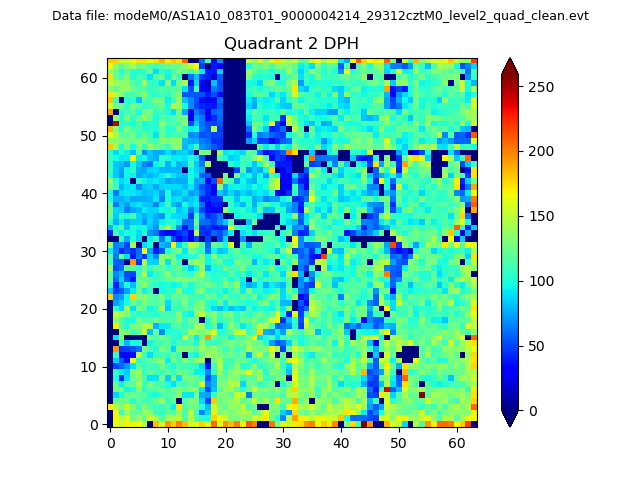
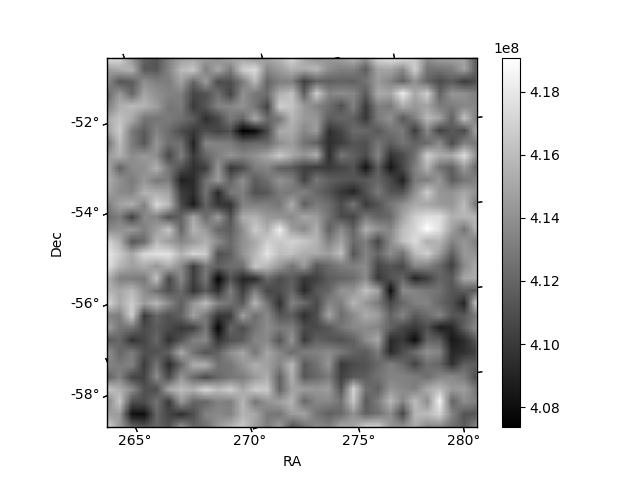
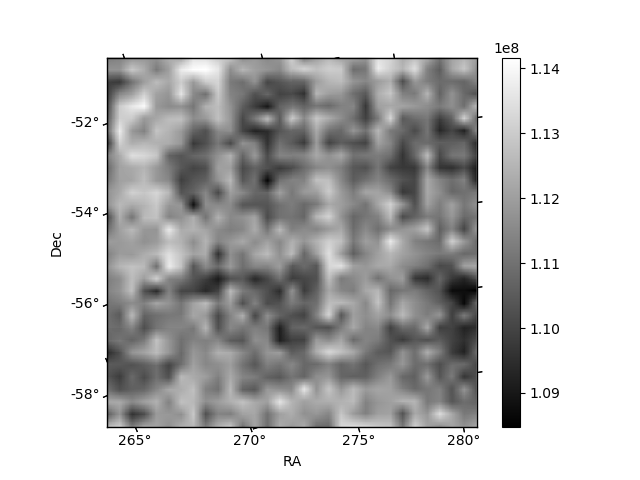
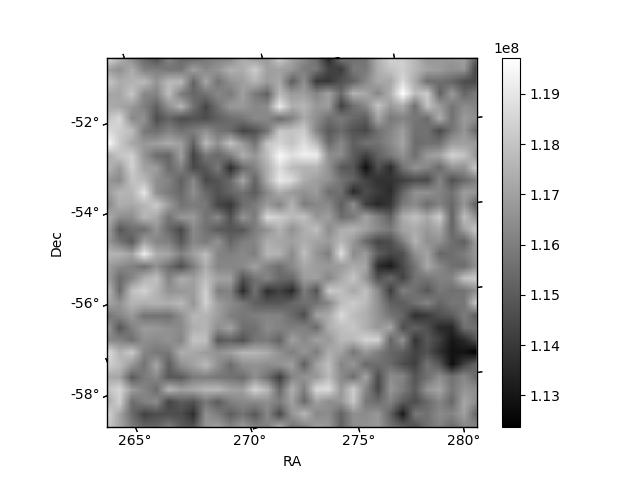
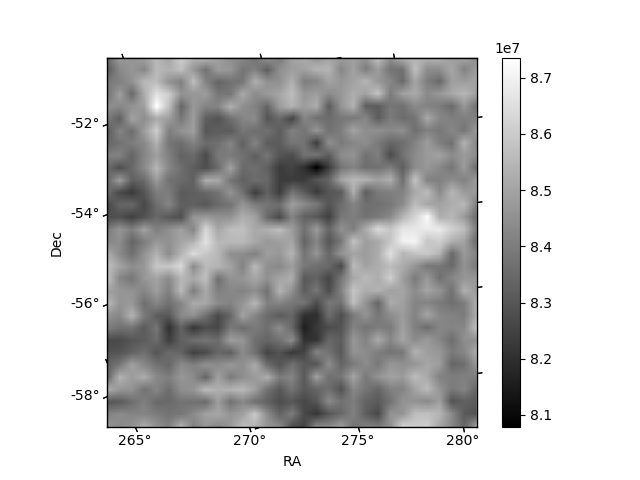
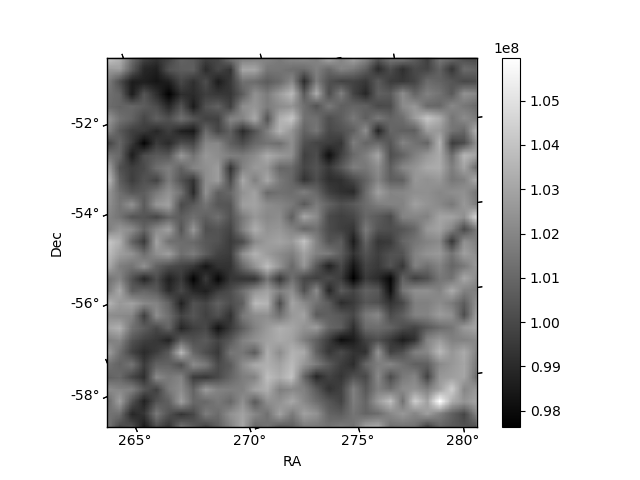
Histogram calculated using DETX and DETY for each event in the final _common_clean file
| Quadrant A | 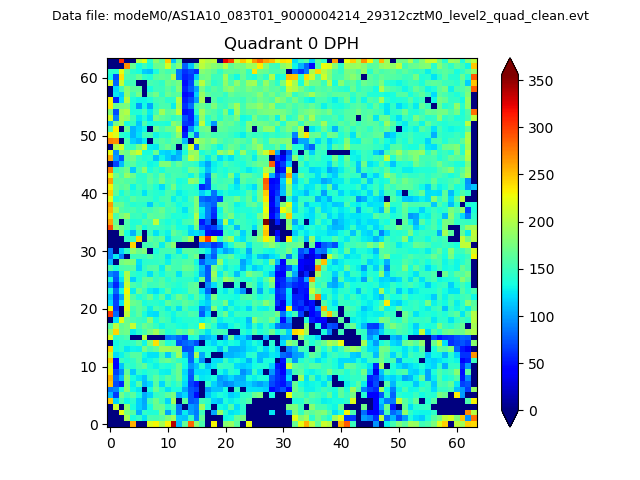 |
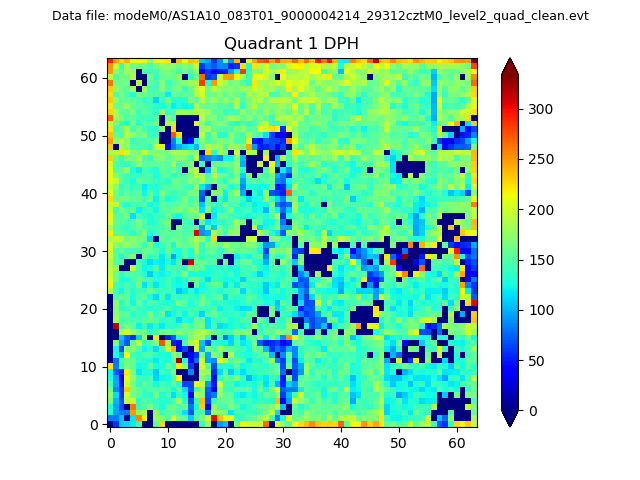 |
Quadrant B |
|---|---|---|---|
| Quadrant D | 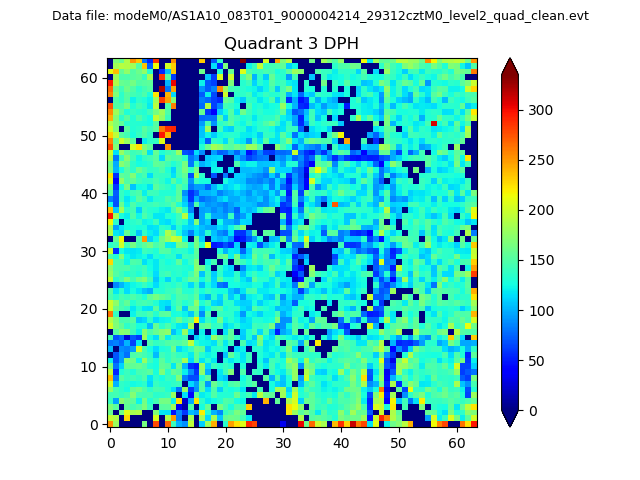 |
 |
Quadrant C |
| Plot type | Count rate plots | Images |
|---|---|---|
| Comparison with Poisson distribution Blue bars denote a histogram of data divided into 1 sec bins. Red curve is a Poisson curve with rate = median count rate of data. |
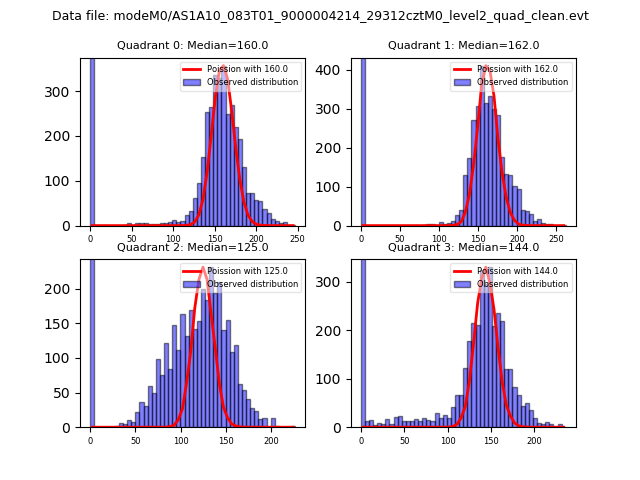 |
 |
| Quadrant-wise count rates Data is divided into 100 sec bins |
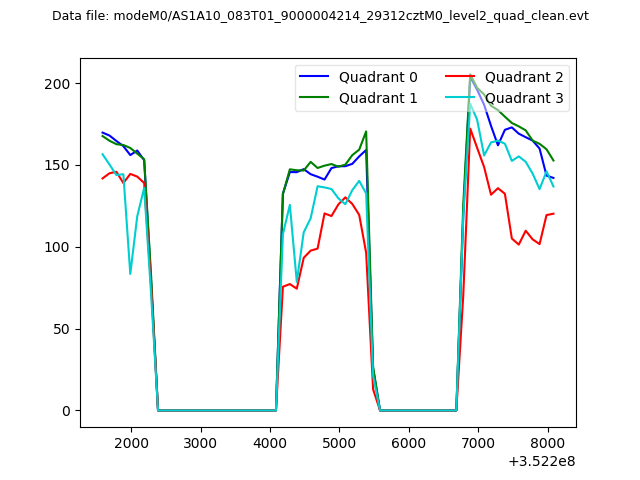 |
|
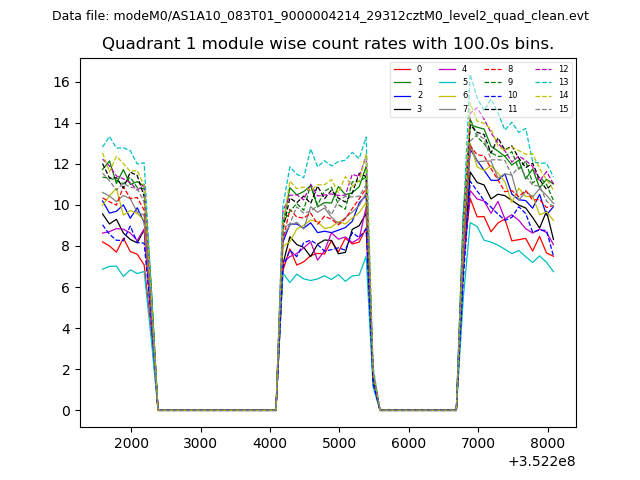
| Module-wise count rates for Quadrant A Data is divided into 100 sec bins |
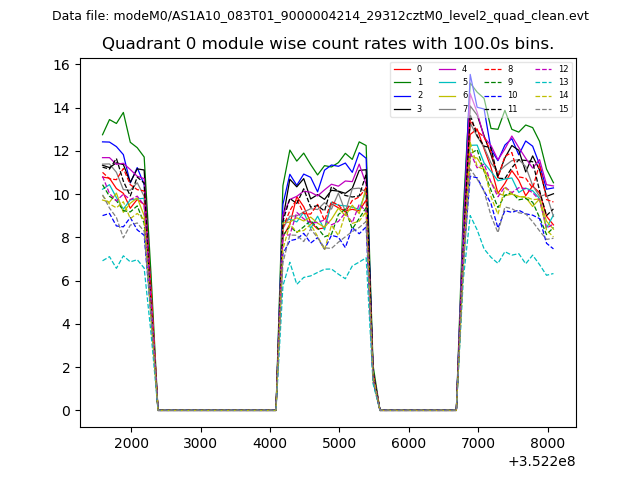 |
 |
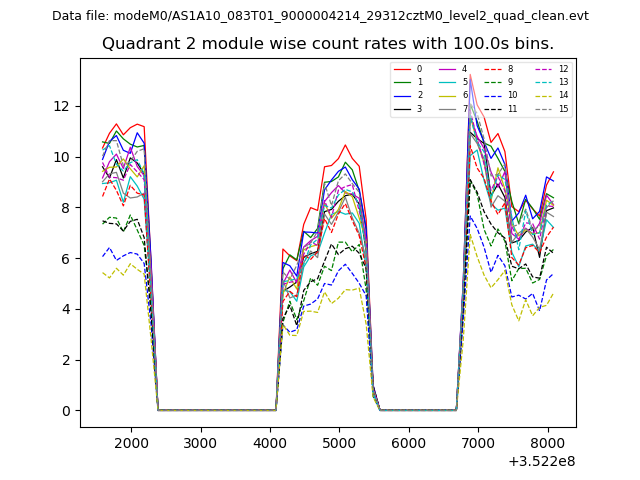
| Module-wise count rates for Quadrant B Data is divided into 100 sec bins |
 |
 |
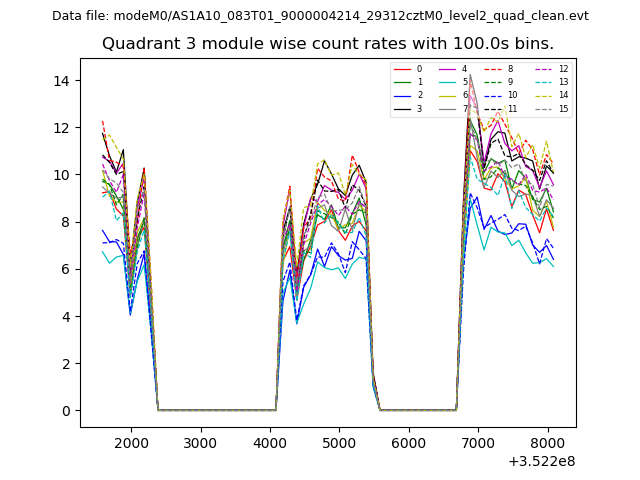
| Module-wise count rates for Quadrant C Data is divided into 100 sec bins |
 |
 |
| Module-wise count rates for Quadrant D Data is divided into 100 sec bins |
 |
 |
| Parameter | Plot |
|---|---|
| CZT HV Monitor | 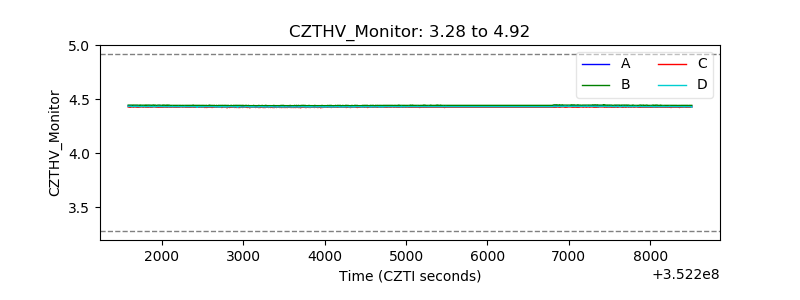 |
| D_VDD | 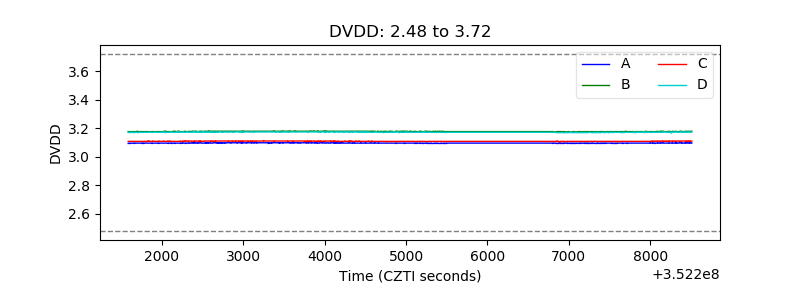 |
| Temperature 1 | 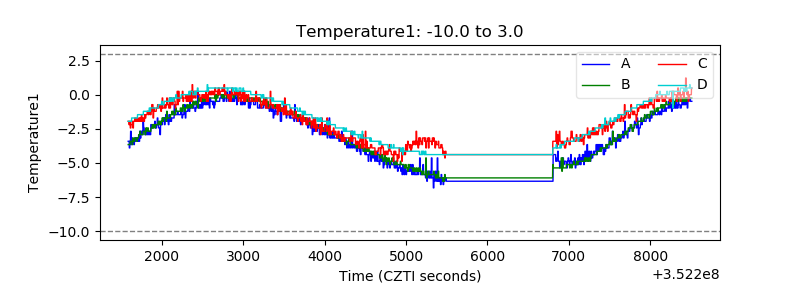 |
| Veto HV Monitor |  |
| Veto LLD | 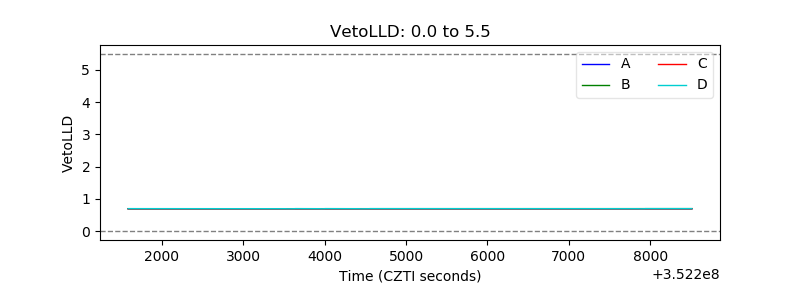 |
| Alpha Counter | 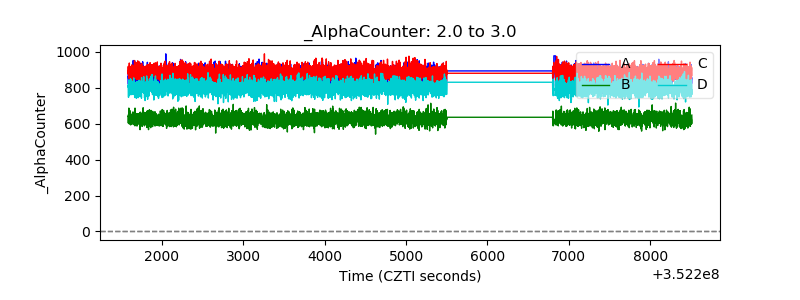 |
| _CPM_Rate | 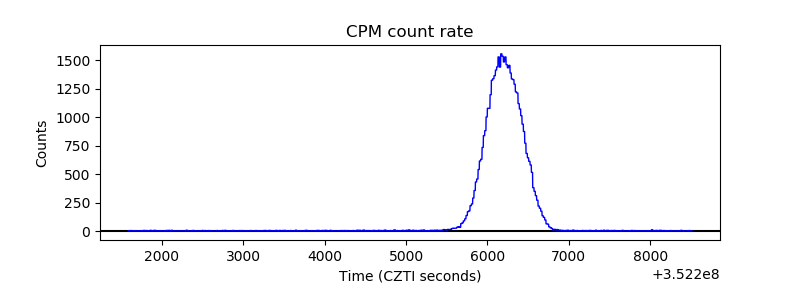 |
| CZT Counter | 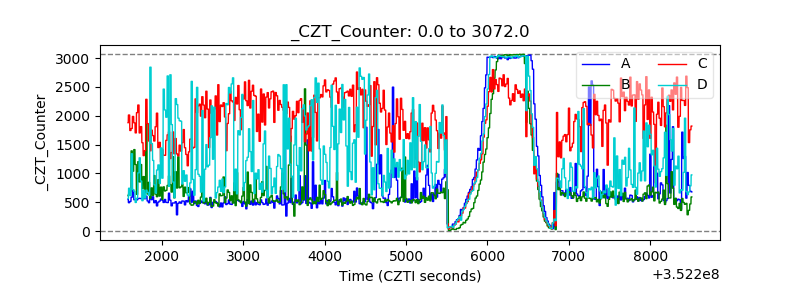 |
| +2.5 Volts monitor |  |
| +5 Volts monitor | 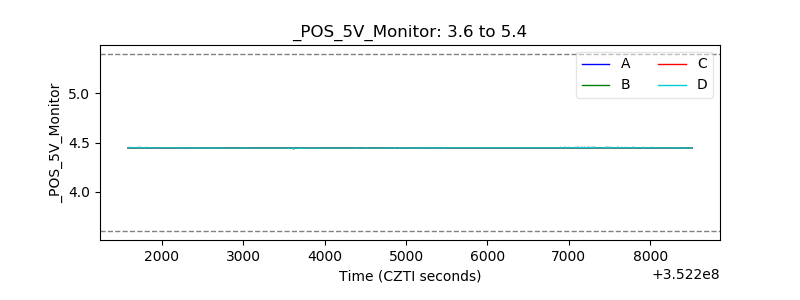 |
| _ROLL_ROT | 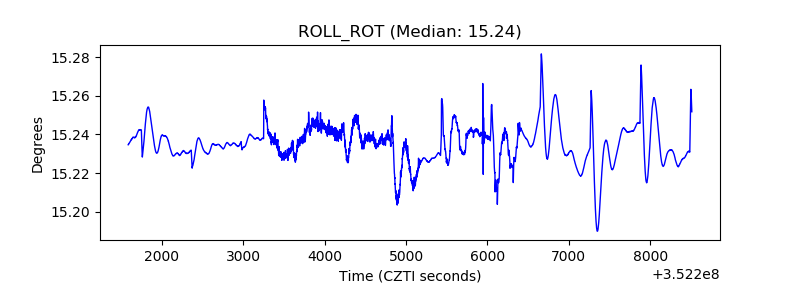 |
| _Roll_DEC | 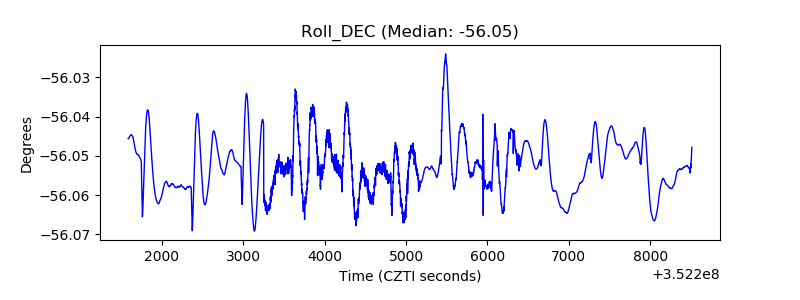 |
| _Roll_RA | 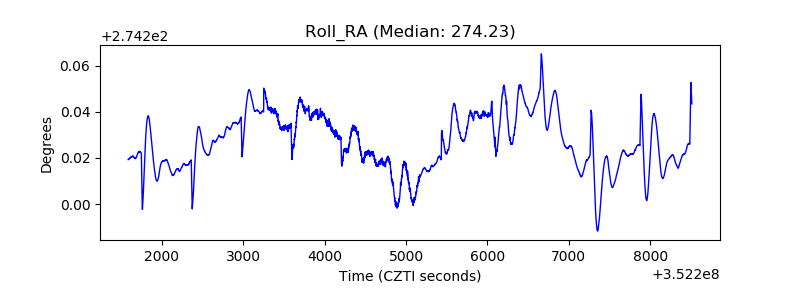 |
| Veto Counter | 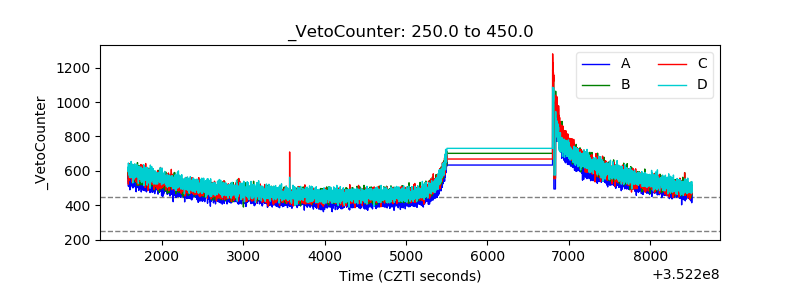 |