| Param | Original file | Final file |
|---|---|---|
| Filename | modeM0/AS1A10_083T01_9000004214_29313cztM0_level2.evt | modeM0/AS1A10_083T01_9000004214_29313cztM0_level2_quad_clean.evt |
| Size (bytes) | 875,839,680 | 80,858,880 |
| Size | 835.3 MB | 77.1 MB |
| Events in quadrant A | 3,587,083 | 549,604 |
| Events in quadrant B | 4,122,571 | 554,936 |
| Events in quadrant C | 12,691,252 | 413,885 |
| Events in quadrant D | 5,714,686 | 505,194 |
| Mode SS | |||
|---|---|---|---|
| Quadrant | BADHDUFLAG | Total packets | Discarded packets |
| A | 0 | 122 | 0 |
| B | 0 | 122 | 0 |
| C | 0 | 122 | 0 |
| D | 0 | 122 | 0 |
| Mode M9 | |||
|---|---|---|---|
| Quadrant | BADHDUFLAG | Total packets | Discarded packets |
| A | 0 | 13 | 0 |
| B | 0 | 13 | 0 |
| C | 0 | 13 | 0 |
| D | 0 | 13 | 0 |
| Mode M0 | |||
|---|---|---|---|
| Quadrant | BADHDUFLAG | Total packets | Discarded packets |
| A | 0 | 14248 | 1 |
| B | 0 | 15942 | 1 |
| C | 0 | 41826 | 1 |
| D | 0 | 21396 | 1 |
| Quadrant | Total seconds | Saturated seconds | Saturation percentage |
|---|---|---|---|
| A | 6074 | 151 | 2.486006% |
| B | 6075 | 301 | 4.954733% |
| C | 6075 | 4636 | 76.312757% |
| D | 6075 | 350 | 5.761317% |
Noise dominated data is calculated using 1-second bins in cleaned event files. If a bin has >2000 counts, and if more than 50% of those come from <1% of pixels, then it is considered to be noise-dominated and hence unusable.
| Quadrant | # 1 sec bins | Bins with >0 counts | Bins with >2000 counts | High rate bins dominated by noise | Noise dominated (total time) | Noise dominated (detector-on time) | Marked lightcurve |
|---|---|---|---|---|---|---|---|
| A | 7304 | 6075 | 58 | 58 | 0.79% | 0.95% | 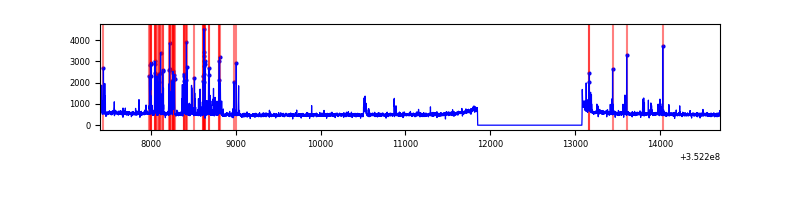 |
| B | 7305 | 6076 | 166 | 166 | 2.27% | 2.73% | 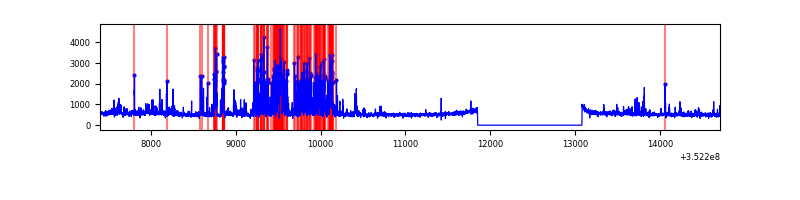 |
| C | 7305 | 6076 | 3528 | 3528 | 48.30% | 58.06% | 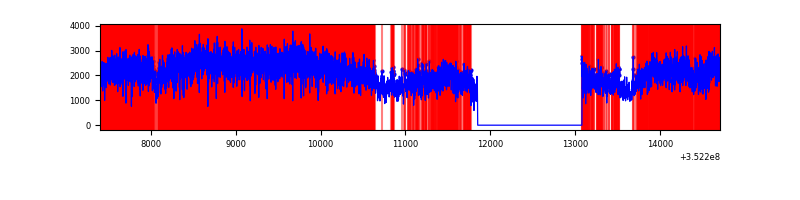 |
| D | 7305 | 6076 | 271 | 271 | 3.71% | 4.46% | 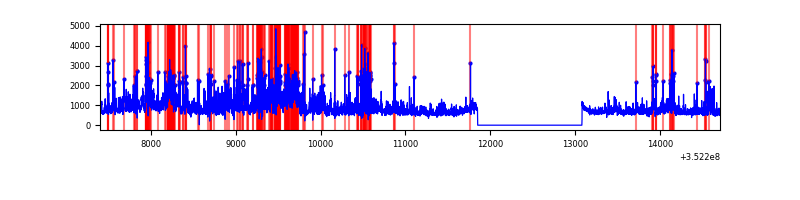 |
Top three noisy pixels from each quadrant. If the there are fewer than three noisy pixels in the level2.evt file, extra rows are filled as -1
| Pixel properties | Quadrant properties | ||||||
|---|---|---|---|---|---|---|---|
| Quadrant | DetID | PixID | Counts | Sigma | Mean | Median | Sigma |
| A | 0 | 13 | 453451 | 2836.92 | 802 | 789 | 159.6 |
| A | 14 | 235 | 16079 | 95.83 | 802 | 789 | 159.6 |
| A | 15 | 174 | 14308 | 84.73 | 802 | 789 | 159.6 |
| B | 5 | 255 | 666112 | 4611.76 | 780 | 765 | 144.3 |
| B | 5 | 172 | 190044 | 1311.96 | 780 | 765 | 144.3 |
| B | 0 | 190 | 168622 | 1163.48 | 780 | 765 | 144.3 |
| C | 3 | 233 | 10300319 | 77091.46 | 583 | 586 | 133.6 |
| C | 14 | 238 | 95556 | 710.83 | 583 | 586 | 133.6 |
| C | 2 | 114 | 11642 | 82.75 | 583 | 586 | 133.6 |
| D | 8 | 195 | 968425 | 5423.2 | 767 | 749 | 178.4 |
| D | 1 | 52 | 844093 | 4726.4 | 767 | 749 | 178.4 |
| D | 7 | 80 | 484206 | 2709.47 | 767 | 749 | 178.4 |
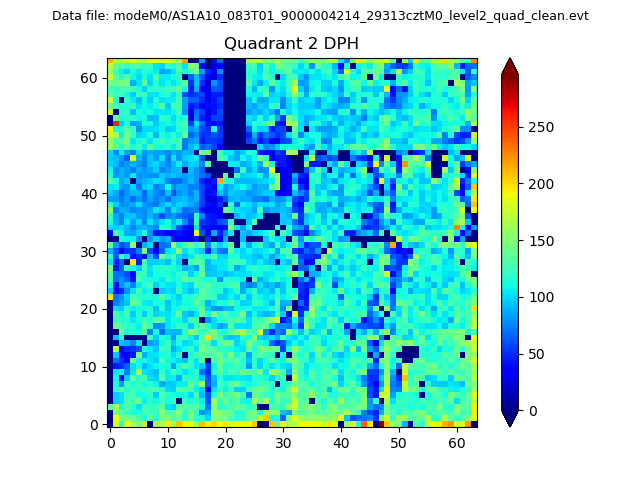
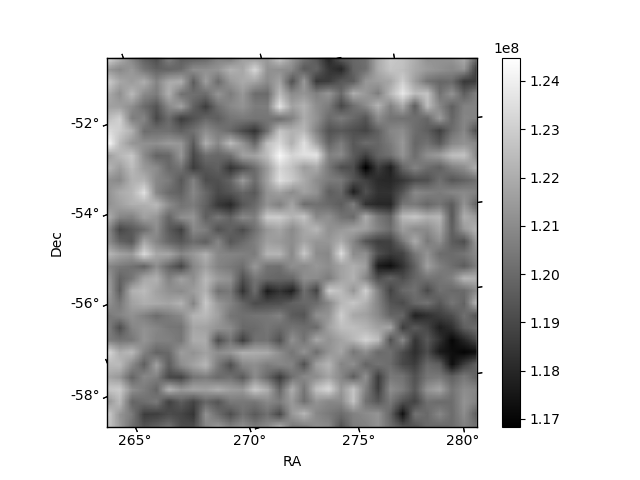
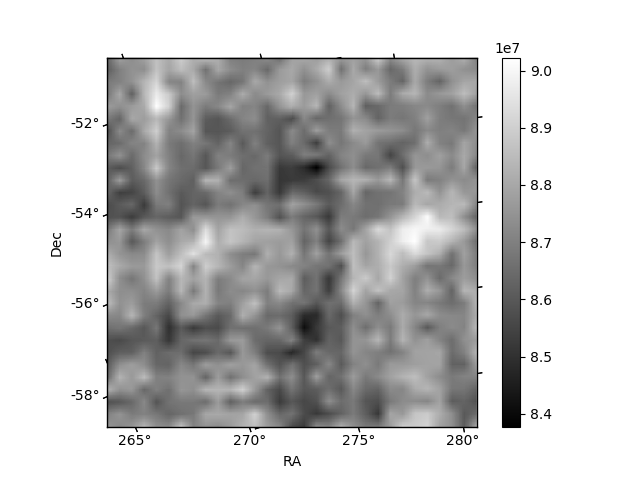
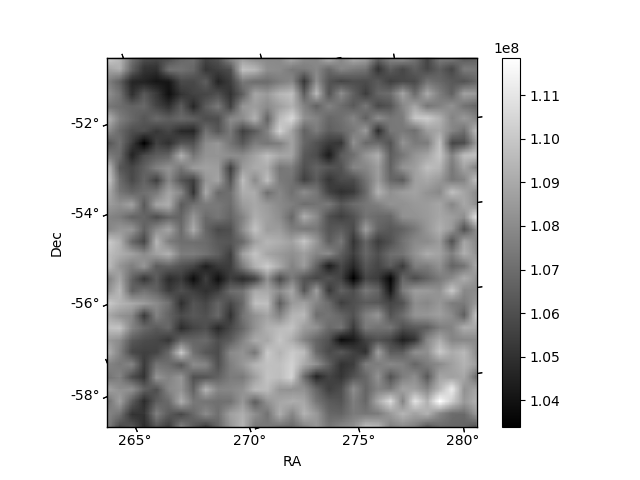
Histogram calculated using DETX and DETY for each event in the final _common_clean file
| Quadrant A | 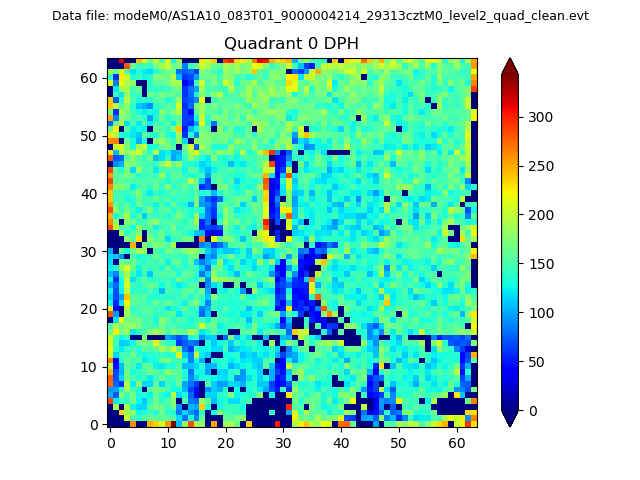 |
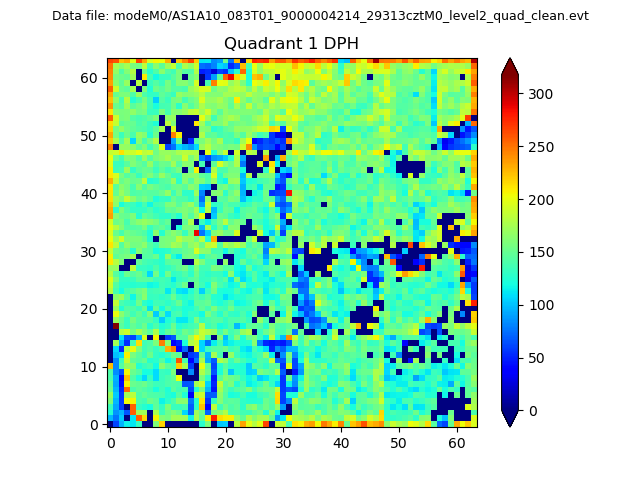 |
Quadrant B |
|---|---|---|---|
| Quadrant D | 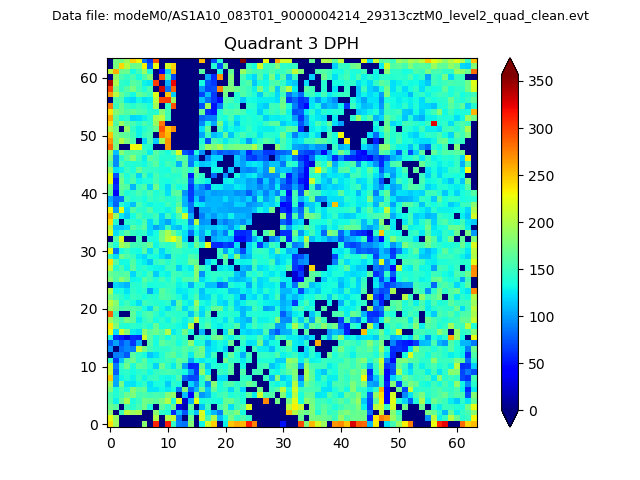 |
 |
Quadrant C |
| Plot type | Count rate plots | Images |
|---|---|---|
| Comparison with Poisson distribution Blue bars denote a histogram of data divided into 1 sec bins. Red curve is a Poisson curve with rate = median count rate of data. |
 |
 |
| Quadrant-wise count rates Data is divided into 100 sec bins |
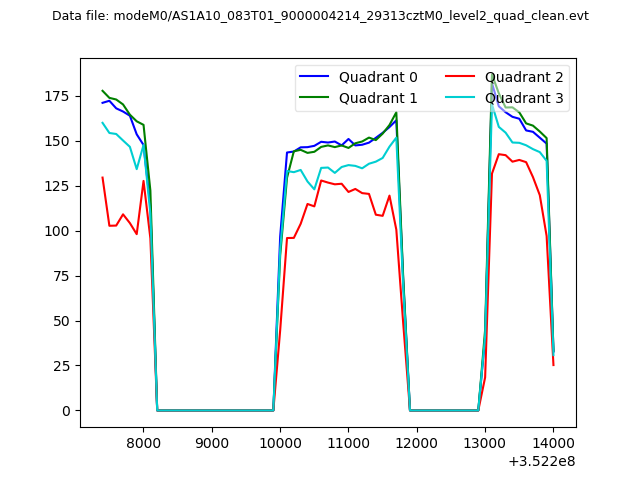 |
|
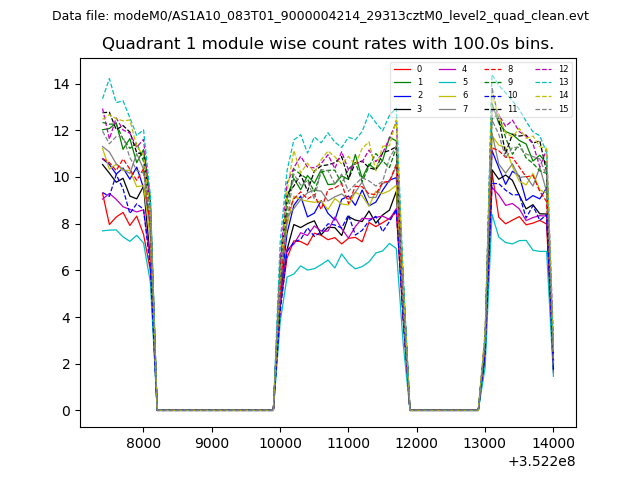
| Module-wise count rates for Quadrant A Data is divided into 100 sec bins |
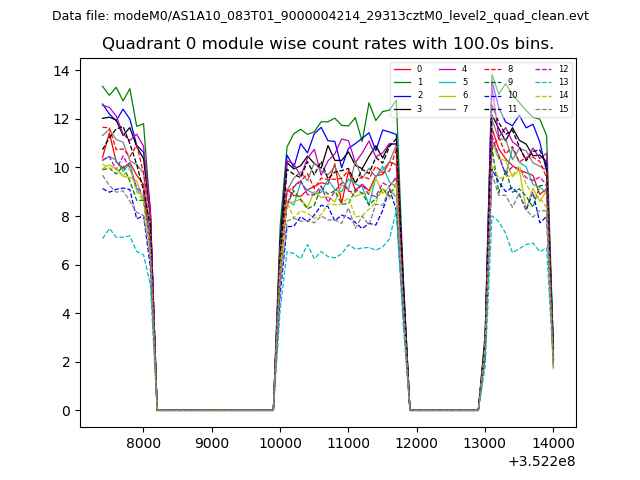 |
 |
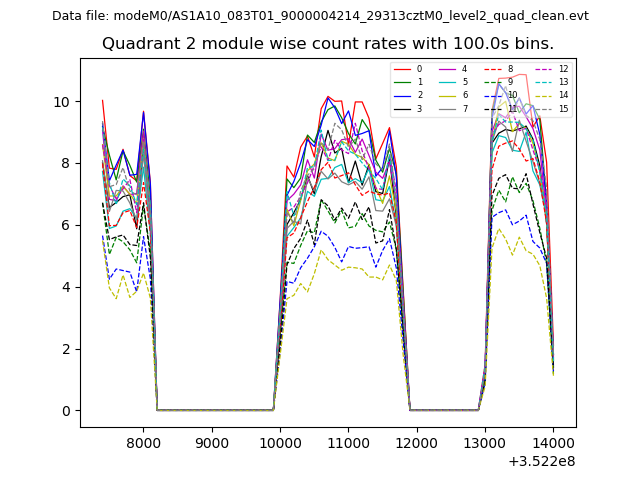
| Module-wise count rates for Quadrant B Data is divided into 100 sec bins |
 |
 |
| Module-wise count rates for Quadrant C Data is divided into 100 sec bins |
 |
 |
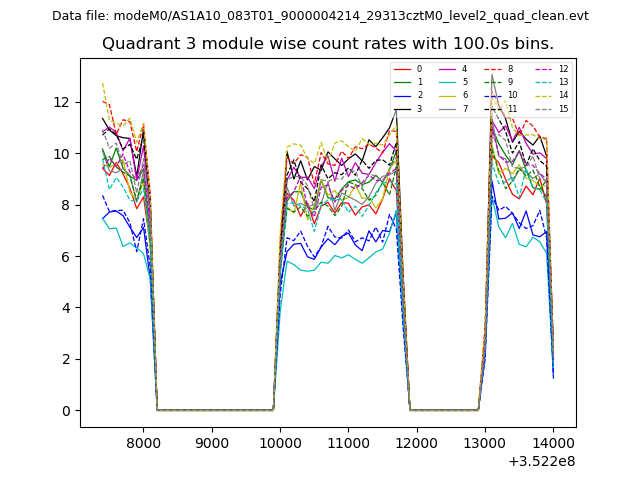
| Module-wise count rates for Quadrant D Data is divided into 100 sec bins |
 |
 |
| Parameter | Plot |
|---|---|
| CZT HV Monitor | 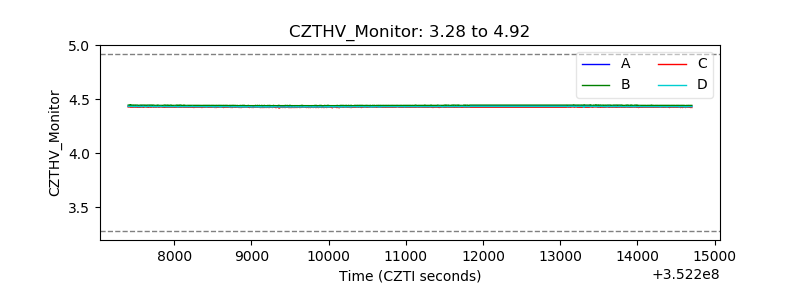 |
| D_VDD | 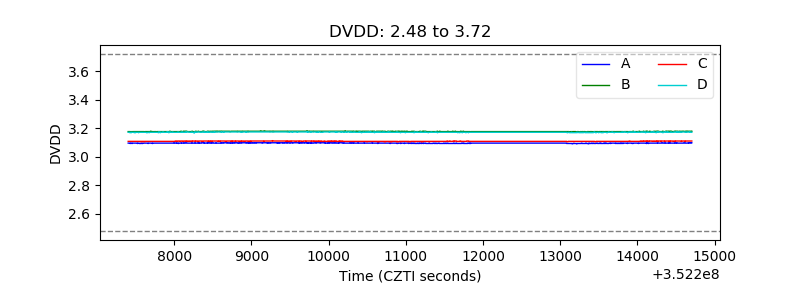 |
| Temperature 1 | 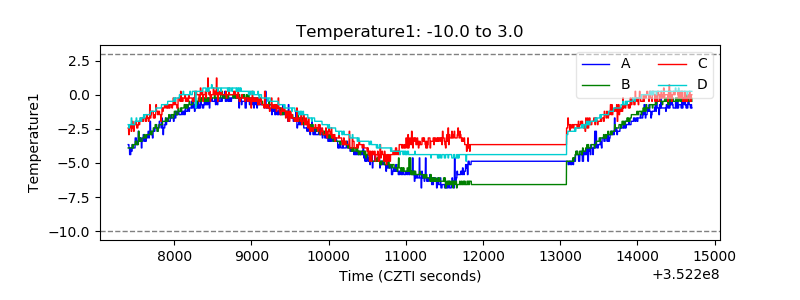 |
| Veto HV Monitor | 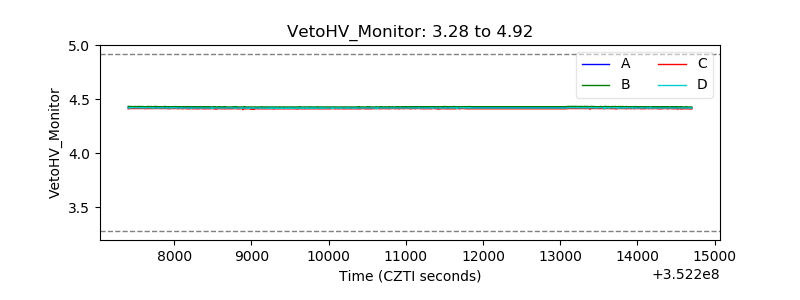 |
| Veto LLD | 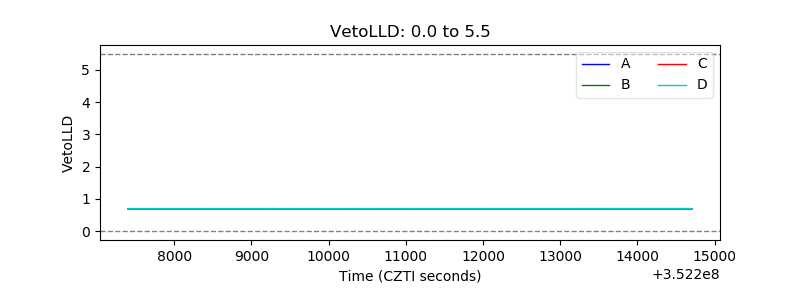 |
| Alpha Counter | 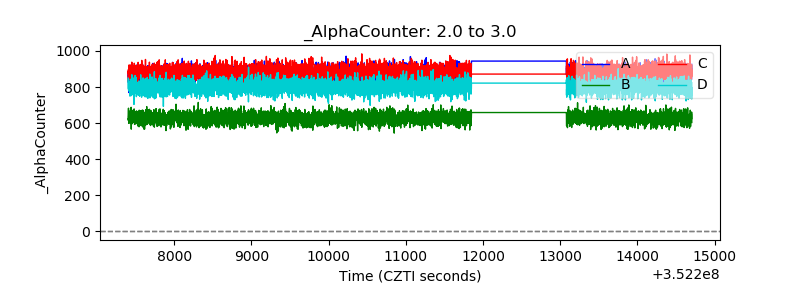 |
| _CPM_Rate | 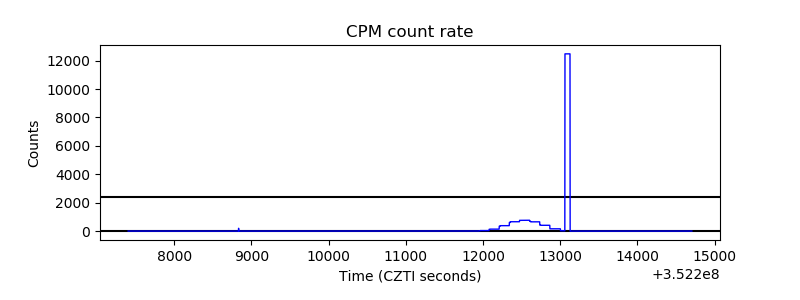 |
| CZT Counter | 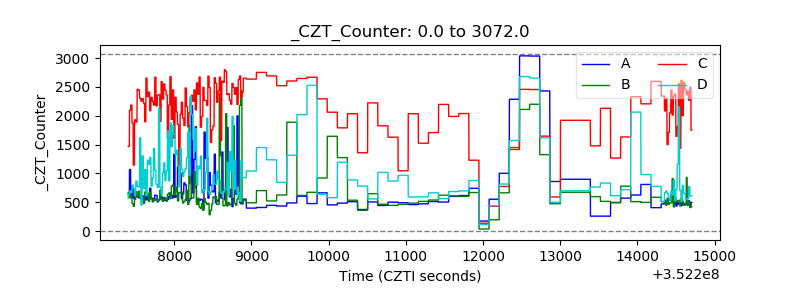 |
| +2.5 Volts monitor |  |
| +5 Volts monitor |  |
| _ROLL_ROT | 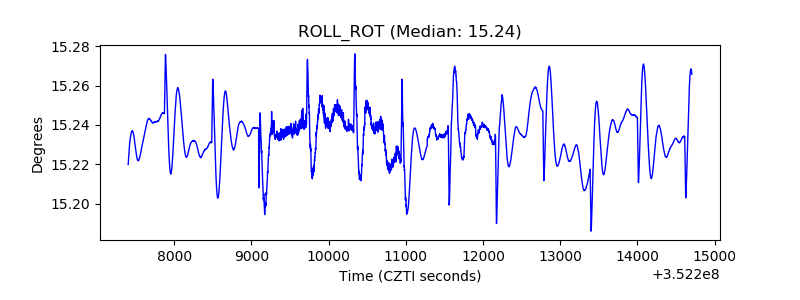 |
| _Roll_DEC | 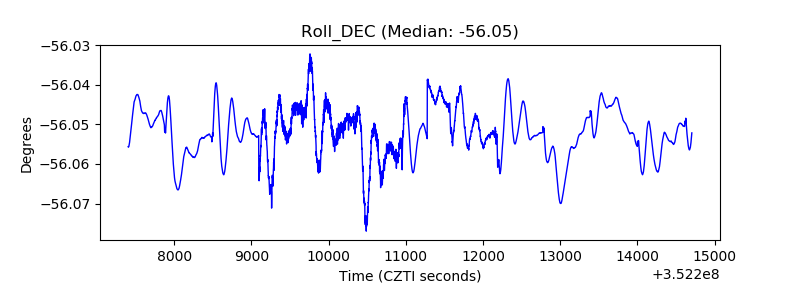 |
| _Roll_RA | 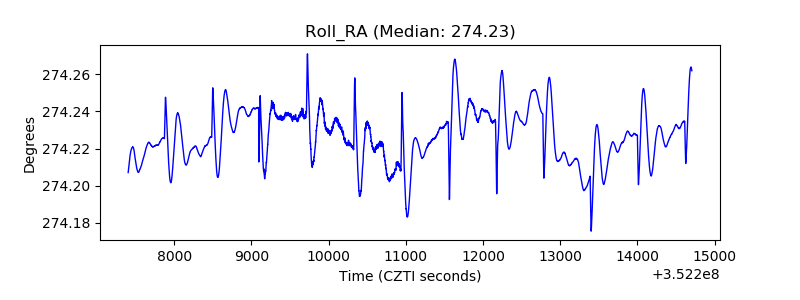 |
| Veto Counter | 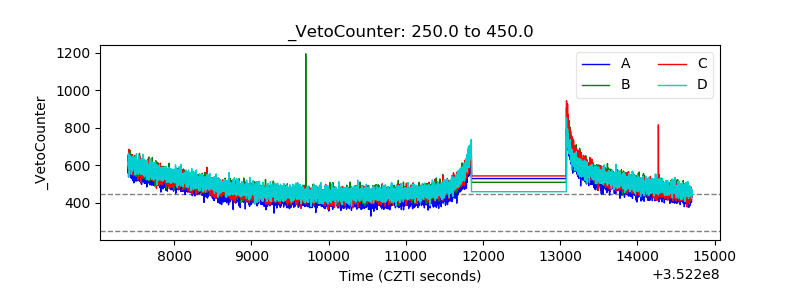 |