| Param | Original file | Final file |
|---|---|---|
| Filename | modeM0/AS1A10_083T01_9000004214_29314cztM0_level2.evt | modeM0/AS1A10_083T01_9000004214_29314cztM0_level2_quad_clean.evt |
| Size (bytes) | 824,947,200 | 84,712,320 |
| Size | 786.7 MB | 80.8 MB |
| Events in quadrant A | 3,650,815 | 551,825 |
| Events in quadrant B | 3,699,723 | 560,589 |
| Events in quadrant C | 10,980,804 | 478,649 |
| Events in quadrant D | 6,203,278 | 509,369 |
| Mode SS | |||
|---|---|---|---|
| Quadrant | BADHDUFLAG | Total packets | Discarded packets |
| A | 0 | 136 | 0 |
| B | 0 | 136 | 0 |
| C | 0 | 136 | 0 |
| D | 0 | 136 | 0 |
| Mode M9 | |||
|---|---|---|---|
| Quadrant | BADHDUFLAG | Total packets | Discarded packets |
| A | 0 | 10 | 0 |
| B | 0 | 10 | 0 |
| C | 0 | 10 | 0 |
| D | 0 | 10 | 0 |
| Mode M0 | |||
|---|---|---|---|
| Quadrant | BADHDUFLAG | Total packets | Discarded packets |
| A | 0 | 14884 | 1 |
| B | 0 | 14933 | 1 |
| C | 0 | 37270 | 1 |
| D | 0 | 23194 | 1 |
| Quadrant | Total seconds | Saturated seconds | Saturation percentage |
|---|---|---|---|
| A | 6657 | 158 | 2.373441% |
| B | 6657 | 154 | 2.313354% |
| C | 6657 | 2686 | 40.348505% |
| D | 6657 | 342 | 5.137449% |
Noise dominated data is calculated using 1-second bins in cleaned event files. If a bin has >2000 counts, and if more than 50% of those come from <1% of pixels, then it is considered to be noise-dominated and hence unusable.
| Quadrant | # 1 sec bins | Bins with >0 counts | Bins with >2000 counts | High rate bins dominated by noise | Noise dominated (total time) | Noise dominated (detector-on time) | Marked lightcurve |
|---|---|---|---|---|---|---|---|
| A | 7617 | 6658 | 21 | 21 | 0.28% | 0.32% | 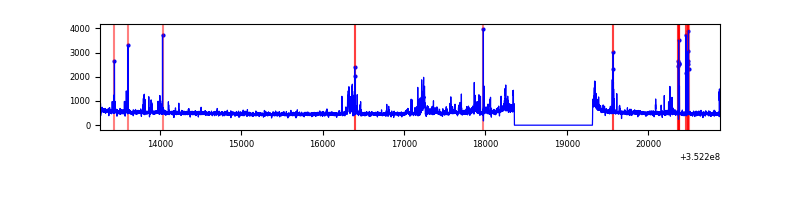 |
| B | 7617 | 6658 | 29 | 29 | 0.38% | 0.44% | 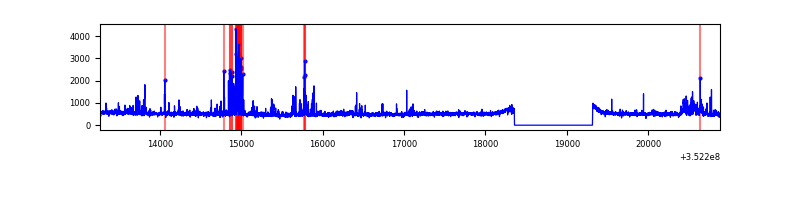 |
| C | 7617 | 6658 | 1888 | 1888 | 24.79% | 28.36% | 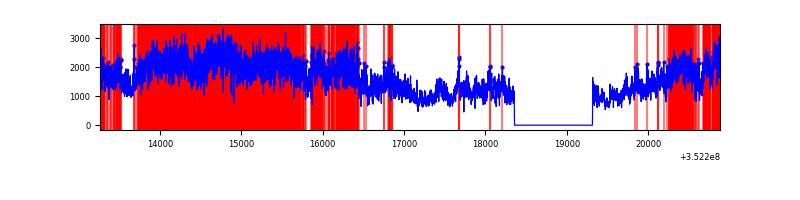 |
| D | 7617 | 6658 | 265 | 265 | 3.48% | 3.98% | 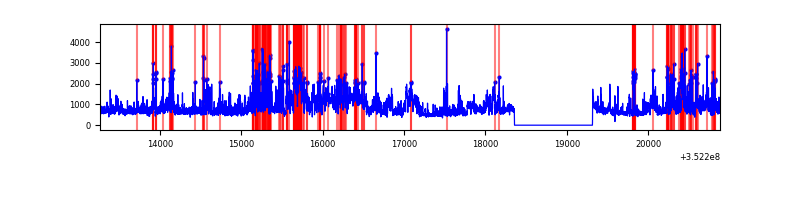 |
Top three noisy pixels from each quadrant. If the there are fewer than three noisy pixels in the level2.evt file, extra rows are filled as -1
| Pixel properties | Quadrant properties | ||||||
|---|---|---|---|---|---|---|---|
| Quadrant | DetID | PixID | Counts | Sigma | Mean | Median | Sigma |
| A | 0 | 13 | 166939 | 980.9 | 849 | 831 | 169.3 |
| A | 14 | 235 | 110242 | 646.09 | 849 | 831 | 169.3 |
| A | 15 | 174 | 68133 | 397.43 | 849 | 831 | 169.3 |
| B | 5 | 255 | 146735 | 944.97 | 837 | 819 | 154.4 |
| B | 0 | 190 | 146562 | 943.85 | 837 | 819 | 154.4 |
| B | 3 | 209 | 44778 | 284.68 | 837 | 819 | 154.4 |
| C | 3 | 233 | 7951981 | 46688.9 | 738 | 742 | 170.3 |
| C | 14 | 238 | 117817 | 687.45 | 738 | 742 | 170.3 |
| C | 2 | 114 | 14910 | 83.19 | 738 | 742 | 170.3 |
| D | 1 | 52 | 1635041 | 8377.29 | 817 | 797 | 195.1 |
| D | 8 | 195 | 766425 | 3924.68 | 817 | 797 | 195.1 |
| D | 2 | 250 | 271608 | 1388.2 | 817 | 797 | 195.1 |
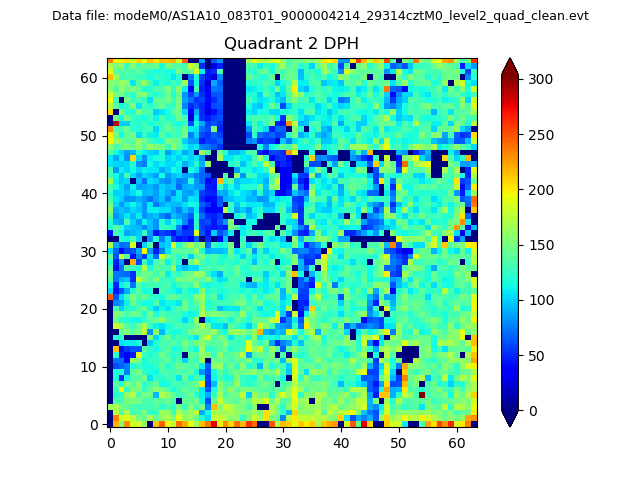
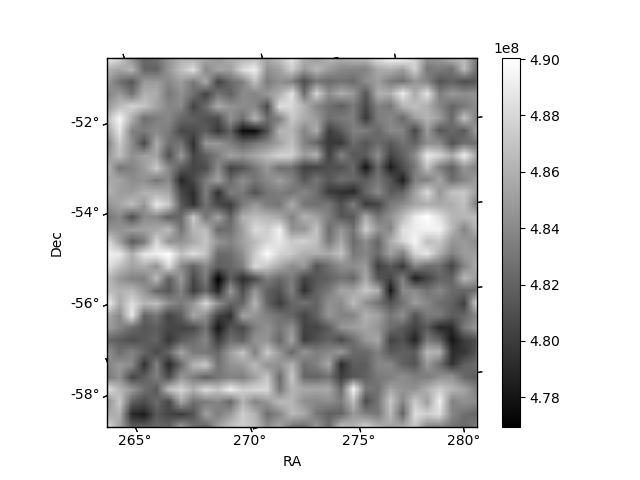
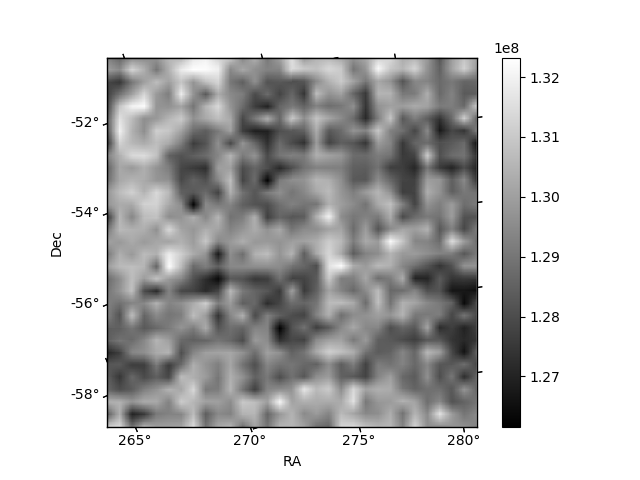
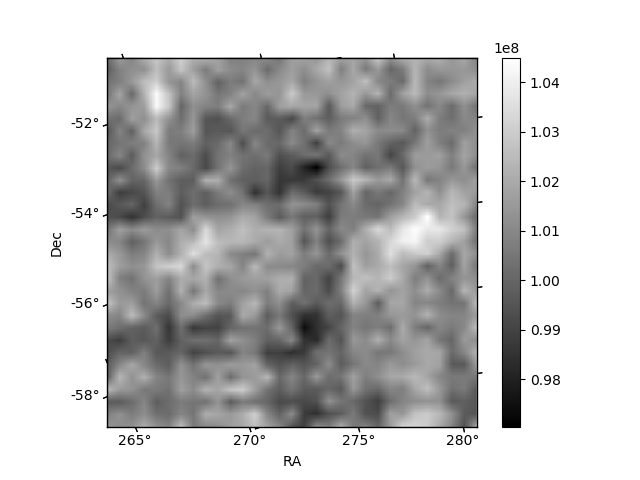
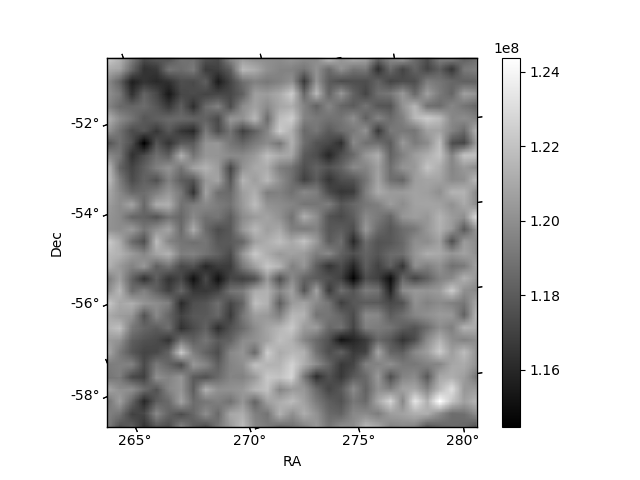
Histogram calculated using DETX and DETY for each event in the final _common_clean file
| Quadrant A | 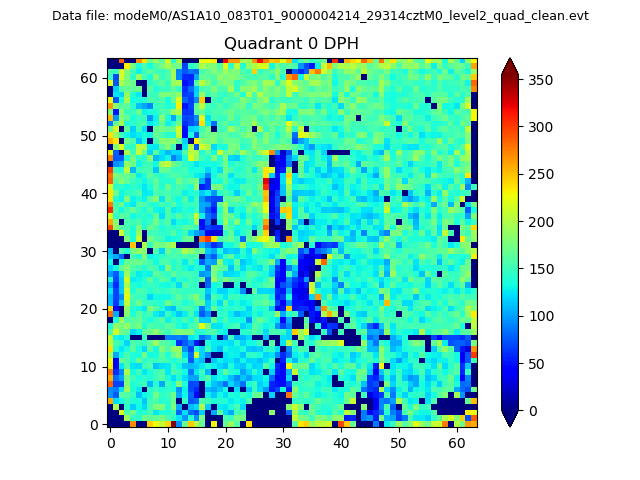 |
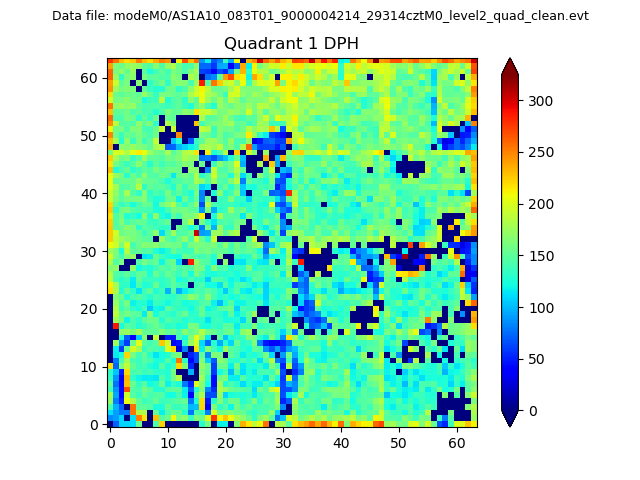 |
Quadrant B |
|---|---|---|---|
| Quadrant D | 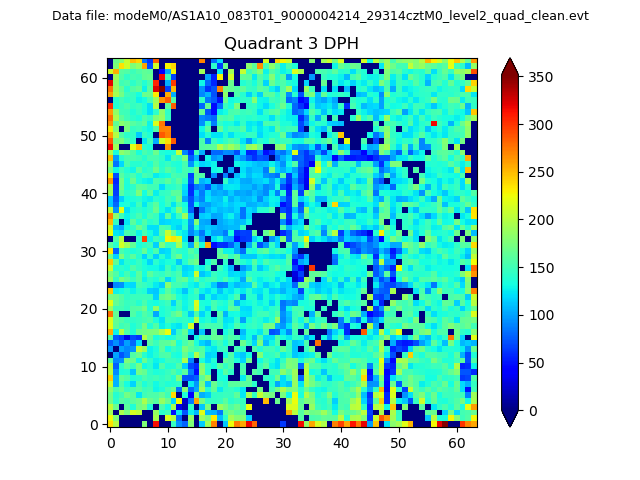 |
 |
Quadrant C |
| Plot type | Count rate plots | Images |
|---|---|---|
| Comparison with Poisson distribution Blue bars denote a histogram of data divided into 1 sec bins. Red curve is a Poisson curve with rate = median count rate of data. |
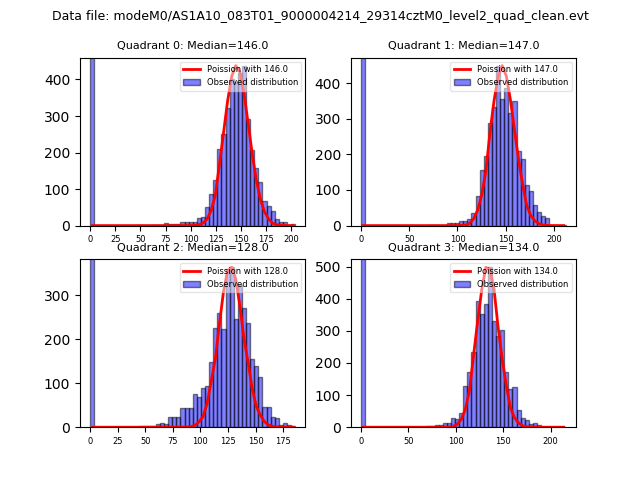 |
 |
| Quadrant-wise count rates Data is divided into 100 sec bins |
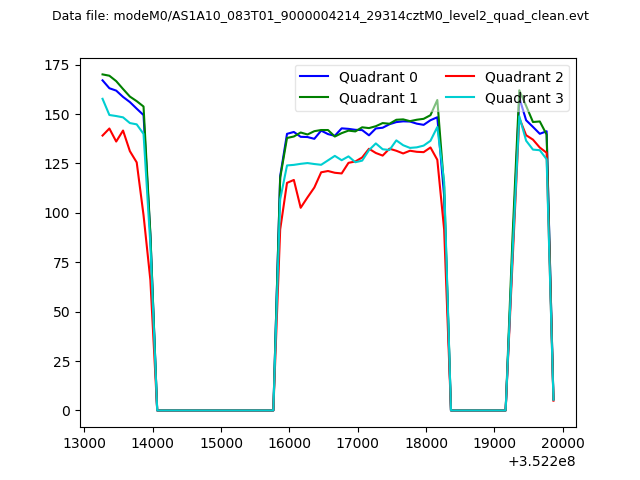 |
|
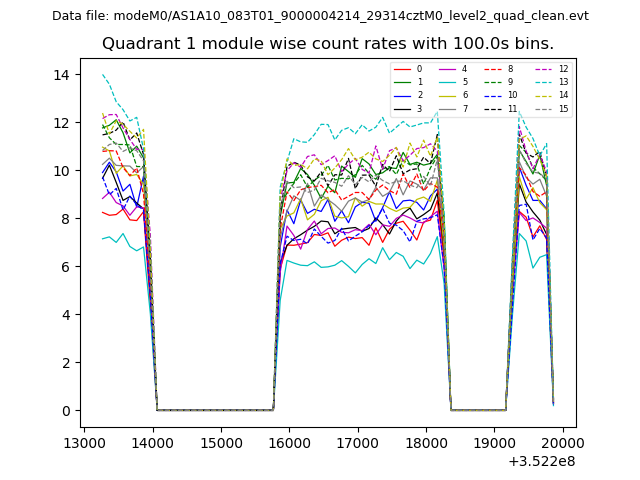
| Module-wise count rates for Quadrant A Data is divided into 100 sec bins |
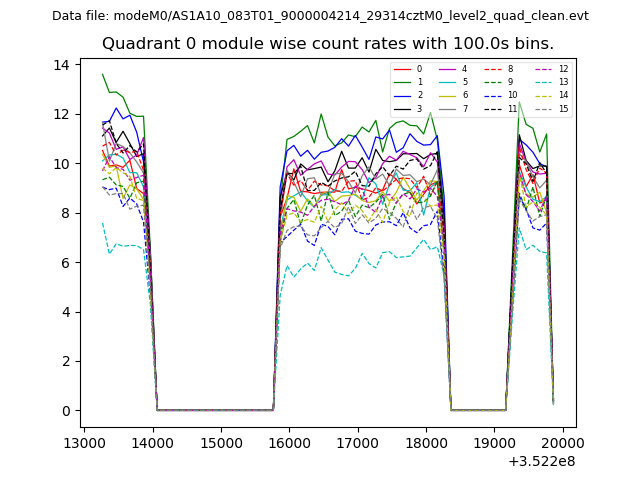 |
 |
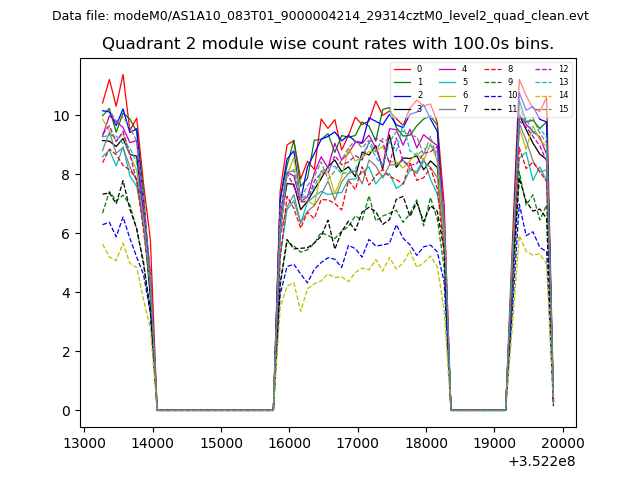
| Module-wise count rates for Quadrant B Data is divided into 100 sec bins |
 |
 |
| Module-wise count rates for Quadrant C Data is divided into 100 sec bins |
 |
 |
| Module-wise count rates for Quadrant D Data is divided into 100 sec bins |
 |
 |
| Parameter | Plot |
|---|---|
| CZT HV Monitor | 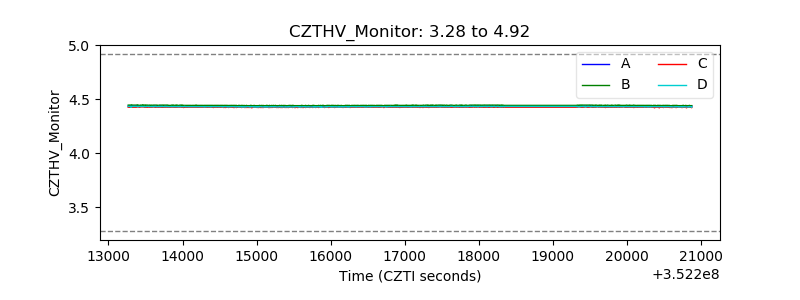 |
| D_VDD |  |
| Temperature 1 |  |
| Veto HV Monitor | 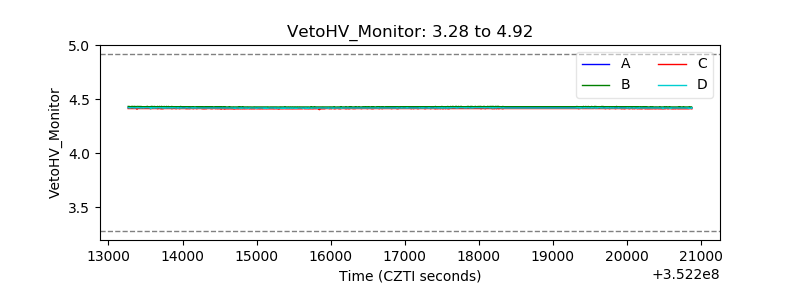 |
| Veto LLD | 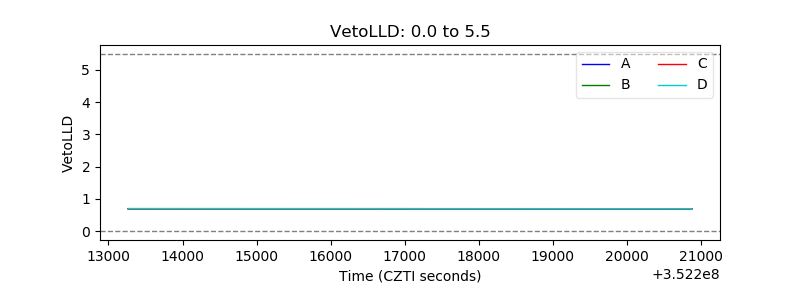 |
| Alpha Counter | 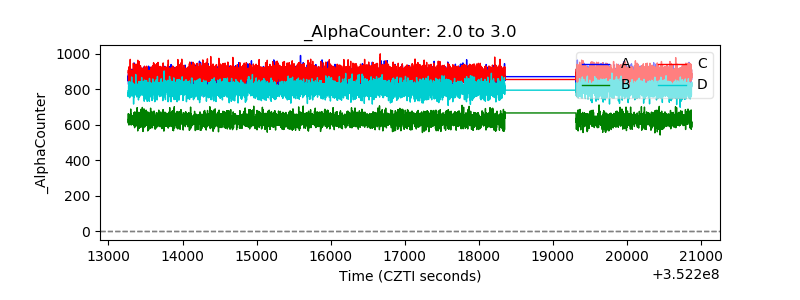 |
| _CPM_Rate | 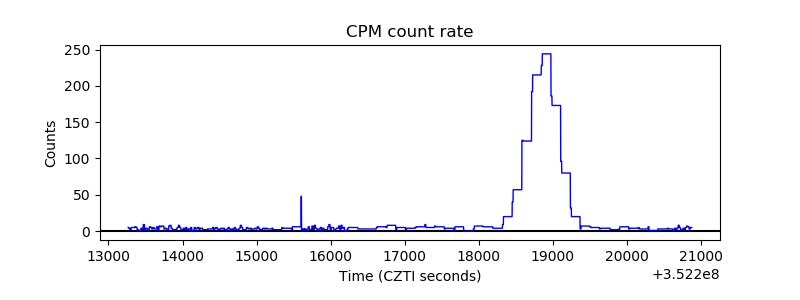 |
| CZT Counter | 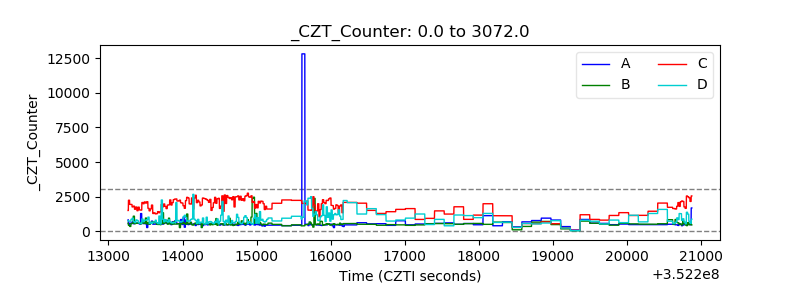 |
| +2.5 Volts monitor |  |
| +5 Volts monitor |  |
| _ROLL_ROT |  |
| _Roll_DEC |  |
| _Roll_RA | 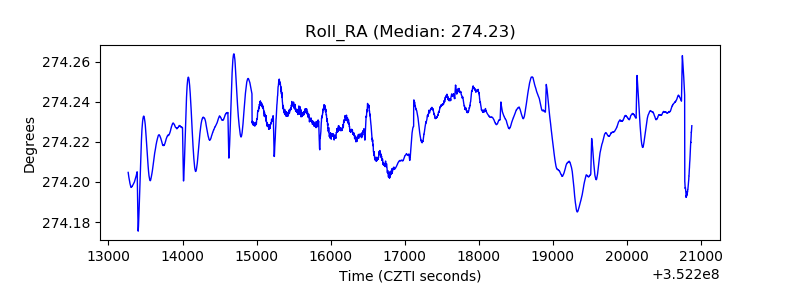 |
| Veto Counter |  |