| Param | Original file | Final file |
|---|---|---|
| Filename | modeM0/AS1A10_083T01_9000004214_29315cztM0_level2.evt | modeM0/AS1A10_083T01_9000004214_29315cztM0_level2_quad_clean.evt |
| Size (bytes) | 848,174,400 | 84,790,080 |
| Size | 808.9 MB | 80.9 MB |
| Events in quadrant A | 4,893,340 | 532,830 |
| Events in quadrant B | 4,090,384 | 549,756 |
| Events in quadrant C | 10,221,617 | 481,897 |
| Events in quadrant D | 5,997,905 | 501,896 |
| Mode SS | |||
|---|---|---|---|
| Quadrant | BADHDUFLAG | Total packets | Discarded packets |
| A | 0 | 146 | 0 |
| B | 0 | 146 | 0 |
| C | 0 | 146 | 0 |
| D | 0 | 146 | 0 |
| Mode M9 | |||
|---|---|---|---|
| Quadrant | BADHDUFLAG | Total packets | Discarded packets |
| A | 0 | 6 | 0 |
| B | 0 | 6 | 0 |
| C | 0 | 6 | 0 |
| D | 0 | 6 | 0 |
| Mode M0 | |||
|---|---|---|---|
| Quadrant | BADHDUFLAG | Total packets | Discarded packets |
| A | 0 | 19101 | 2 |
| B | 0 | 16555 | 2 |
| C | 0 | 35422 | 2 |
| D | 0 | 22656 | 2 |
| Quadrant | Total seconds | Saturated seconds | Saturation percentage |
|---|---|---|---|
| A | 7186 | 380 | 5.288060% |
| B | 7187 | 262 | 3.645471% |
| C | 7187 | 1553 | 21.608460% |
| D | 7187 | 468 | 6.511757% |
Noise dominated data is calculated using 1-second bins in cleaned event files. If a bin has >2000 counts, and if more than 50% of those come from <1% of pixels, then it is considered to be noise-dominated and hence unusable.
| Quadrant | # 1 sec bins | Bins with >0 counts | Bins with >2000 counts | High rate bins dominated by noise | Noise dominated (total time) | Noise dominated (detector-on time) | Marked lightcurve |
|---|---|---|---|---|---|---|---|
| A | 7781 | 7187 | 226 | 226 | 2.90% | 3.14% | 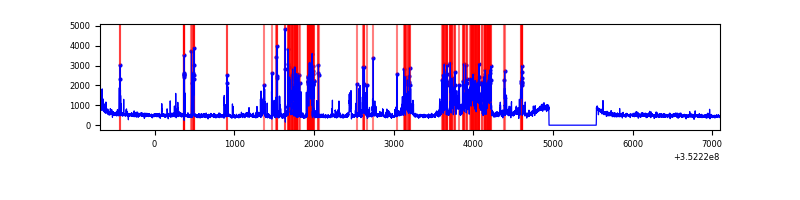 |
| B | 7782 | 7188 | 101 | 101 | 1.30% | 1.41% | 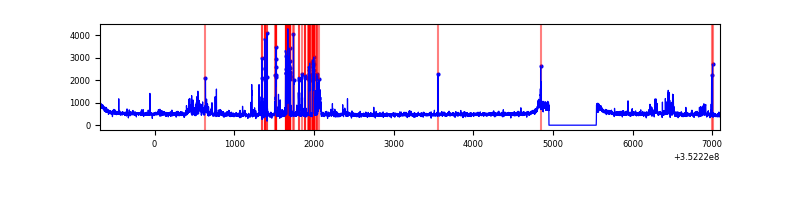 |
| C | 7782 | 7188 | 789 | 789 | 10.14% | 10.98% | 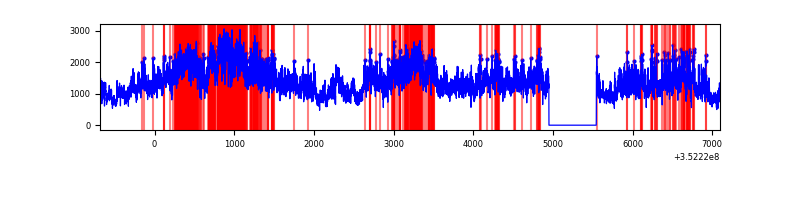 |
| D | 7782 | 7188 | 266 | 266 | 3.42% | 3.70% | 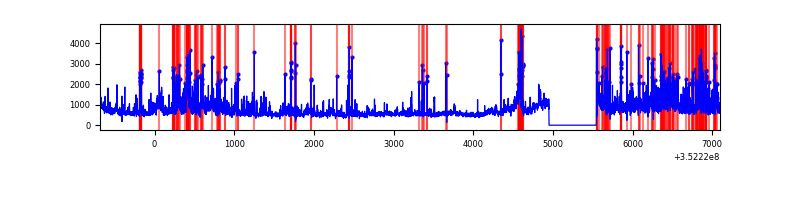 |
Top three noisy pixels from each quadrant. If the there are fewer than three noisy pixels in the level2.evt file, extra rows are filled as -1
| Pixel properties | Quadrant properties | ||||||
|---|---|---|---|---|---|---|---|
| Quadrant | DetID | PixID | Counts | Sigma | Mean | Median | Sigma |
| A | 14 | 235 | 889571 | 4881.58 | 897 | 877 | 182.1 |
| A | 0 | 13 | 274481 | 1502.9 | 897 | 877 | 182.1 |
| A | 1 | 113 | 264171 | 1446.27 | 897 | 877 | 182.1 |
| B | 5 | 255 | 352167 | 2110.79 | 887 | 866 | 166.4 |
| B | 0 | 190 | 148798 | 888.85 | 887 | 866 | 166.4 |
| B | 3 | 209 | 55610 | 328.93 | 887 | 866 | 166.4 |
| C | 3 | 233 | 6855815 | 36120.59 | 818 | 823 | 189.8 |
| C | 14 | 238 | 127798 | 669.06 | 818 | 823 | 189.8 |
| C | 10 | 22 | 18700 | 94.2 | 818 | 823 | 189.8 |
| D | 1 | 52 | 1411080 | 6849.78 | 860 | 837 | 205.9 |
| D | 8 | 195 | 691711 | 3355.69 | 860 | 837 | 205.9 |
| D | 2 | 250 | 330489 | 1601.17 | 860 | 837 | 205.9 |
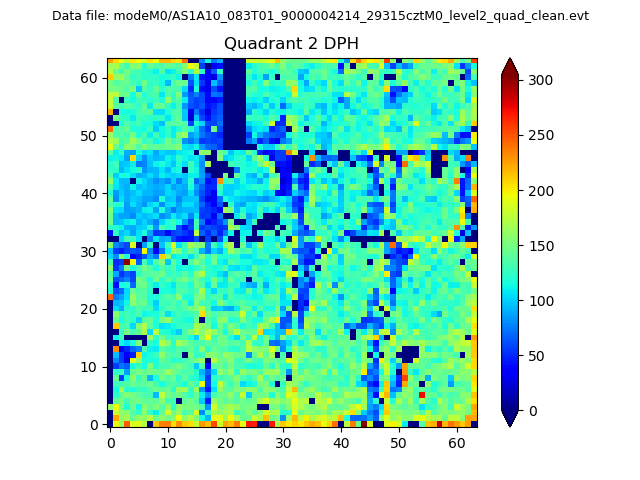
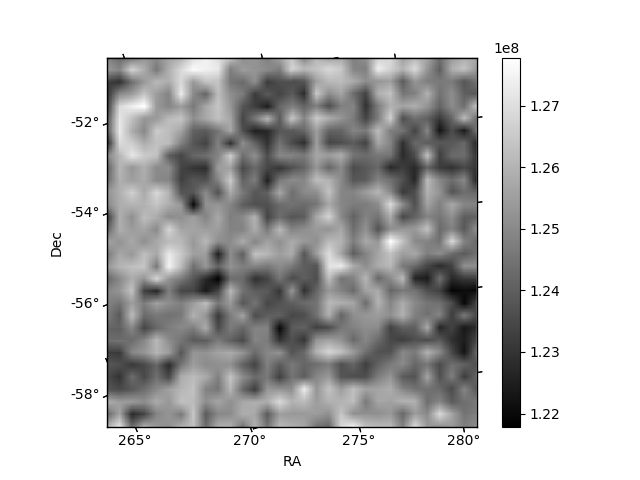
Histogram calculated using DETX and DETY for each event in the final _common_clean file
| Quadrant A |  |
 |
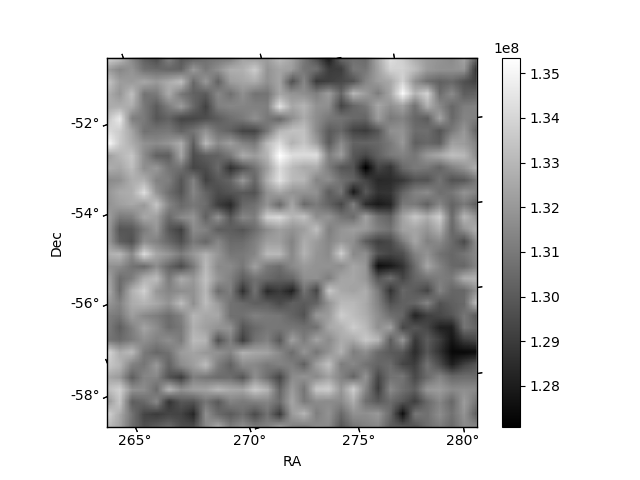
Quadrant B |
|---|---|---|---|
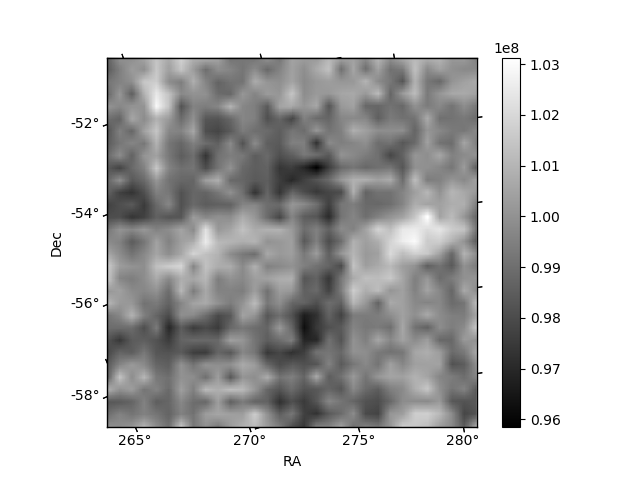
| Quadrant D |  |
 |
Quadrant C |
| Plot type | Count rate plots | Images |
|---|---|---|
| Comparison with Poisson distribution Blue bars denote a histogram of data divided into 1 sec bins. Red curve is a Poisson curve with rate = median count rate of data. |
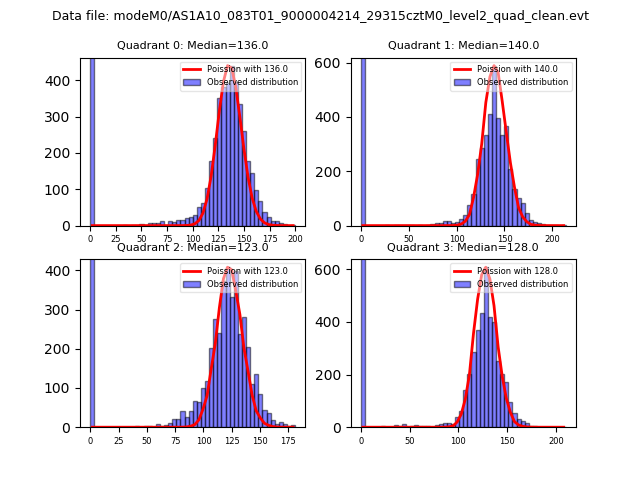 |
 |
| Quadrant-wise count rates Data is divided into 100 sec bins |
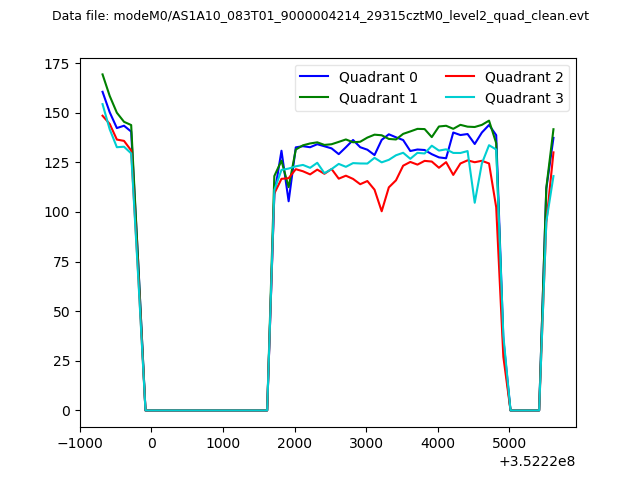 |
|
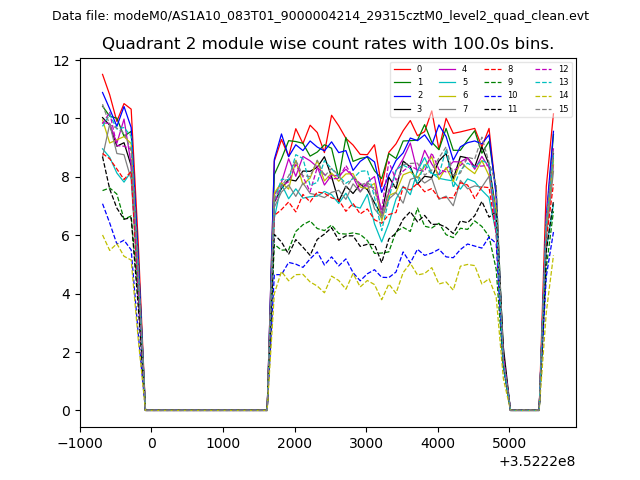
| Module-wise count rates for Quadrant A Data is divided into 100 sec bins |
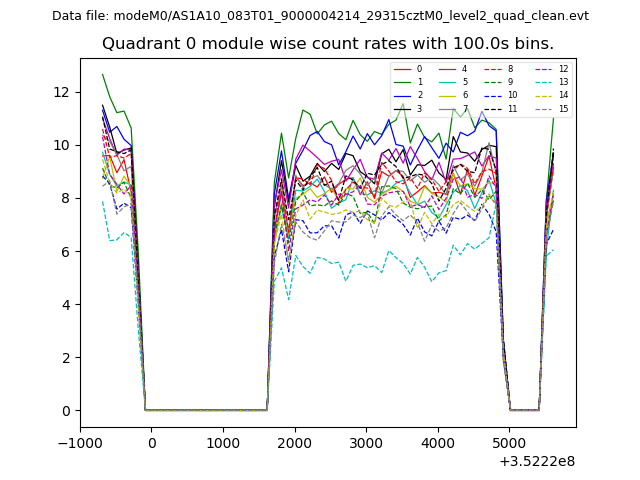 |
 |
| Module-wise count rates for Quadrant B Data is divided into 100 sec bins |
 |
 |
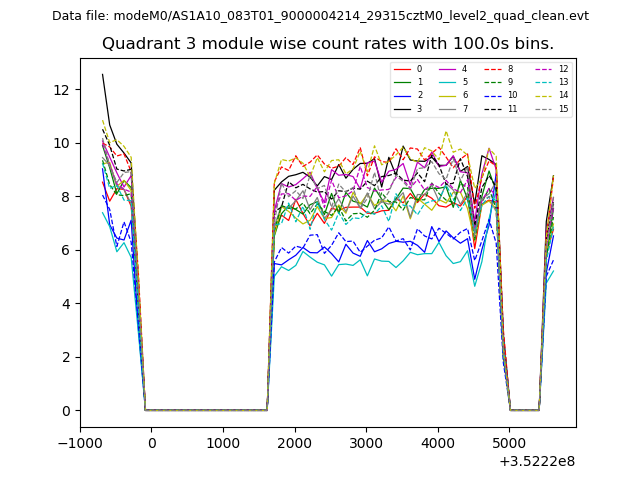
| Module-wise count rates for Quadrant C Data is divided into 100 sec bins |
 |
 |
| Module-wise count rates for Quadrant D Data is divided into 100 sec bins |
 |
 |
| Parameter | Plot |
|---|---|
| CZT HV Monitor | 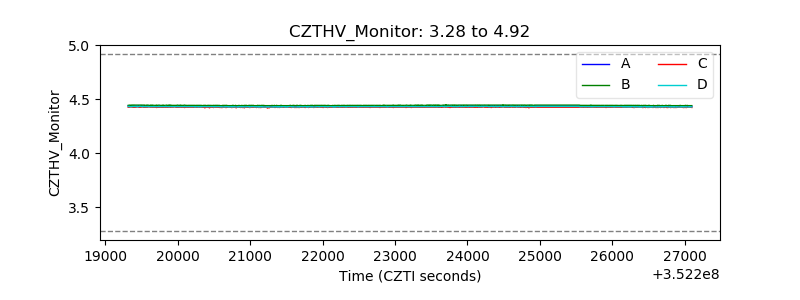 |
| D_VDD | 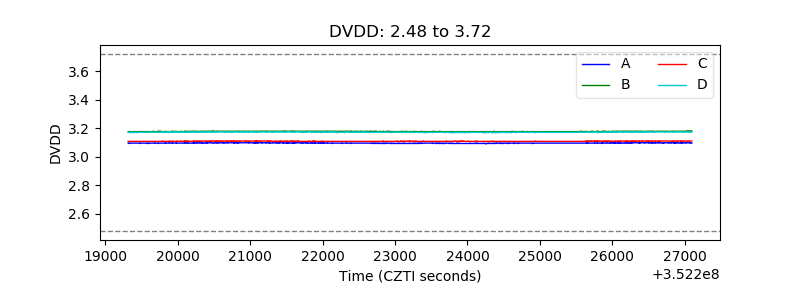 |
| Temperature 1 | 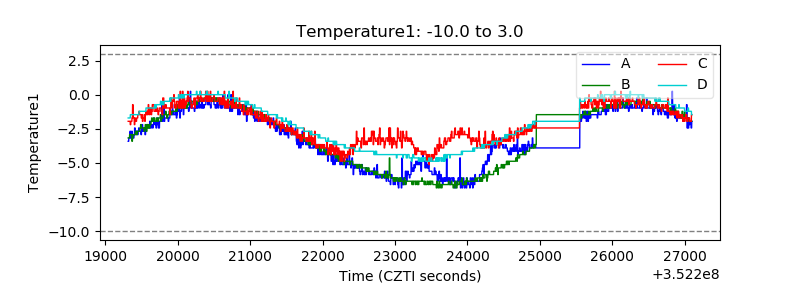 |
| Veto HV Monitor | 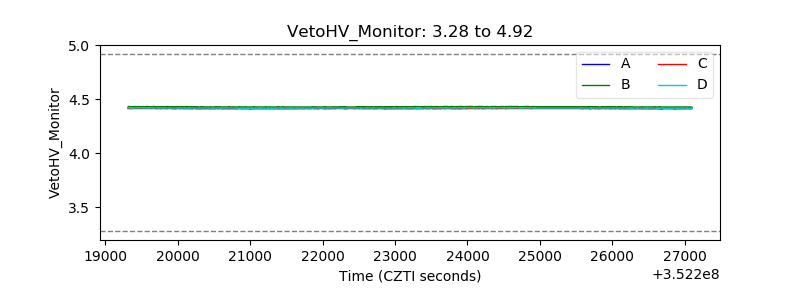 |
| Veto LLD | 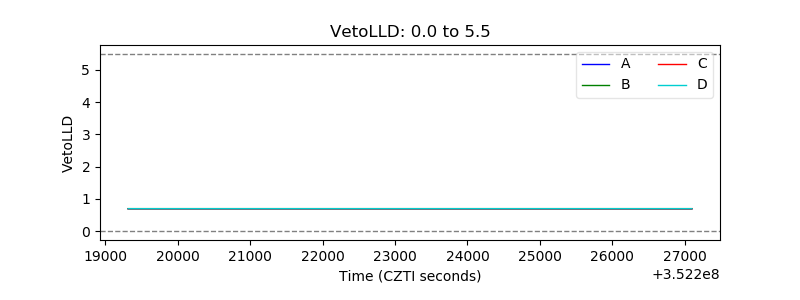 |
| Alpha Counter | 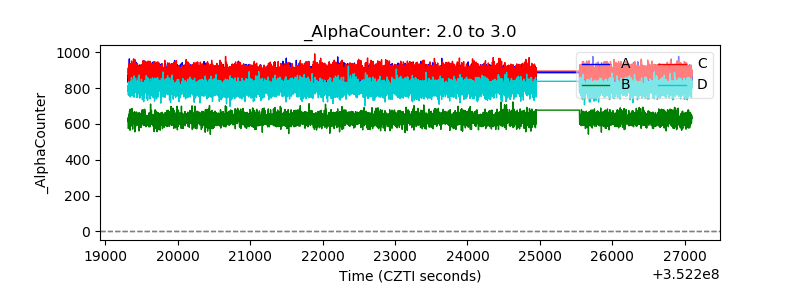 |
| _CPM_Rate | 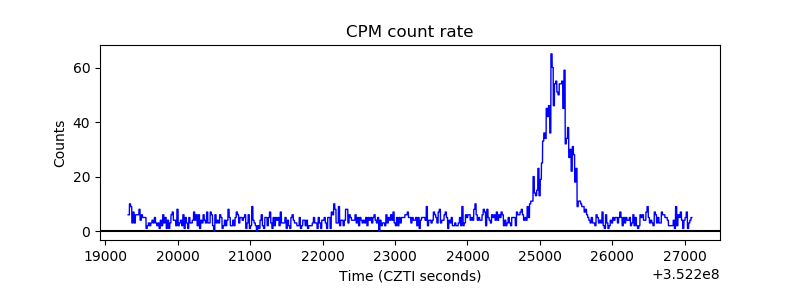 |
| CZT Counter |  |
| +2.5 Volts monitor |  |
| +5 Volts monitor | 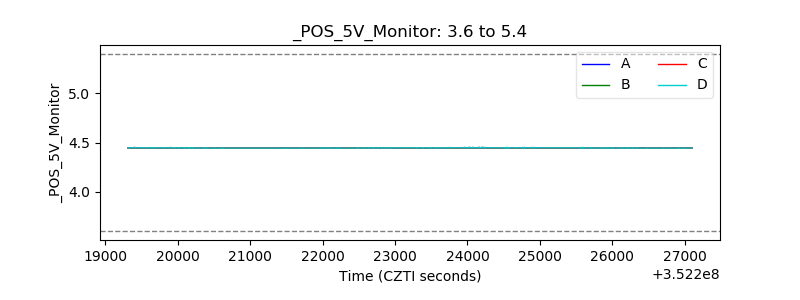 |
| _ROLL_ROT | 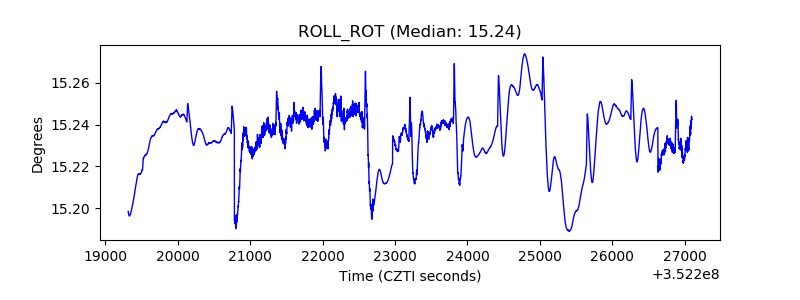 |
| _Roll_DEC | 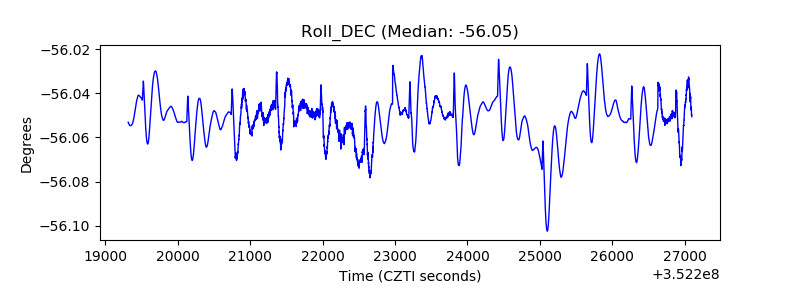 |
| _Roll_RA |  |
| Veto Counter | 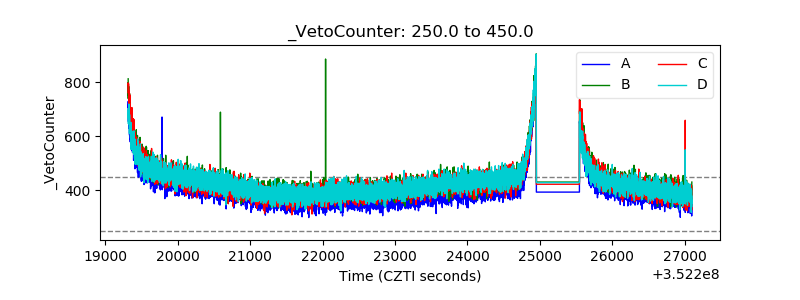 |