| Param | Original file | Final file |
|---|---|---|
| Filename | modeM0/AS1A10_083T01_9000004214_29316cztM0_level2.evt | modeM0/AS1A10_083T01_9000004214_29316cztM0_level2_quad_clean.evt |
| Size (bytes) | 253,146,240 | 27,786,240 |
| Size | 241.4 MB | 26.5 MB |
| Events in quadrant A | 1,224,417 | 171,904 |
| Events in quadrant B | 1,250,671 | 172,871 |
| Events in quadrant C | 2,358,810 | 158,535 |
| Events in quadrant D | 2,658,255 | 154,681 |
| Mode SS | |||
|---|---|---|---|
| Quadrant | BADHDUFLAG | Total packets | Discarded packets |
| A | 0 | 52 | 0 |
| B | 0 | 52 | 0 |
| C | 0 | 52 | 0 |
| D | 0 | 52 | 0 |
| Mode M0 | |||
|---|---|---|---|
| Quadrant | BADHDUFLAG | Total packets | Discarded packets |
| A | 0 | 5360 | 0 |
| B | 0 | 5403 | 0 |
| C | 0 | 8721 | 0 |
| D | 0 | 9666 | 0 |
| Quadrant | Total seconds | Saturated seconds | Saturation percentage |
|---|---|---|---|
| A | 2544 | 3 | 0.117925% |
| B | 2545 | 5 | 0.196464% |
| C | 2545 | 100 | 3.929273% |
| D | 2545 | 242 | 9.508841% |
Noise dominated data is calculated using 1-second bins in cleaned event files. If a bin has >2000 counts, and if more than 50% of those come from <1% of pixels, then it is considered to be noise-dominated and hence unusable.
| Quadrant | # 1 sec bins | Bins with >0 counts | Bins with >2000 counts | High rate bins dominated by noise | Noise dominated (total time) | Noise dominated (detector-on time) | Marked lightcurve |
|---|---|---|---|---|---|---|---|
| A | 2544 | 2544 | 0 | 0 | 0.00% | 0.00% | 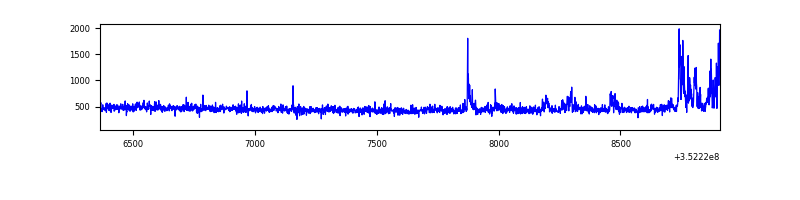 |
| B | 2545 | 2545 | 3 | 3 | 0.12% | 0.12% | 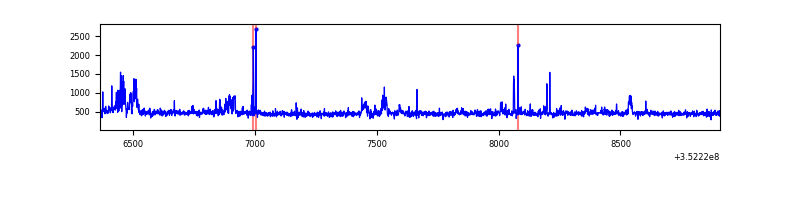 |
| C | 2545 | 2545 | 47 | 47 | 1.85% | 1.85% | 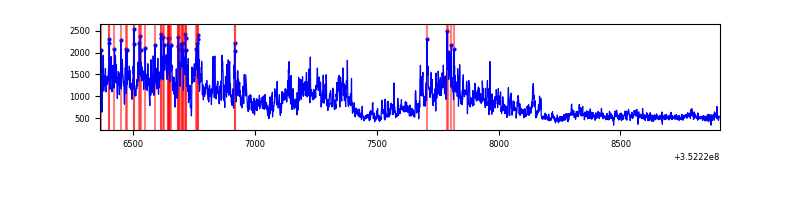 |
| D | 2544 | 2544 | 225 | 225 | 8.84% | 8.84% | 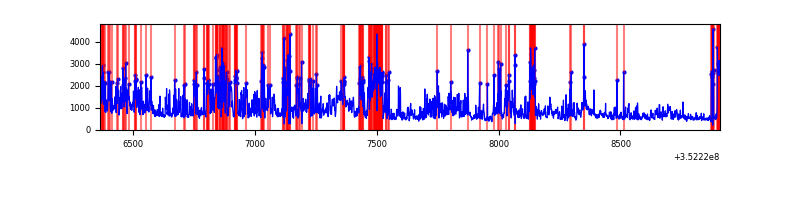 |
Top three noisy pixels from each quadrant. If the there are fewer than three noisy pixels in the level2.evt file, extra rows are filled as -1
| Pixel properties | Quadrant properties | ||||||
|---|---|---|---|---|---|---|---|
| Quadrant | DetID | PixID | Counts | Sigma | Mean | Median | Sigma |
| A | 14 | 235 | 99595 | 1664.26 | 287 | 281 | 59.7 |
| A | 1 | 113 | 7187 | 115.73 | 287 | 281 | 59.7 |
| A | 13 | 254 | 5669 | 90.29 | 287 | 281 | 59.7 |
| B | 0 | 190 | 75968 | 1343.08 | 286 | 279 | 56.4 |
| B | 3 | 209 | 40762 | 718.36 | 286 | 279 | 56.4 |
| B | 5 | 255 | 8370 | 143.57 | 286 | 279 | 56.4 |
| C | 3 | 233 | 1260152 | 19888.69 | 268 | 269 | 63.3 |
| C | 14 | 238 | 43470 | 681.98 | 268 | 269 | 63.3 |
| C | 2 | 114 | 6239 | 94.24 | 268 | 269 | 63.3 |
| D | 1 | 52 | 709828 | 10905.38 | 264 | 257 | 65.1 |
| D | 8 | 195 | 482037 | 7404.46 | 264 | 257 | 65.1 |
| D | 2 | 250 | 317641 | 4877.87 | 264 | 257 | 65.1 |
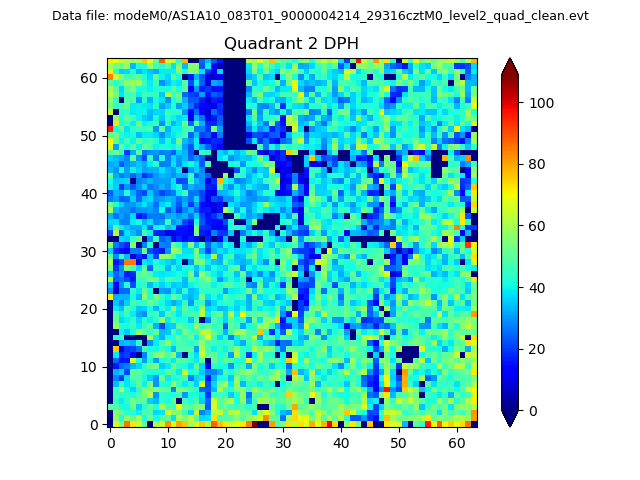
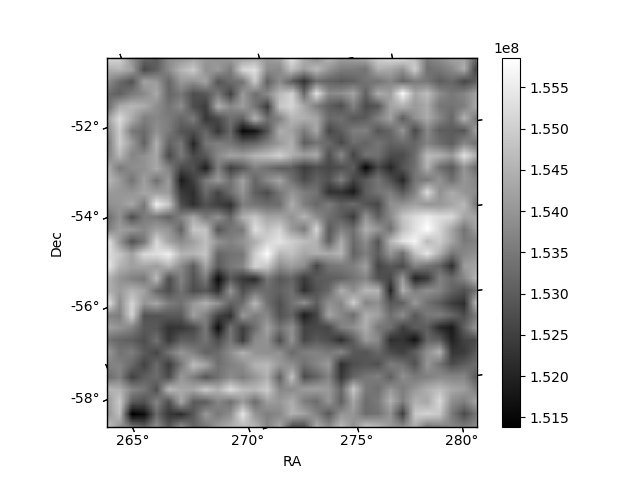
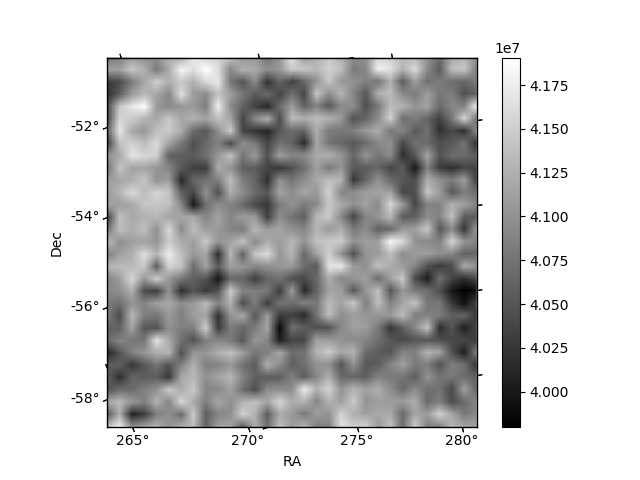
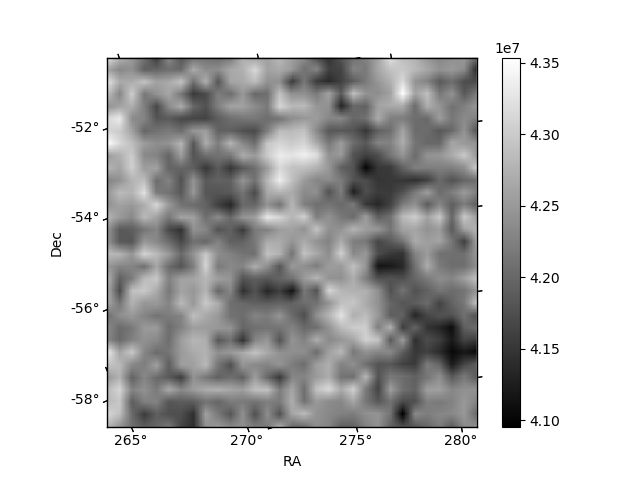
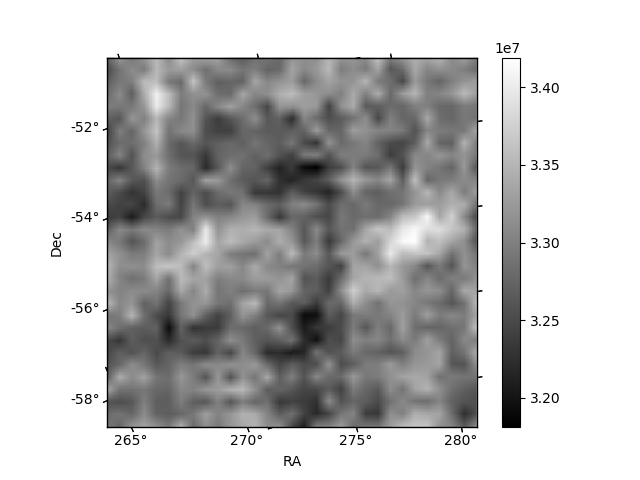
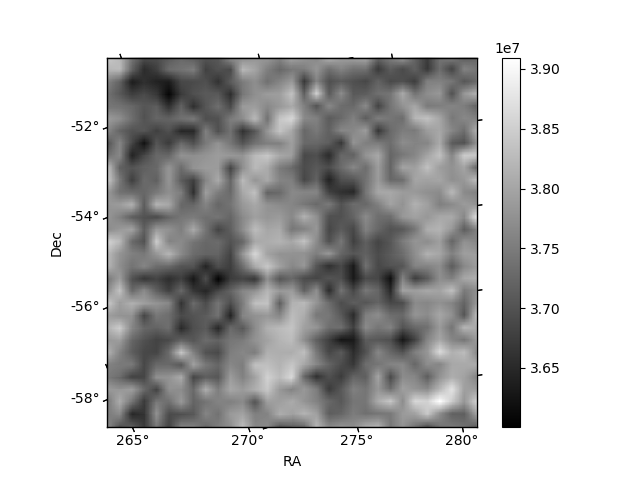
Histogram calculated using DETX and DETY for each event in the final _common_clean file
| Quadrant A | 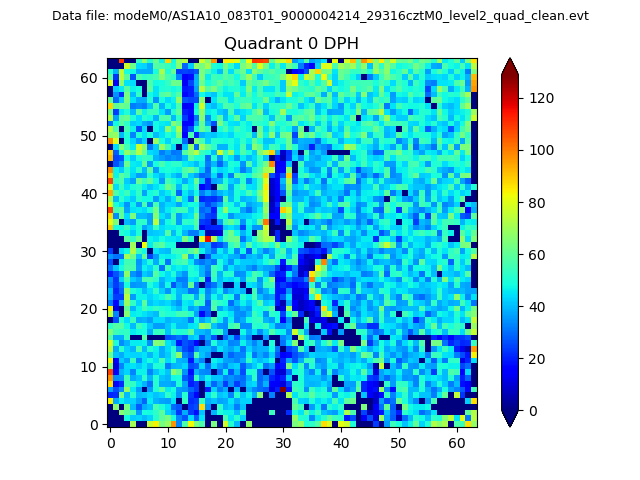 |
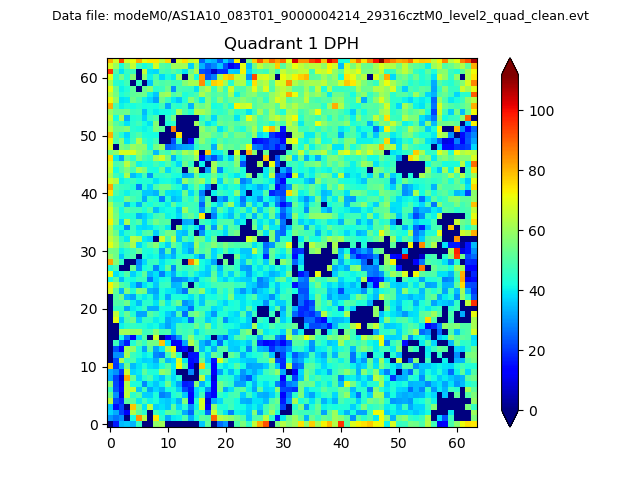 |
Quadrant B |
|---|---|---|---|
| Quadrant D | 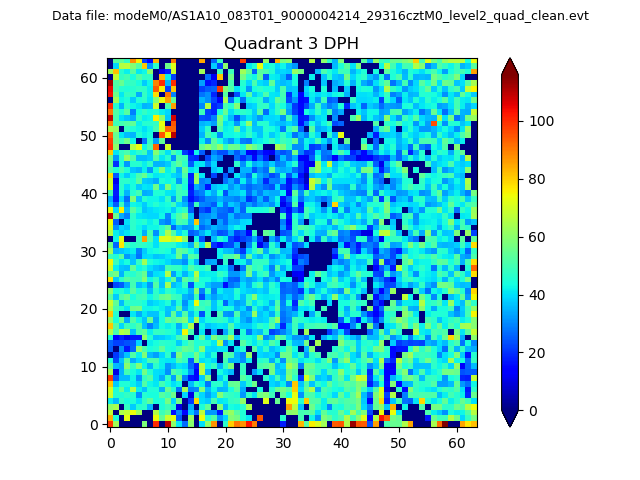 |
 |
Quadrant C |
| Plot type | Count rate plots | Images |
|---|---|---|
| Comparison with Poisson distribution Blue bars denote a histogram of data divided into 1 sec bins. Red curve is a Poisson curve with rate = median count rate of data. |
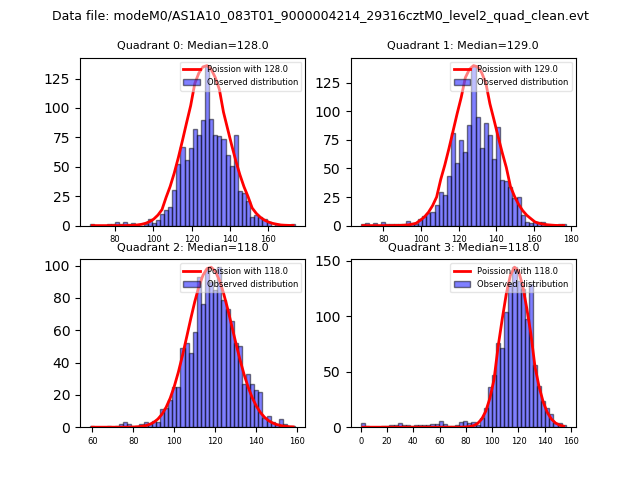 |
 |
| Quadrant-wise count rates Data is divided into 100 sec bins |
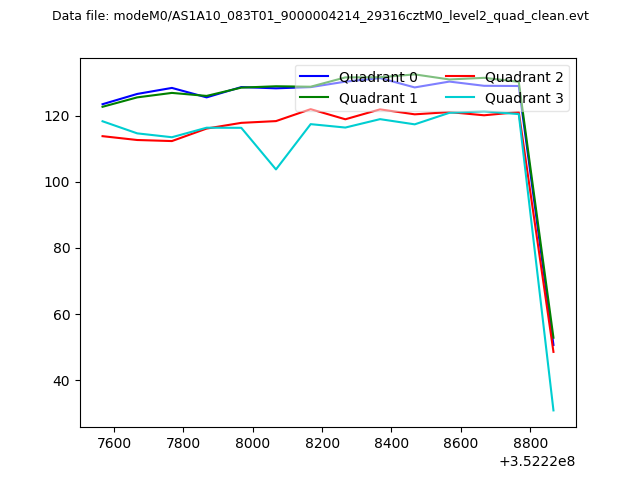 |
|
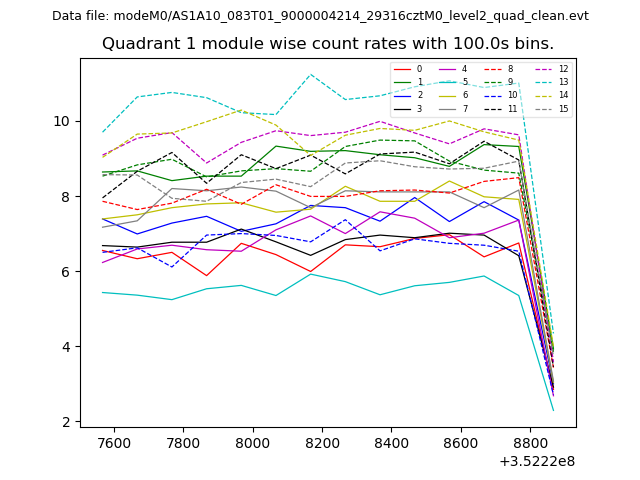
| Module-wise count rates for Quadrant A Data is divided into 100 sec bins |
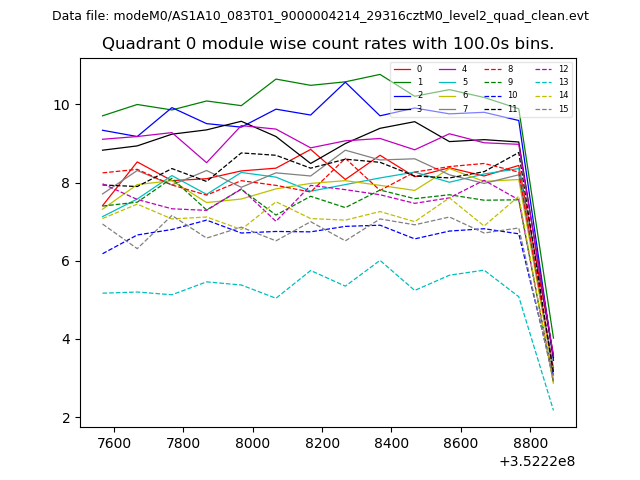 |
 |
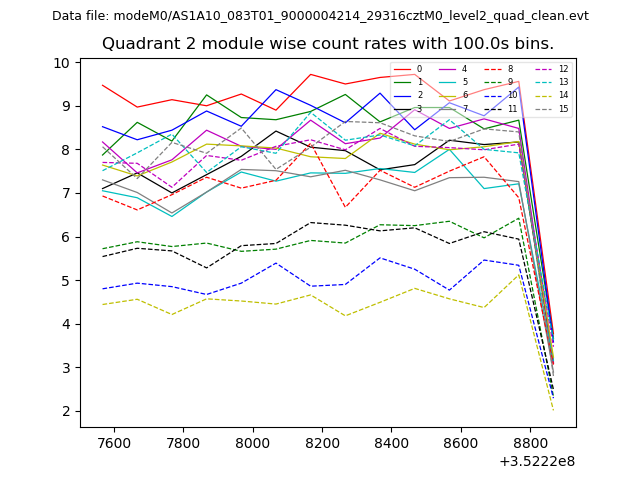
| Module-wise count rates for Quadrant B Data is divided into 100 sec bins |
 |
 |
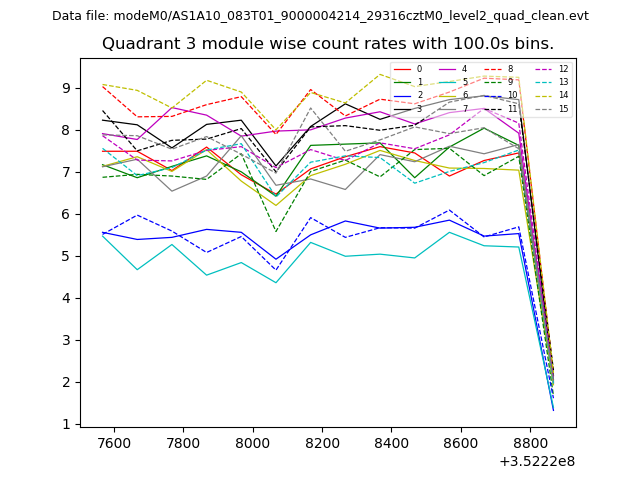
| Module-wise count rates for Quadrant C Data is divided into 100 sec bins |
 |
 |
| Module-wise count rates for Quadrant D Data is divided into 100 sec bins |
 |
 |
| Parameter | Plot |
|---|---|
| CZT HV Monitor | 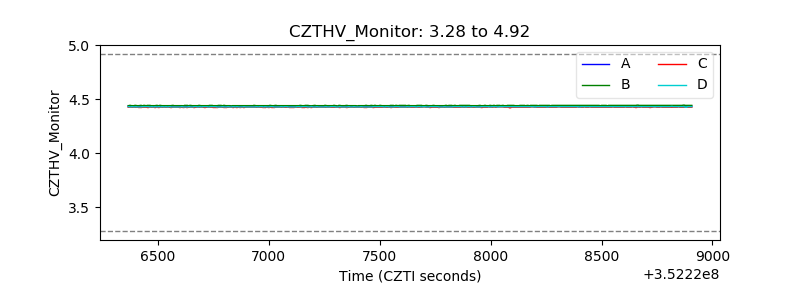 |
| D_VDD | 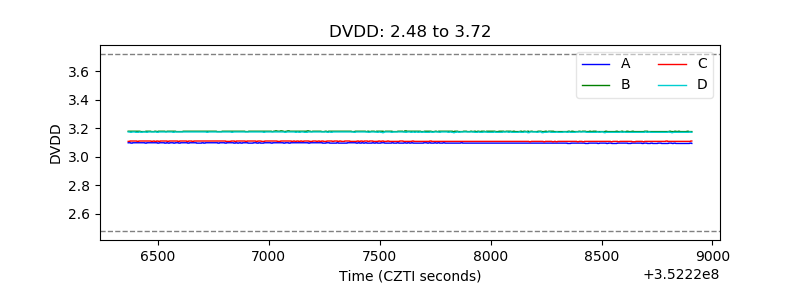 |
| Temperature 1 | 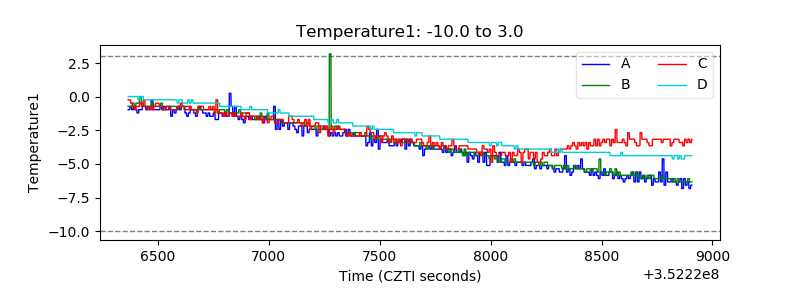 |
| Veto HV Monitor | 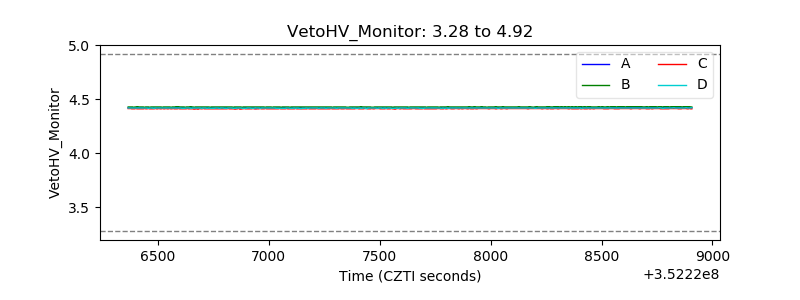 |
| Veto LLD | 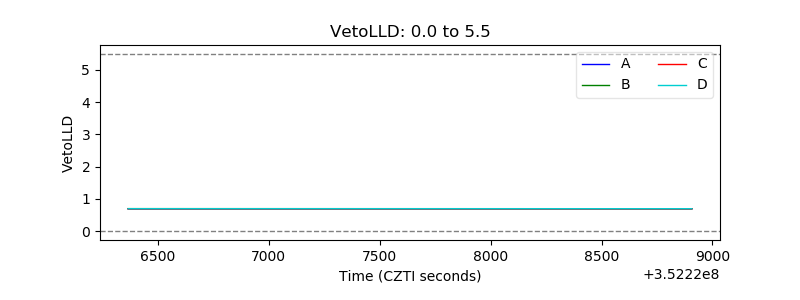 |
| Alpha Counter | 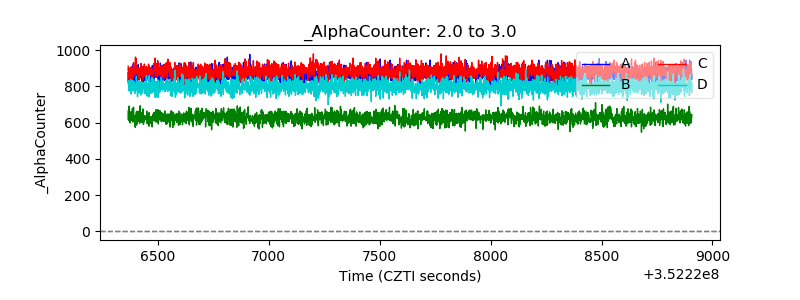 |
| _CPM_Rate | 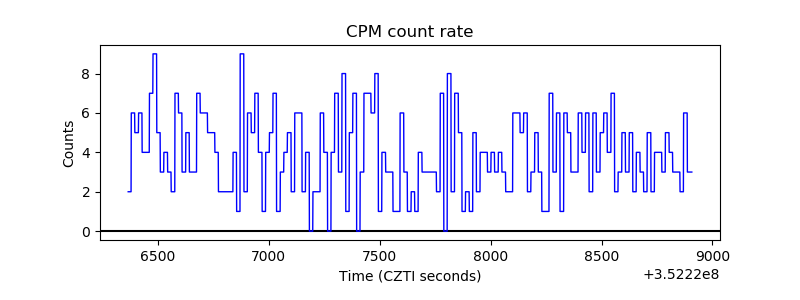 |
| CZT Counter | 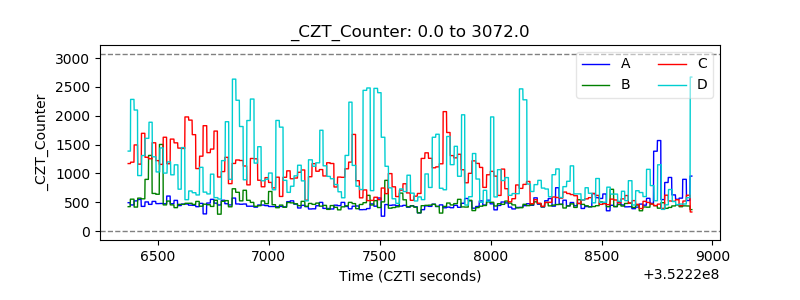 |
| +2.5 Volts monitor |  |
| +5 Volts monitor |  |
| _ROLL_ROT | 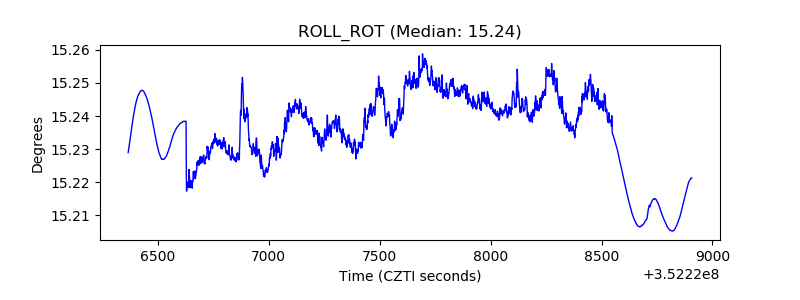 |
| _Roll_DEC | 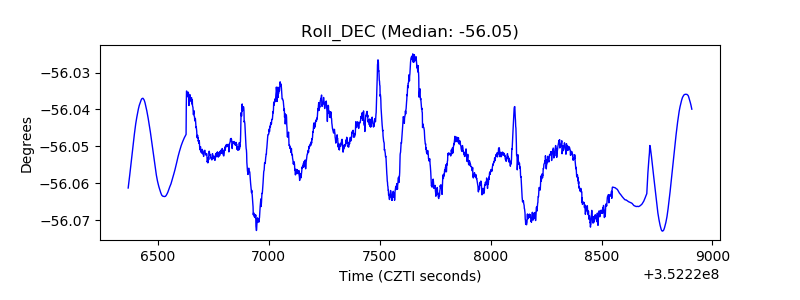 |
| _Roll_RA | 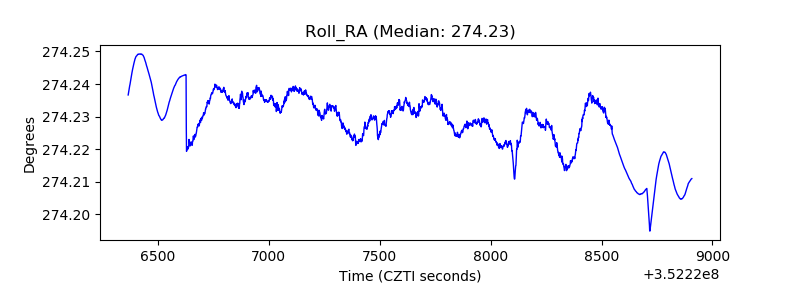 |
| Veto Counter |  |