| Param | Original file | Final file |
|---|---|---|
| Filename | modeM0/AS1T03_279T01_9000004218cztM0_level2.fits | modeM0/AS1T03_279T01_9000004218cztM0_level2_quad_clean.evt |
| Size (bytes) | 1,984,158,720 | 1,596,913,920 |
| Size | 1.8 GB | 1.5 GB |
| Events in quadrant A | 12,848,740 | 9,602,231 |
| Events in quadrant B | 12,157,666 | 9,592,819 |
| Events in quadrant C | 12,100,492 | 8,725,163 |
| Events in quadrant D | 8,956,238 | 6,448,518 |
| Mode SS | |||
|---|---|---|---|
| Quadrant | BADHDUFLAG | Total packets | Discarded packets |
| A | 0 | 4154 | 0 |
| B | 0 | 4154 | 0 |
| C | 0 | 4154 | 0 |
| D | 0 | 4154 | 0 |
| Mode M9 | |||
|---|---|---|---|
| Quadrant | BADHDUFLAG | Total packets | Discarded packets |
| A | 0 | 329 | 0 |
| B | 0 | 329 | 0 |
| C | 0 | 329 | 0 |
| D | 0 | 329 | 0 |
| Mode M0 | |||
|---|---|---|---|
| Quadrant | BADHDUFLAG | Total packets | Discarded packets |
| A | 0 | 440134 | 0 |
| B | 0 | 454184 | 0 |
| C | 0 | 579515 | 0 |
| D | 0 | 996439 | 0 |
| Quadrant | Total seconds | Saturated seconds | Saturation percentage |
|---|---|---|---|
| A | 204251 | 3548 | 1.737078% |
| B | 204251 | 4344 | 2.126795% |
| C | 204252 | 15455 | 7.566633% |
| D | 204252 | 68911 | 33.738225% |
Noise dominated data is calculated using 1-second bins in cleaned event files. If a bin has >2000 counts, and if more than 50% of those come from <1% of pixels, then it is considered to be noise-dominated and hence unusable.
| Quadrant | # 1 sec bins | Bins with >0 counts | Bins with >2000 counts | High rate bins dominated by noise | Noise dominated (total time) | Noise dominated (detector-on time) | Marked lightcurve |
|---|---|---|---|---|---|---|---|
| A | 242231 | 204253 | 0 | 0 | 0.00% | 0.00% |  |
| B | 242231 | 204241 | 0 | 0 | 0.00% | 0.00% |  |
| C | 242231 | 203919 | 0 | 0 | 0.00% | 0.00% |  |
| D | 242231 | 203224 | 0 | 0 | 0.00% | 0.00% |  |
Top three noisy pixels from each quadrant. If the there are fewer than three noisy pixels in the level2.evt file, extra rows are filled as -1
| Pixel properties | Quadrant properties | ||||||
|---|---|---|---|---|---|---|---|
| Quadrant | DetID | PixID | Counts | Sigma | Mean | Median | Sigma |
| A | 0 | 29 | 11001 | 9.75 | 3346 | 3153 | 805.3 |
| A | 7 | 110 | 10123 | 8.66 | 3346 | 3153 | 805.3 |
| A | 0 | 30 | 9689 | 8.12 | 3346 | 3153 | 805.3 |
| B | 2 | 9 | 9645 | 10.46 | 3224 | 3082 | 627.4 |
| B | 2 | 8 | 8123 | 8.03 | 3224 | 3082 | 627.4 |
| B | 3 | 17 | 8057 | 7.93 | 3224 | 3082 | 627.4 |
| C | 12 | 241 | 8341 | 6.6 | 3205 | 3016 | 806.2 |
| C | 3 | 187 | 8337 | 6.6 | 3205 | 3016 | 806.2 |
| C | 3 | 126 | 8251 | 6.49 | 3205 | 3016 | 806.2 |
| D | 15 | 46 | 6885 | 6.71 | 2563 | 2336 | 677.8 |
| D | 3 | 14 | 6327 | 5.89 | 2563 | 2336 | 677.8 |
| D | 10 | 189 | 6310 | 5.86 | 2563 | 2336 | 677.8 |
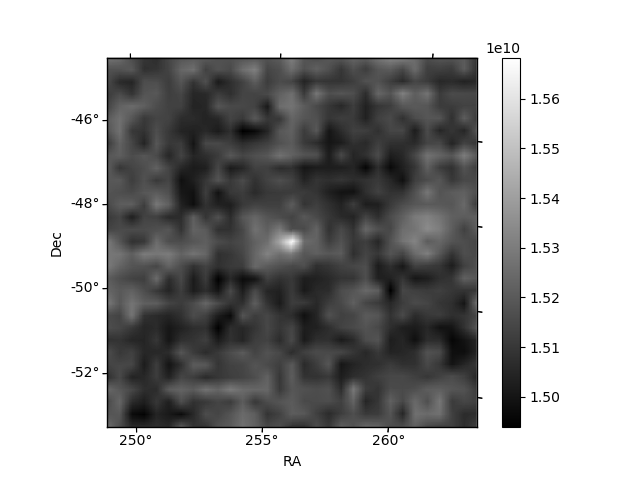
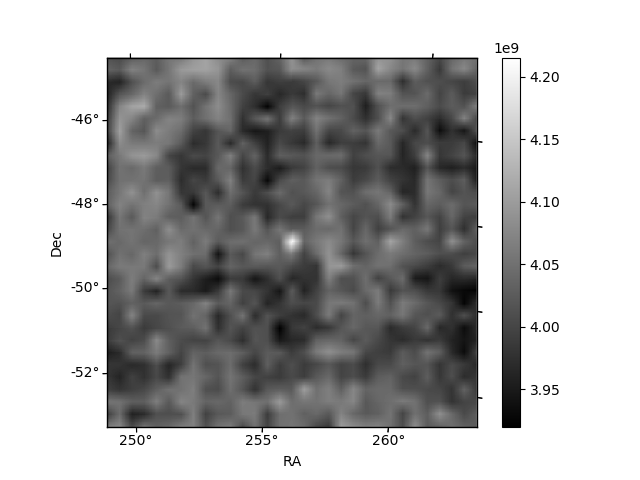
Histogram calculated using DETX and DETY for each event in the final _common_clean file
| Quadrant A |  |
 |
Quadrant B |
|---|---|---|---|
| Quadrant D |  |
 |
Quadrant C |
| Plot type | Count rate plots | Images |
|---|---|---|
| Comparison with Poisson distribution Blue bars denote a histogram of data divided into 1 sec bins. Red curve is a Poisson curve with rate = median count rate of data. |
 |
 |
| Quadrant-wise count rates Data is divided into 100 sec bins |
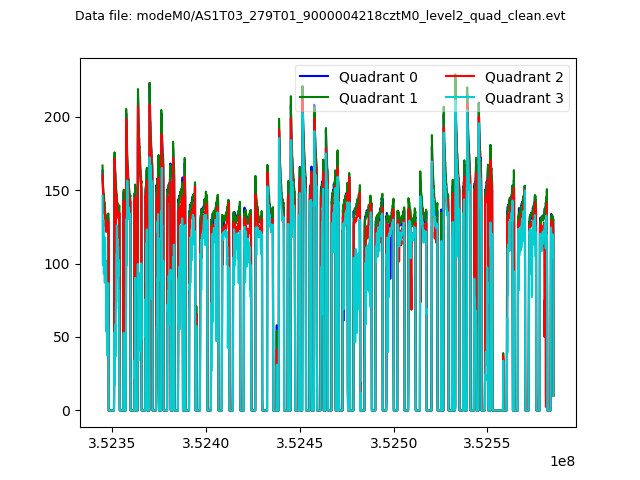 |
|
| Module-wise count rates for Quadrant A Data is divided into 100 sec bins |
 |
 |
| Module-wise count rates for Quadrant B Data is divided into 100 sec bins |
 |
 |
| Module-wise count rates for Quadrant C Data is divided into 100 sec bins |
 |
 |
| Module-wise count rates for Quadrant D Data is divided into 100 sec bins |
 |
 |
| Parameter | Plot |
|---|---|
| CZT HV Monitor |  |
| D_VDD |  |
| Temperature 1 |  |
| Veto HV Monitor |  |
| Veto LLD |  |
| Alpha Counter |  |
| _CPM_Rate | 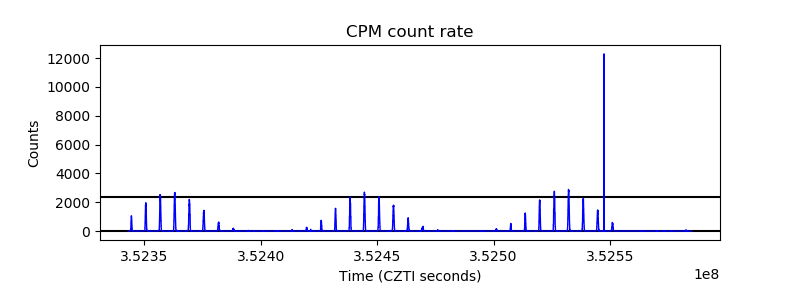 |
| CZT Counter |  |
| +2.5 Volts monitor |  |
| +5 Volts monitor |  |
| _ROLL_ROT |  |
| _Roll_DEC | 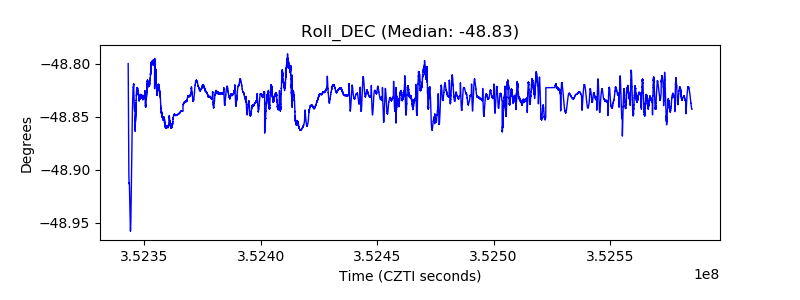 |
| _Roll_RA |  |
| Veto Counter |  |