| Param | Original file | Final file |
|---|---|---|
| Filename | modeM0/AS1T03_279T01_9000004218_29335cztM0_level2.evt | modeM0/AS1T03_279T01_9000004218_29335cztM0_level2_quad_clean.evt |
| Size (bytes) | 304,747,200 | 32,653,440 |
| Size | 290.6 MB | 31.1 MB |
| Events in quadrant A | 1,240,921 | 214,555 |
| Events in quadrant B | 1,347,080 | 218,431 |
| Events in quadrant C | 1,309,526 | 209,499 |
| Events in quadrant D | 5,166,118 | 171,621 |
| Mode SS | |||
|---|---|---|---|
| Quadrant | BADHDUFLAG | Total packets | Discarded packets |
| A | 0 | 50 | 0 |
| B | 0 | 50 | 0 |
| C | 0 | 50 | 0 |
| D | 0 | 50 | 0 |
| Mode M9 | |||
|---|---|---|---|
| Quadrant | BADHDUFLAG | Total packets | Discarded packets |
| A | 0 | 9 | 0 |
| B | 0 | 9 | 0 |
| C | 0 | 9 | 0 |
| D | 0 | 9 | 0 |
| Mode M0 | |||
|---|---|---|---|
| Quadrant | BADHDUFLAG | Total packets | Discarded packets |
| A | 0 | 5059 | 1 |
| B | 0 | 5400 | 1 |
| C | 0 | 5221 | 1 |
| D | 0 | 16995 | 1 |
| Quadrant | Total seconds | Saturated seconds | Saturation percentage |
|---|---|---|---|
| A | 2419 | 10 | 0.413394% |
| B | 2419 | 41 | 1.694915% |
| C | 2419 | 43 | 1.777594% |
| D | 2419 | 1517 | 62.711864% |
Noise dominated data is calculated using 1-second bins in cleaned event files. If a bin has >2000 counts, and if more than 50% of those come from <1% of pixels, then it is considered to be noise-dominated and hence unusable.
| Quadrant | # 1 sec bins | Bins with >0 counts | Bins with >2000 counts | High rate bins dominated by noise | Noise dominated (total time) | Noise dominated (detector-on time) | Marked lightcurve |
|---|---|---|---|---|---|---|---|
| A | 3304 | 2420 | 0 | 0 | 0.00% | 0.00% | 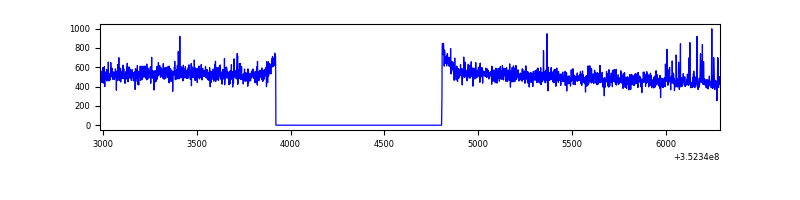 |
| B | 3304 | 2420 | 9 | 9 | 0.27% | 0.37% | 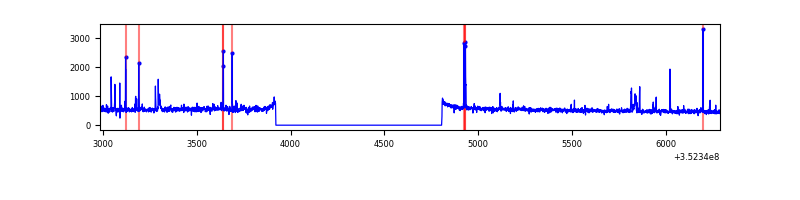 |
| C | 3304 | 2420 | 1 | 1 | 0.03% | 0.04% | 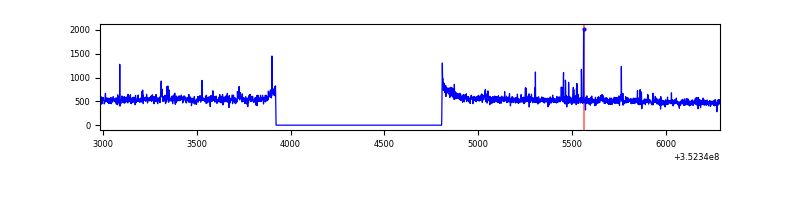 |
| D | 3304 | 2419 | 1483 | 1483 | 44.88% | 61.31% | 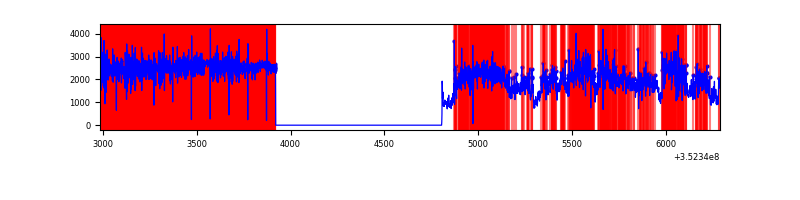 |
Top three noisy pixels from each quadrant. If the there are fewer than three noisy pixels in the level2.evt file, extra rows are filled as -1
| Pixel properties | Quadrant properties | ||||||
|---|---|---|---|---|---|---|---|
| Quadrant | DetID | PixID | Counts | Sigma | Mean | Median | Sigma |
| A | 1 | 113 | 10643 | 157.17 | 318 | 311 | 65.7 |
| A | 13 | 254 | 5605 | 80.53 | 318 | 311 | 65.7 |
| A | 3 | 137 | 3103 | 42.47 | 318 | 311 | 65.7 |
| B | 10 | 245 | 44926 | 716.18 | 319 | 311 | 62.3 |
| B | 5 | 172 | 13953 | 218.99 | 319 | 311 | 62.3 |
| B | 4 | 171 | 10495 | 163.48 | 319 | 311 | 62.3 |
| C | 14 | 238 | 49662 | 671.76 | 307 | 309 | 73.5 |
| C | 3 | 233 | 31715 | 427.48 | 307 | 309 | 73.5 |
| C | 4 | 175 | 10235 | 135.11 | 307 | 309 | 73.5 |
| D | 12 | 33 | 3364290 | 64501.82 | 208 | 202 | 52.2 |
| D | 1 | 52 | 480395 | 9207.05 | 208 | 202 | 52.2 |
| D | 7 | 80 | 446064 | 8548.8 | 208 | 202 | 52.2 |
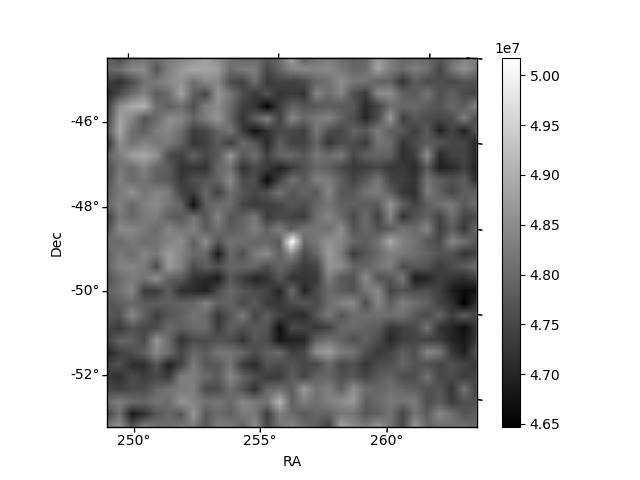
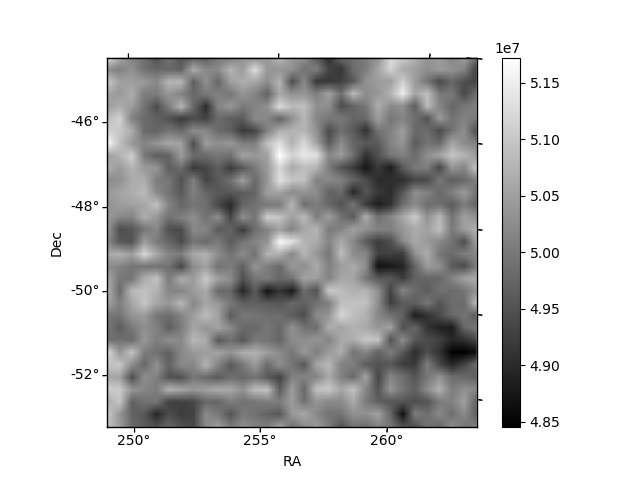
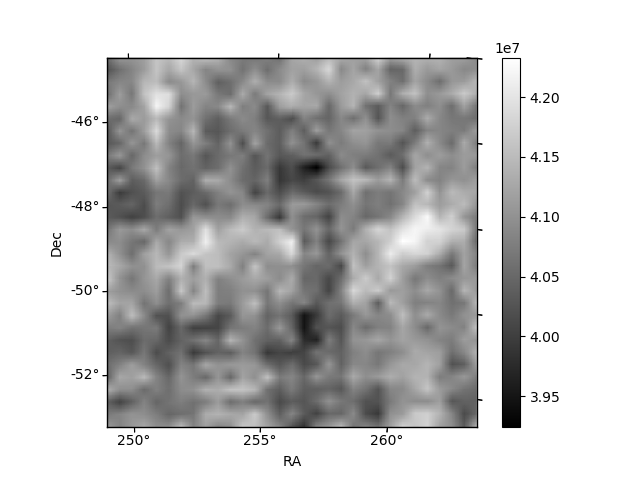
Histogram calculated using DETX and DETY for each event in the final _common_clean file
| Quadrant A | 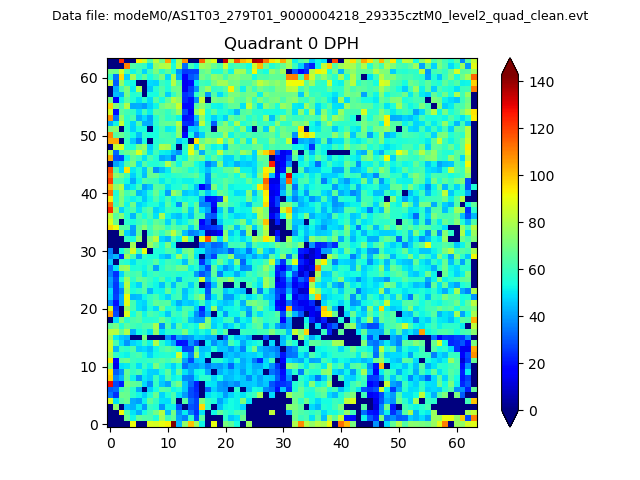 |
 |
Quadrant B |
|---|---|---|---|
| Quadrant D | 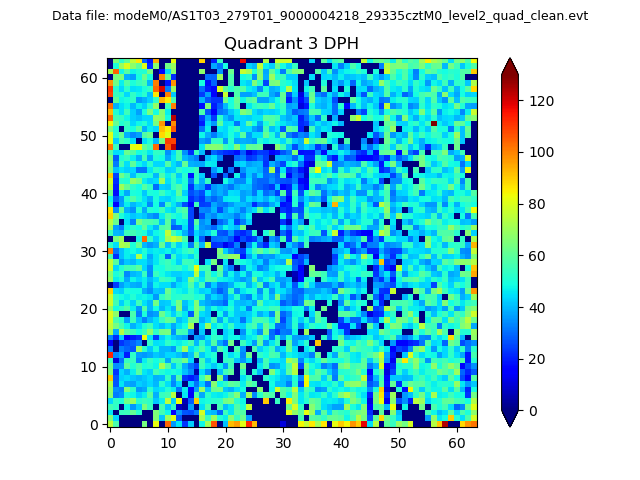 |
 |
Quadrant C |
| Plot type | Count rate plots | Images |
|---|---|---|
| Comparison with Poisson distribution Blue bars denote a histogram of data divided into 1 sec bins. Red curve is a Poisson curve with rate = median count rate of data. |
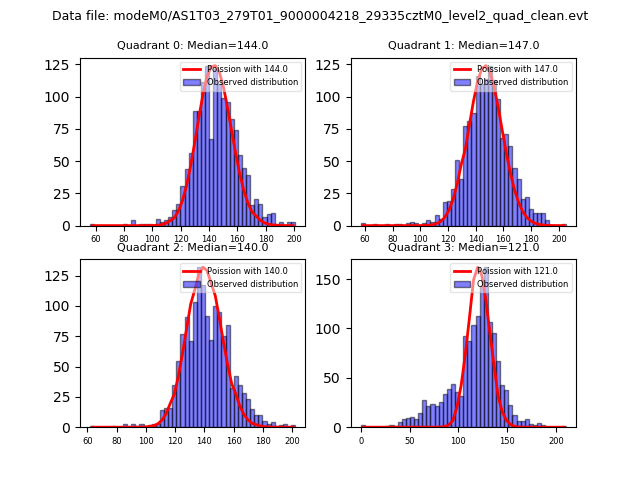 |
 |
| Quadrant-wise count rates Data is divided into 100 sec bins |
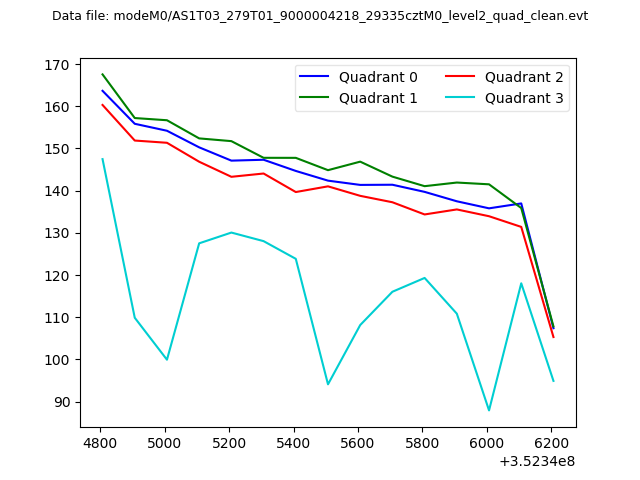 |
|
| Module-wise count rates for Quadrant A Data is divided into 100 sec bins |
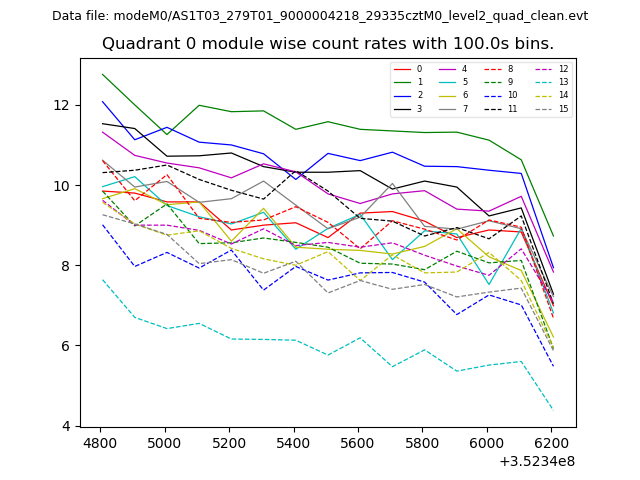 |
 |
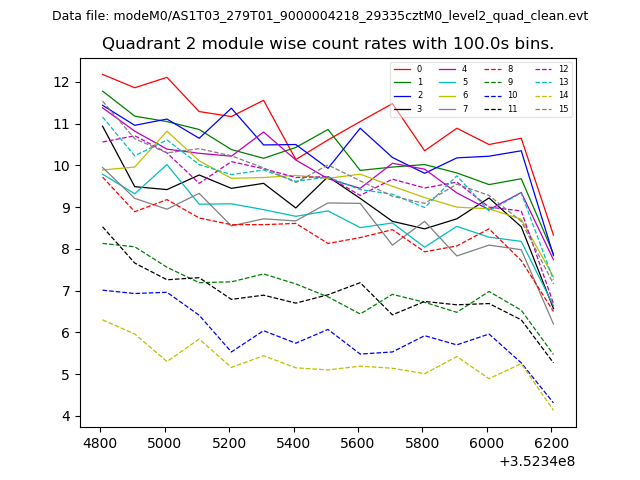
| Module-wise count rates for Quadrant B Data is divided into 100 sec bins |
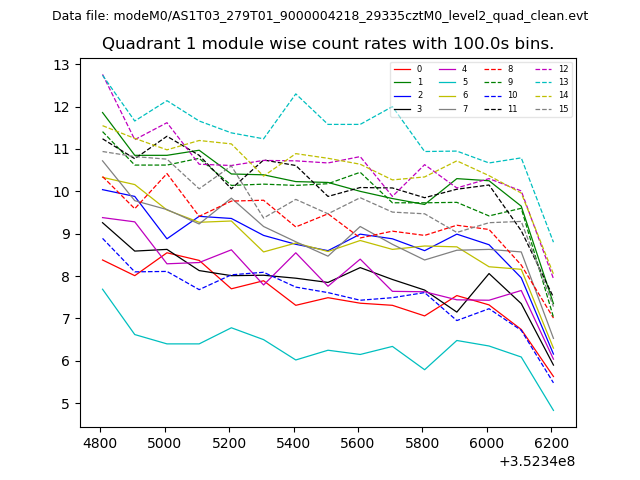 |
 |
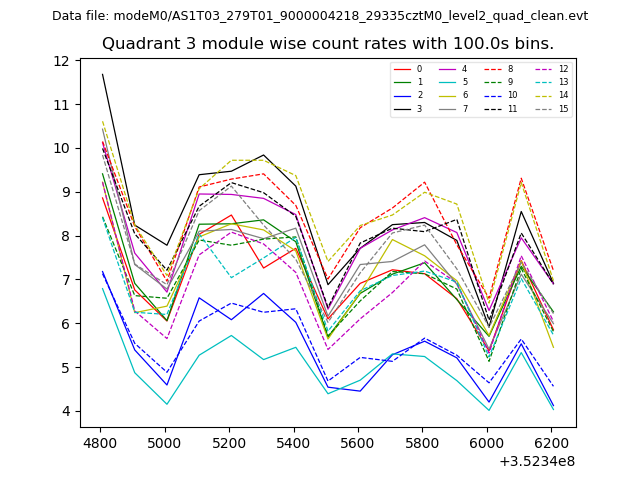
| Module-wise count rates for Quadrant C Data is divided into 100 sec bins |
 |
 |
| Module-wise count rates for Quadrant D Data is divided into 100 sec bins |
 |
 |
| Parameter | Plot |
|---|---|
| CZT HV Monitor | 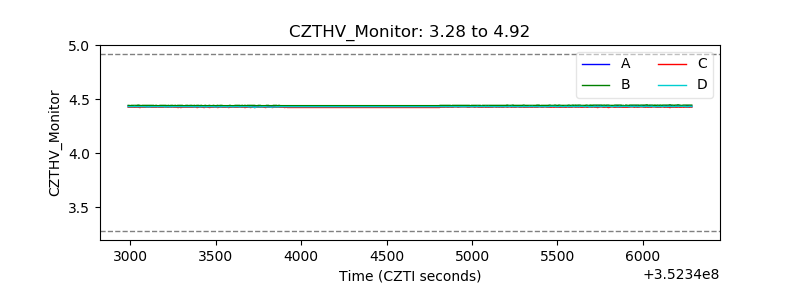 |
| D_VDD | 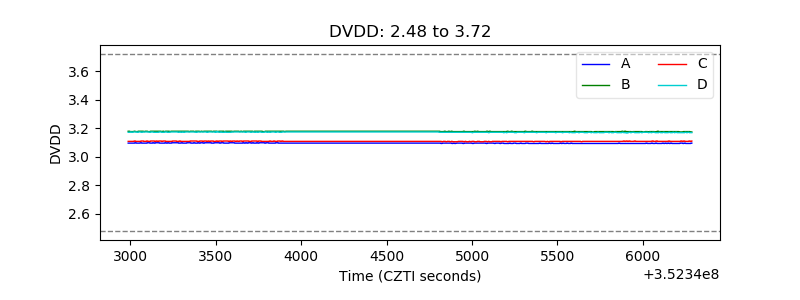 |
| Temperature 1 |  |
| Veto HV Monitor | 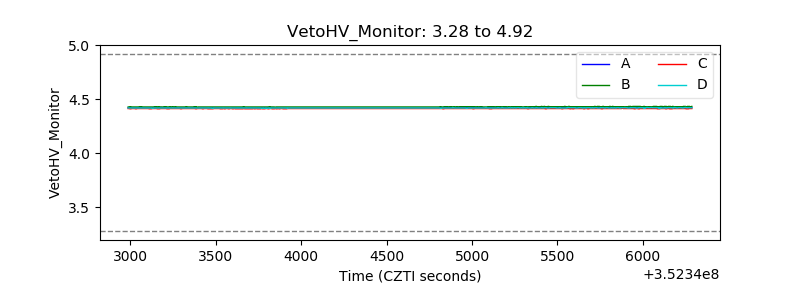 |
| Veto LLD | 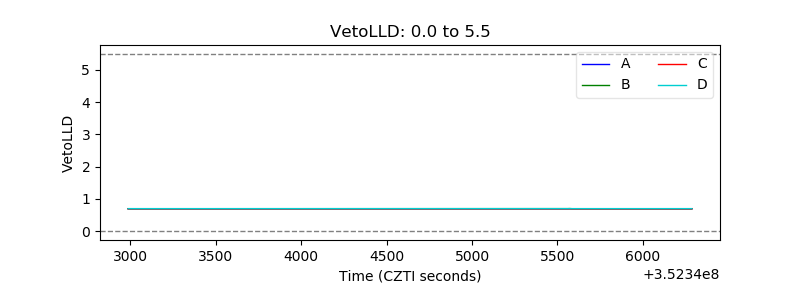 |
| Alpha Counter | 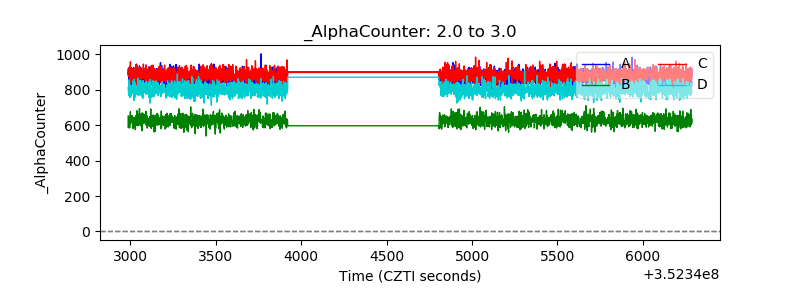 |
| _CPM_Rate | 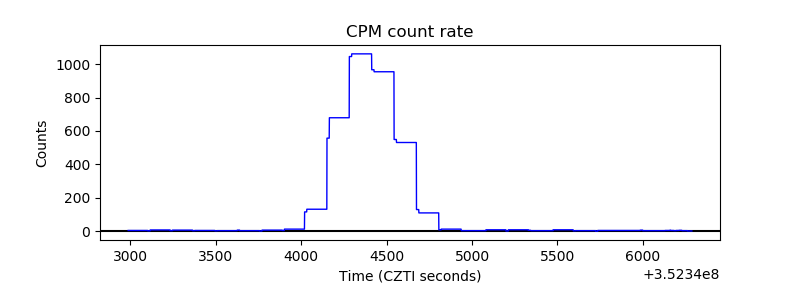 |
| CZT Counter |  |
| +2.5 Volts monitor |  |
| +5 Volts monitor | 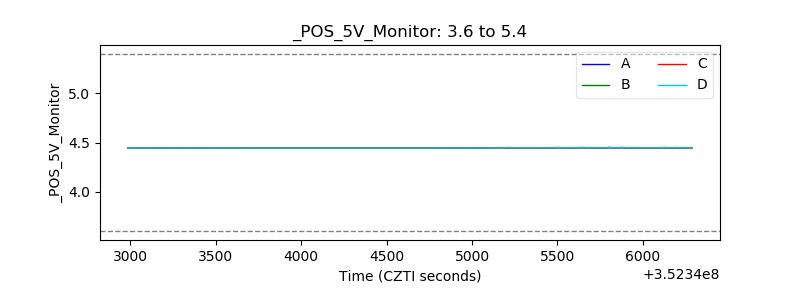 |
| _ROLL_ROT | 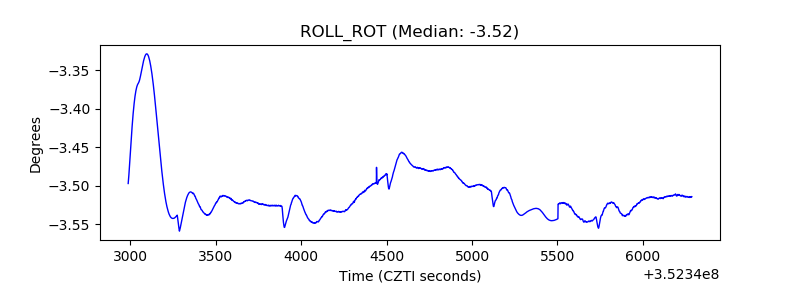 |
| _Roll_DEC | 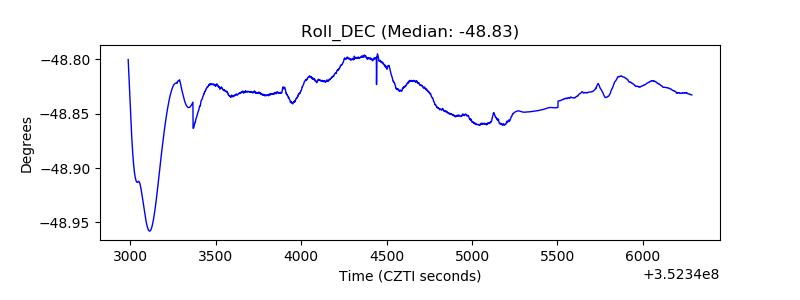 |
| _Roll_RA | 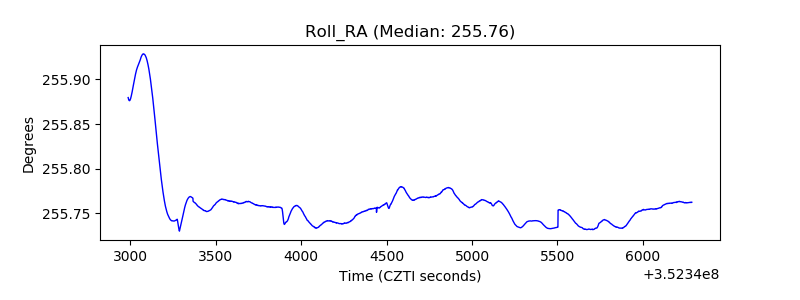 |
| Veto Counter | 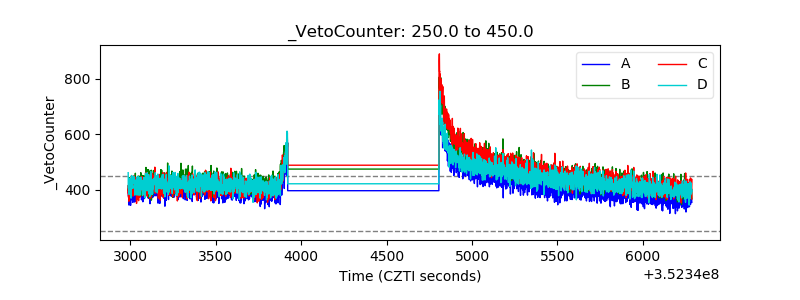 |