| Param | Original file | Final file |
|---|---|---|
| Filename | modeM0/AS1T03_279T01_9000004218_29336cztM0_level2.evt | modeM0/AS1T03_279T01_9000004218_29336cztM0_level2_quad_clean.evt |
| Size (bytes) | 821,868,480 | 88,562,880 |
| Size | 783.8 MB | 84.5 MB |
| Events in quadrant A | 3,098,925 | 629,135 |
| Events in quadrant B | 3,260,488 | 640,421 |
| Events in quadrant C | 3,395,374 | 609,627 |
| Events in quadrant D | 14,702,629 | 354,925 |
| Mode SS | |||
|---|---|---|---|
| Quadrant | BADHDUFLAG | Total packets | Discarded packets |
| A | 0 | 128 | 0 |
| B | 0 | 128 | 0 |
| C | 0 | 128 | 0 |
| D | 0 | 128 | 0 |
| Mode M9 | |||
|---|---|---|---|
| Quadrant | BADHDUFLAG | Total packets | Discarded packets |
| A | 0 | 11 | 0 |
| B | 0 | 11 | 0 |
| C | 0 | 11 | 0 |
| D | 0 | 11 | 0 |
| Mode M0 | |||
|---|---|---|---|
| Quadrant | BADHDUFLAG | Total packets | Discarded packets |
| A | 0 | 13174 | 1 |
| B | 0 | 13612 | 1 |
| C | 0 | 14020 | 1 |
| D | 0 | 48000 | 1 |
| Quadrant | Total seconds | Saturated seconds | Saturation percentage |
|---|---|---|---|
| A | 6405 | 17 | 0.265418% |
| B | 6405 | 49 | 0.765027% |
| C | 6405 | 270 | 4.215457% |
| D | 6405 | 5055 | 78.922717% |
Noise dominated data is calculated using 1-second bins in cleaned event files. If a bin has >2000 counts, and if more than 50% of those come from <1% of pixels, then it is considered to be noise-dominated and hence unusable.
| Quadrant | # 1 sec bins | Bins with >0 counts | Bins with >2000 counts | High rate bins dominated by noise | Noise dominated (total time) | Noise dominated (detector-on time) | Marked lightcurve |
|---|---|---|---|---|---|---|---|
| A | 7445 | 6407 | 0 | 0 | 0.00% | 0.00% | 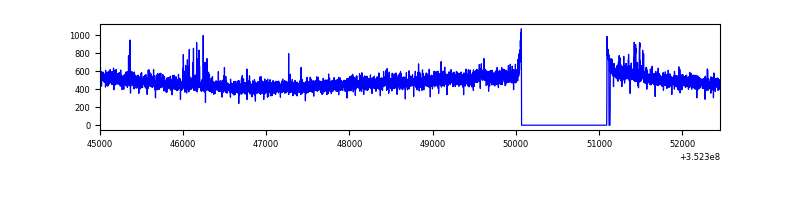 |
| B | 7445 | 6407 | 7 | 7 | 0.09% | 0.11% | 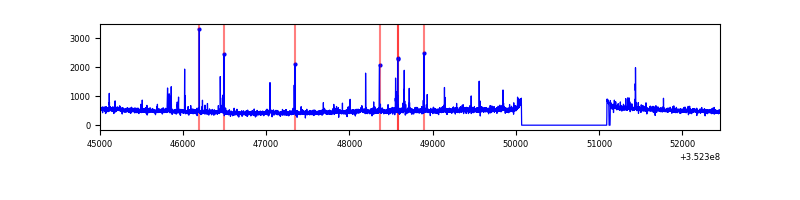 |
| C | 7445 | 6407 | 2 | 2 | 0.03% | 0.03% | 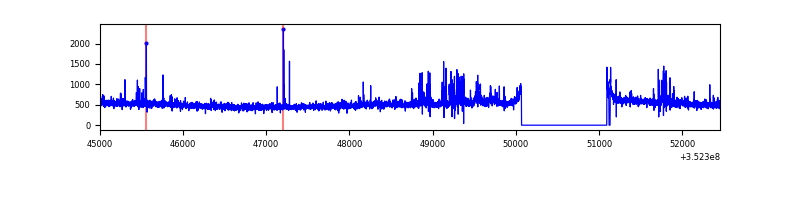 |
| D | 7445 | 6407 | 4597 | 4597 | 61.75% | 71.75% | 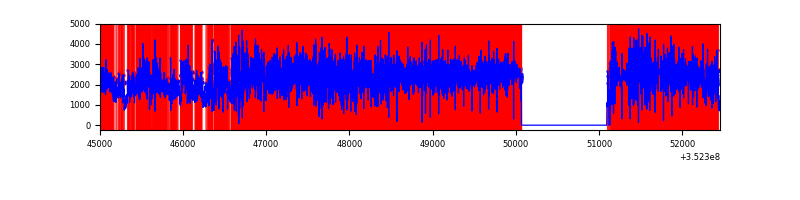 |
Top three noisy pixels from each quadrant. If the there are fewer than three noisy pixels in the level2.evt file, extra rows are filled as -1
| Pixel properties | Quadrant properties | ||||||
|---|---|---|---|---|---|---|---|
| Quadrant | DetID | PixID | Counts | Sigma | Mean | Median | Sigma |
| A | 1 | 113 | 20380 | 122.74 | 793 | 777 | 159.7 |
| A | 15 | 174 | 16677 | 99.55 | 793 | 777 | 159.7 |
| A | 13 | 254 | 13153 | 77.49 | 793 | 777 | 159.7 |
| B | 10 | 245 | 68380 | 449.73 | 795 | 776 | 150.3 |
| B | 5 | 172 | 30588 | 198.32 | 795 | 776 | 150.3 |
| B | 12 | 111 | 18025 | 114.75 | 795 | 776 | 150.3 |
| C | 14 | 238 | 177793 | 991.96 | 765 | 772 | 178.5 |
| C | 3 | 233 | 111214 | 618.87 | 765 | 772 | 178.5 |
| C | 14 | 254 | 79906 | 443.44 | 765 | 772 | 178.5 |
| D | 12 | 33 | 9888110 | 89536.97 | 460 | 448 | 110.4 |
| D | 1 | 52 | 1936412 | 17530.97 | 460 | 448 | 110.4 |
| D | 7 | 80 | 832069 | 7530.68 | 460 | 448 | 110.4 |
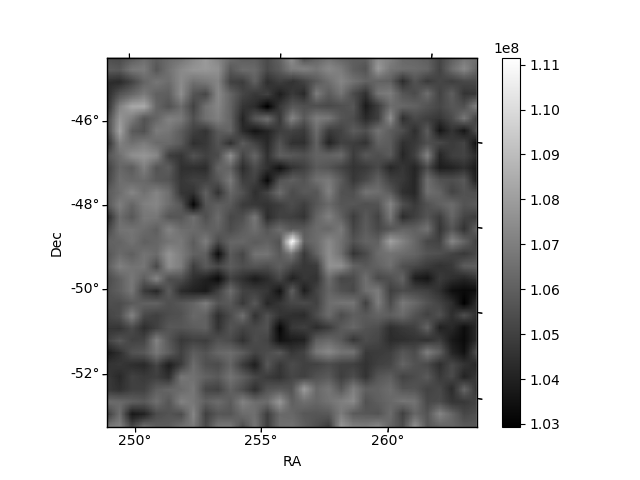
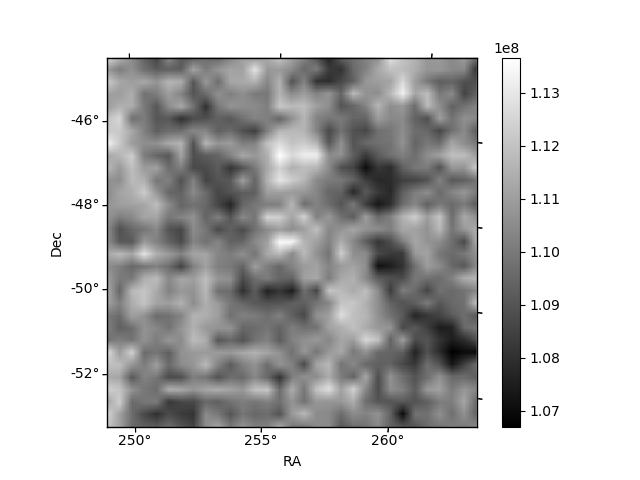
Histogram calculated using DETX and DETY for each event in the final _common_clean file
| Quadrant A | 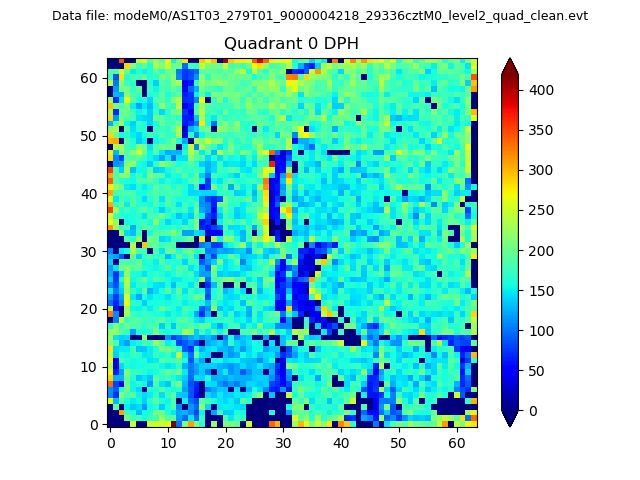 |
 |
Quadrant B |
|---|---|---|---|
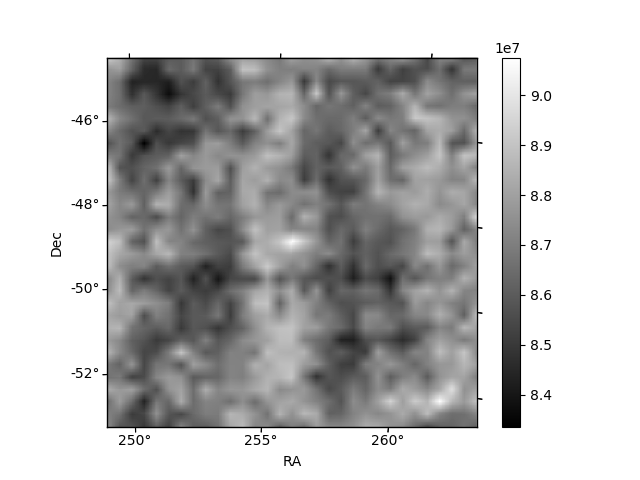
| Quadrant D | 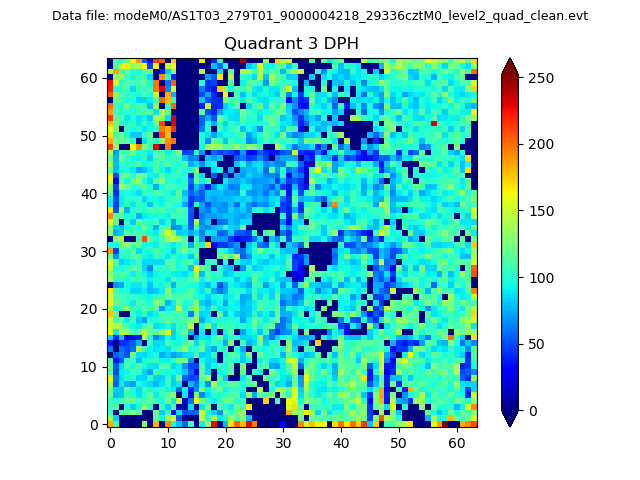 |
 |
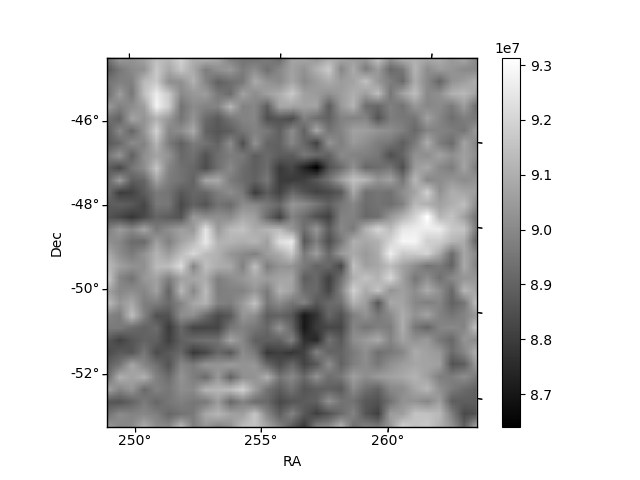
Quadrant C |
| Plot type | Count rate plots | Images |
|---|---|---|
| Comparison with Poisson distribution Blue bars denote a histogram of data divided into 1 sec bins. Red curve is a Poisson curve with rate = median count rate of data. |
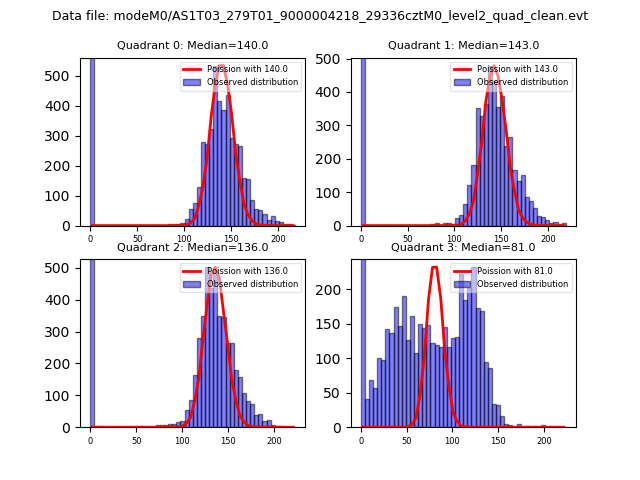 |
 |
| Quadrant-wise count rates Data is divided into 100 sec bins |
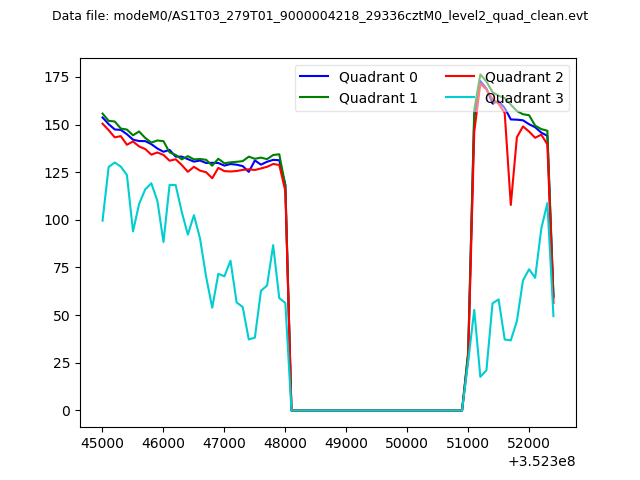 |
|
| Module-wise count rates for Quadrant A Data is divided into 100 sec bins |
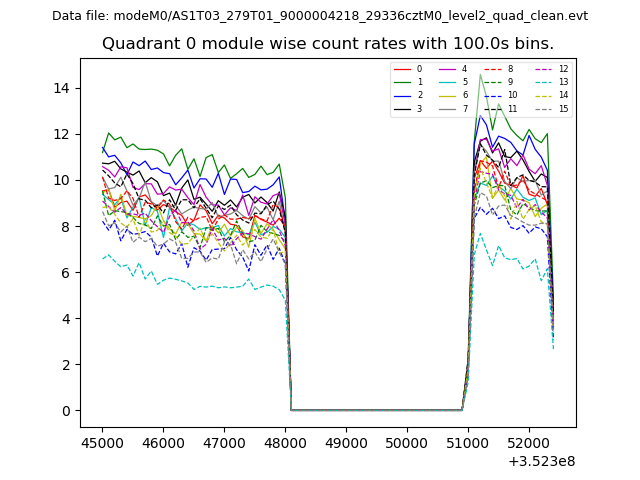 |
 |
| Module-wise count rates for Quadrant B Data is divided into 100 sec bins |
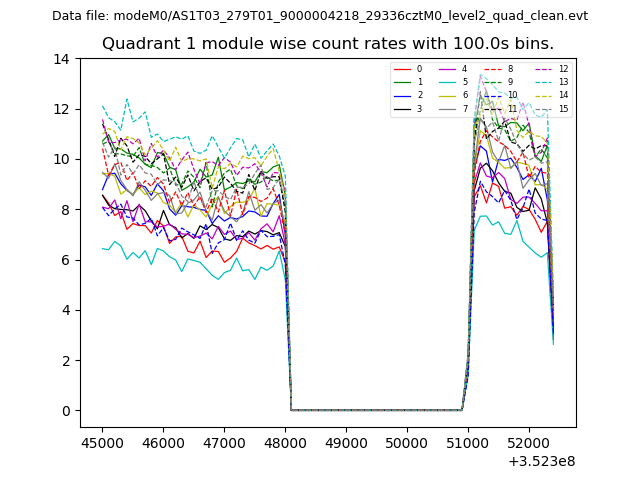 |
 |
| Module-wise count rates for Quadrant C Data is divided into 100 sec bins |
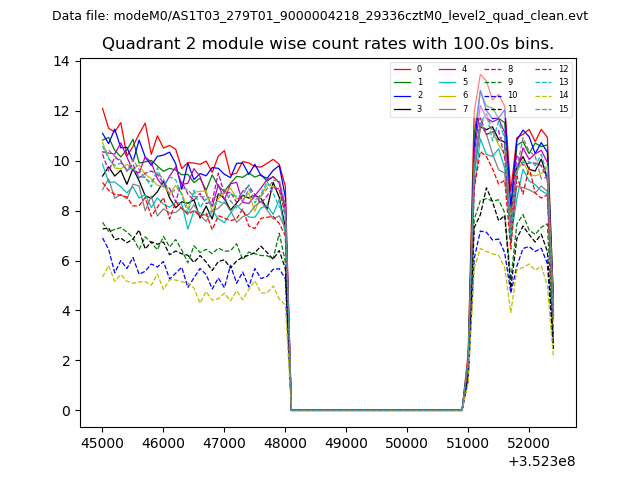 |
 |
| Module-wise count rates for Quadrant D Data is divided into 100 sec bins |
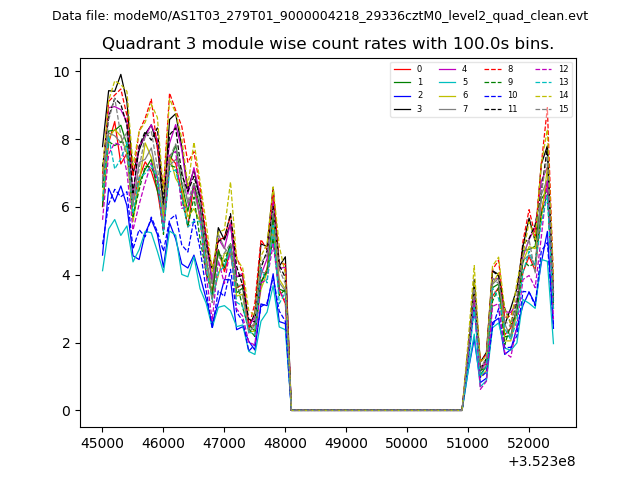 |
 |
| Parameter | Plot |
|---|---|
| CZT HV Monitor | 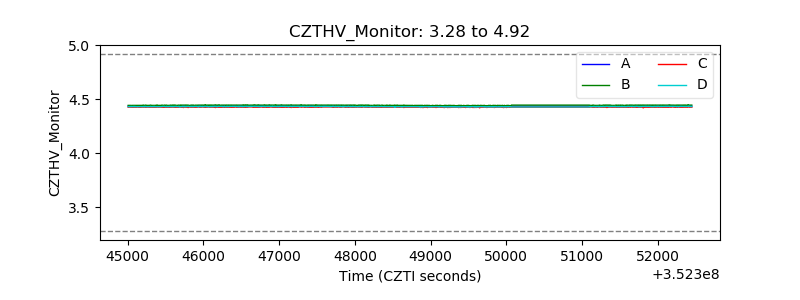 |
| D_VDD | 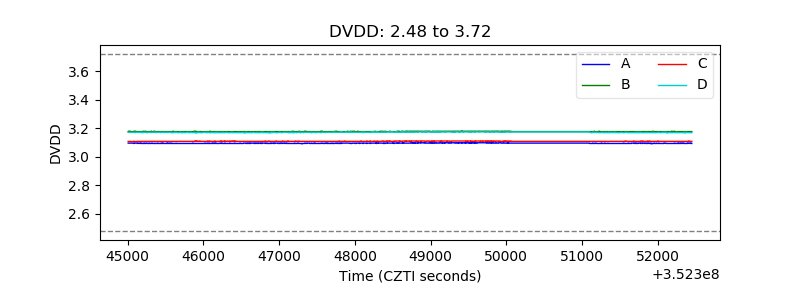 |
| Temperature 1 |  |
| Veto HV Monitor | 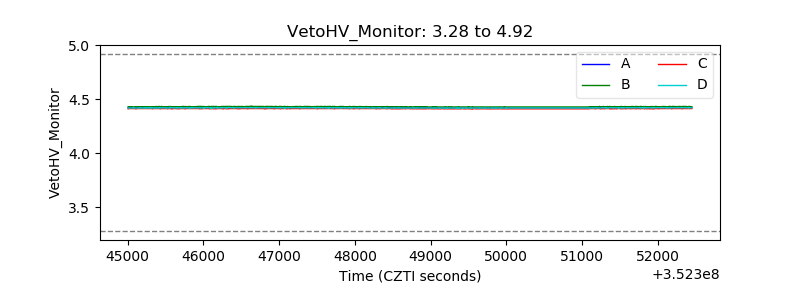 |
| Veto LLD | 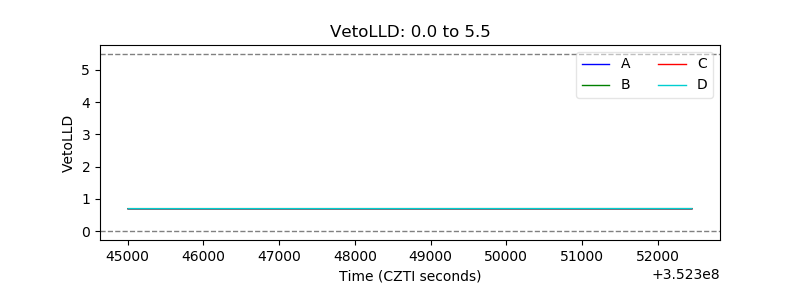 |
| Alpha Counter | 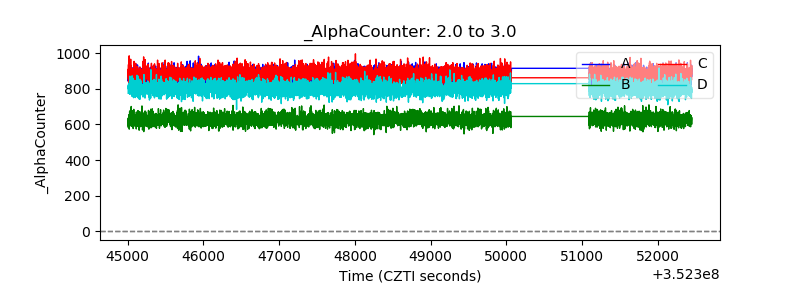 |
| _CPM_Rate | 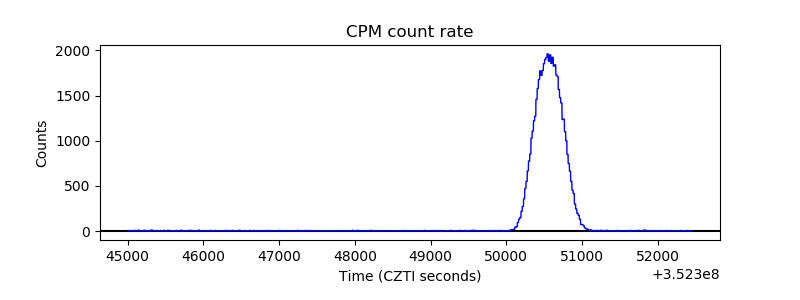 |
| CZT Counter |  |
| +2.5 Volts monitor |  |
| +5 Volts monitor | 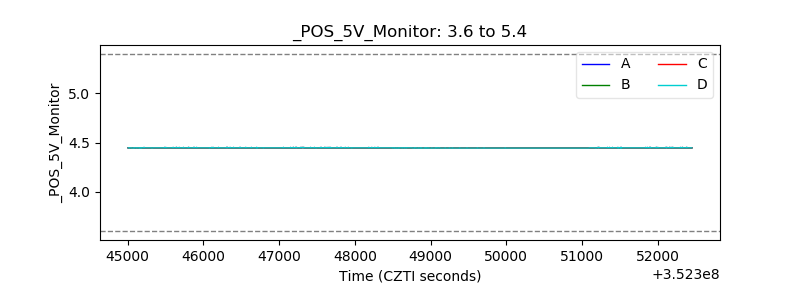 |
| _ROLL_ROT | 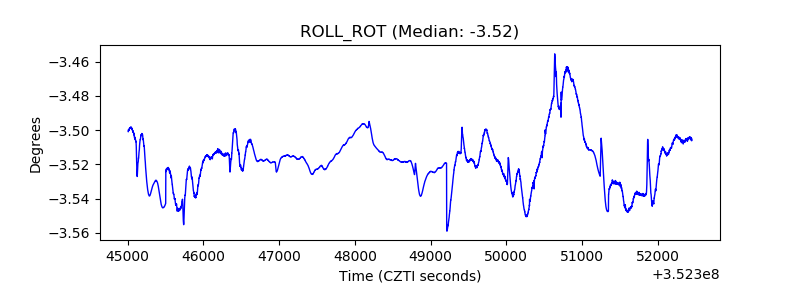 |
| _Roll_DEC | 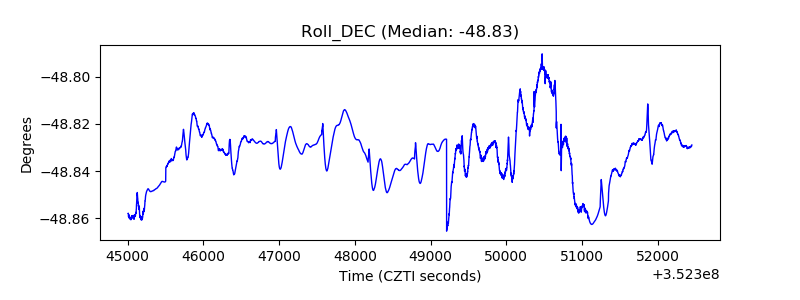 |
| _Roll_RA |  |
| Veto Counter | 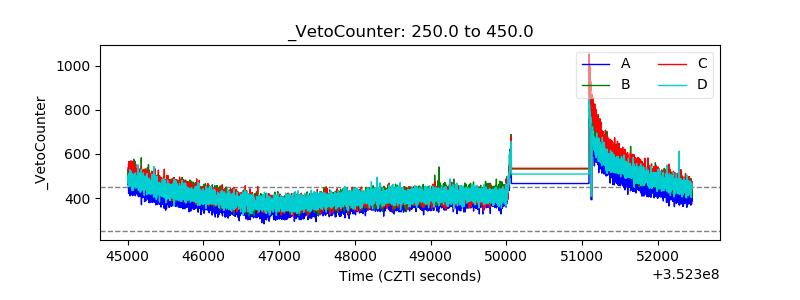 |