| Param | Original file | Final file |
|---|---|---|
| Filename | modeM0/AS1T03_279T01_9000004218_29340cztM0_level2.evt | modeM0/AS1T03_279T01_9000004218_29340cztM0_level2_quad_clean.evt |
| Size (bytes) | 731,545,920 | 87,592,320 |
| Size | 697.7 MB | 83.5 MB |
| Events in quadrant A | 3,115,068 | 637,267 |
| Events in quadrant B | 3,104,299 | 645,030 |
| Events in quadrant C | 3,300,321 | 615,618 |
| Events in quadrant D | 12,247,898 | 353,552 |
| Mode SS | |||
|---|---|---|---|
| Quadrant | BADHDUFLAG | Total packets | Discarded packets |
| A | 0 | 118 | 0 |
| B | 0 | 118 | 0 |
| C | 0 | 118 | 0 |
| D | 0 | 118 | 0 |
| Mode M9 | |||
|---|---|---|---|
| Quadrant | BADHDUFLAG | Total packets | Discarded packets |
| A | 0 | 13 | 0 |
| B | 0 | 13 | 0 |
| C | 0 | 13 | 0 |
| D | 0 | 13 | 0 |
| Mode M0 | |||
|---|---|---|---|
| Quadrant | BADHDUFLAG | Total packets | Discarded packets |
| A | 0 | 12513 | 1 |
| B | 0 | 12501 | 1 |
| C | 0 | 13388 | 1 |
| D | 0 | 40221 | 1 |
| Quadrant | Total seconds | Saturated seconds | Saturation percentage |
|---|---|---|---|
| A | 5713 | 57 | 0.997724% |
| B | 5714 | 51 | 0.892545% |
| C | 5714 | 112 | 1.960098% |
| D | 5714 | 4399 | 76.986349% |
Noise dominated data is calculated using 1-second bins in cleaned event files. If a bin has >2000 counts, and if more than 50% of those come from <1% of pixels, then it is considered to be noise-dominated and hence unusable.
| Quadrant | # 1 sec bins | Bins with >0 counts | Bins with >2000 counts | High rate bins dominated by noise | Noise dominated (total time) | Noise dominated (detector-on time) | Marked lightcurve |
|---|---|---|---|---|---|---|---|
| A | 7008 | 5715 | 10 | 10 | 0.14% | 0.17% | 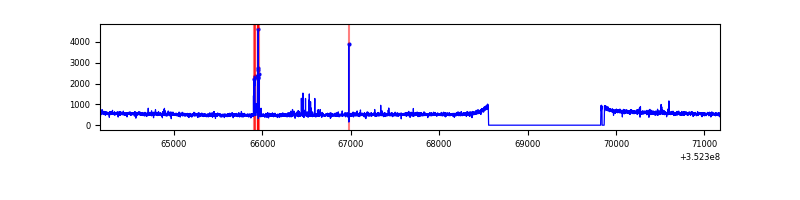 |
| B | 7009 | 5716 | 2 | 2 | 0.03% | 0.03% |  |
| C | 7009 | 5716 | 0 | 0 | 0.00% | 0.00% | 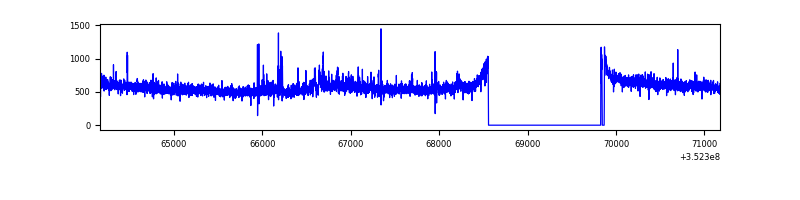 |
| D | 7009 | 5716 | 3623 | 3623 | 51.69% | 63.38% | 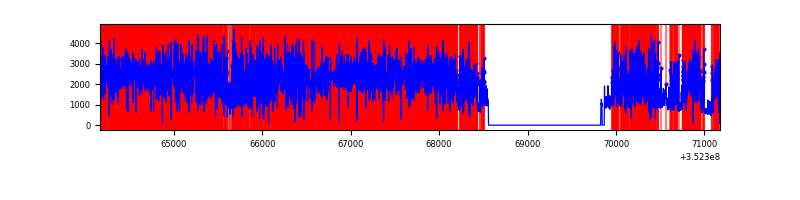 |
Top three noisy pixels from each quadrant. If the there are fewer than three noisy pixels in the level2.evt file, extra rows are filled as -1
| Pixel properties | Quadrant properties | ||||||
|---|---|---|---|---|---|---|---|
| Quadrant | DetID | PixID | Counts | Sigma | Mean | Median | Sigma |
| A | 15 | 174 | 45337 | 284.49 | 789 | 777 | 156.6 |
| A | 1 | 113 | 24334 | 150.4 | 789 | 777 | 156.6 |
| A | 13 | 254 | 11372 | 67.64 | 789 | 777 | 156.6 |
| B | 15 | 33 | 23897 | 162.87 | 774 | 759 | 142.1 |
| B | 10 | 245 | 21589 | 146.62 | 774 | 759 | 142.1 |
| B | 12 | 111 | 15831 | 106.09 | 774 | 759 | 142.1 |
| C | 3 | 233 | 159019 | 900.44 | 761 | 768 | 175.7 |
| C | 14 | 238 | 137762 | 779.49 | 761 | 768 | 175.7 |
| C | 14 | 254 | 20981 | 115.01 | 761 | 768 | 175.7 |
| D | 12 | 33 | 6758124 | 60959.12 | 468 | 456 | 110.9 |
| D | 13 | 104 | 2368187 | 21358.67 | 468 | 456 | 110.9 |
| D | 7 | 80 | 635223 | 5726.06 | 468 | 456 | 110.9 |
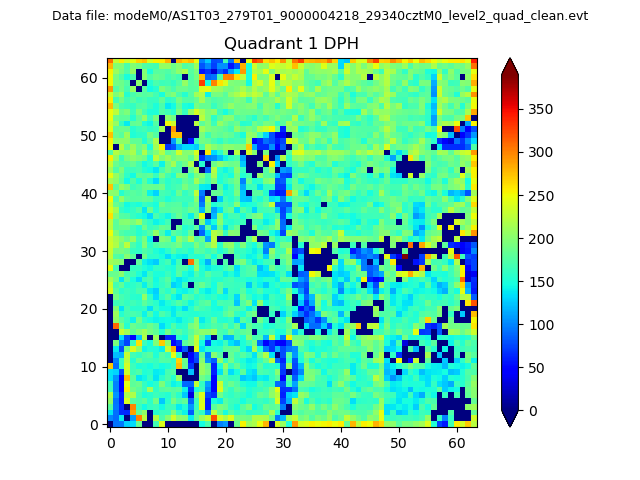
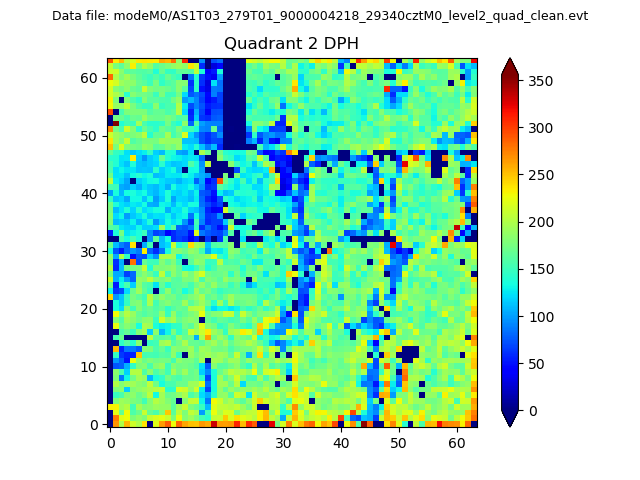
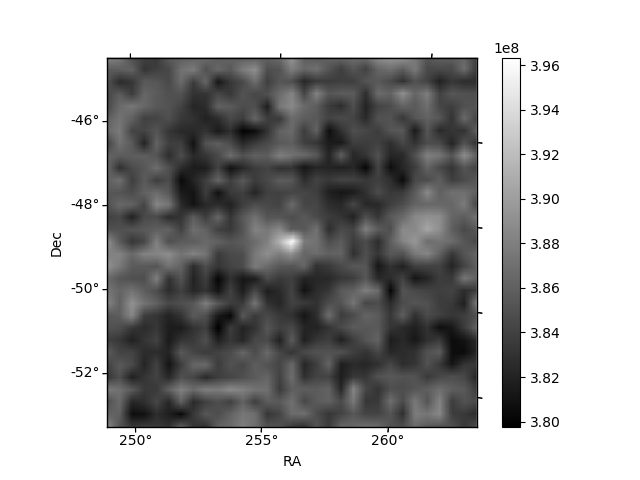
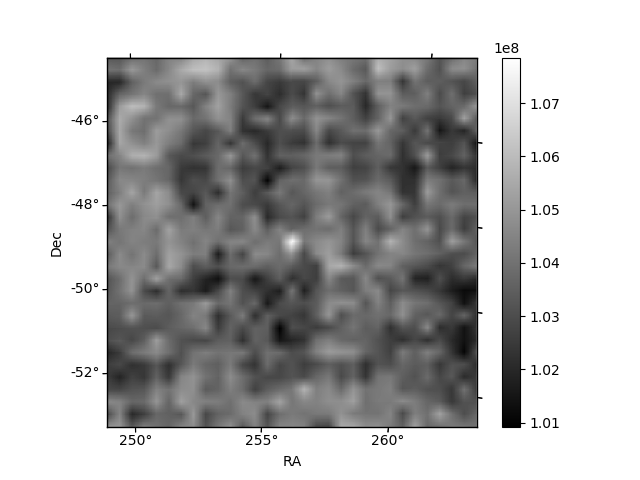
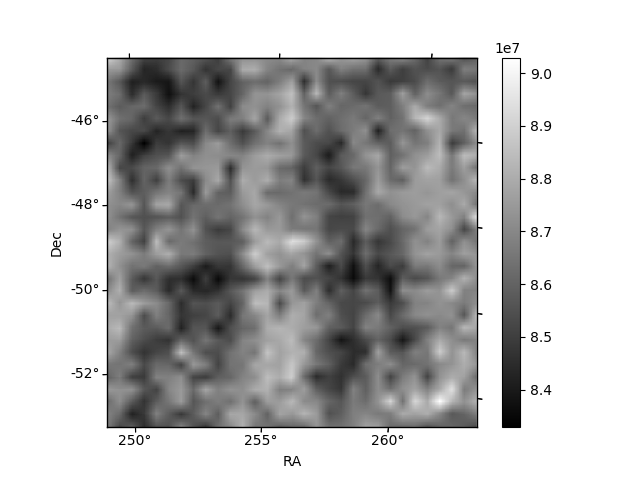
Histogram calculated using DETX and DETY for each event in the final _common_clean file
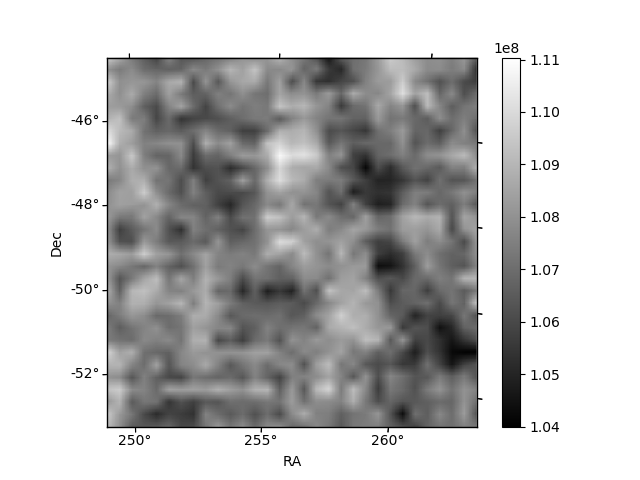
| Quadrant A | 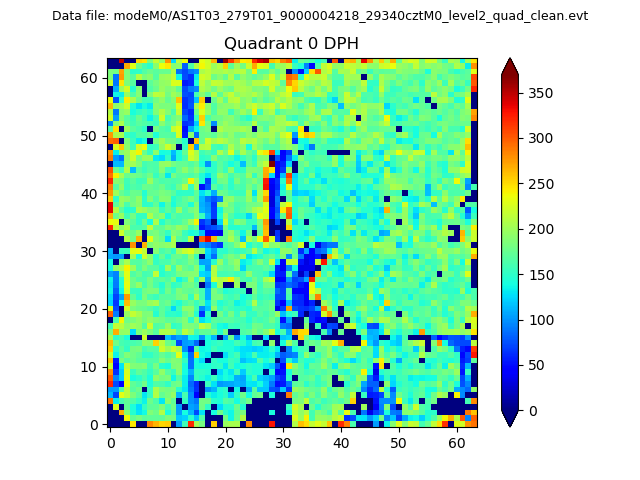 |
 |
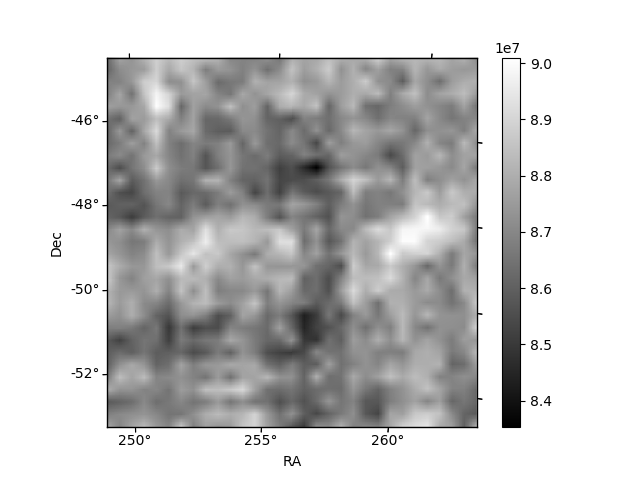
Quadrant B |
|---|---|---|---|
| Quadrant D | 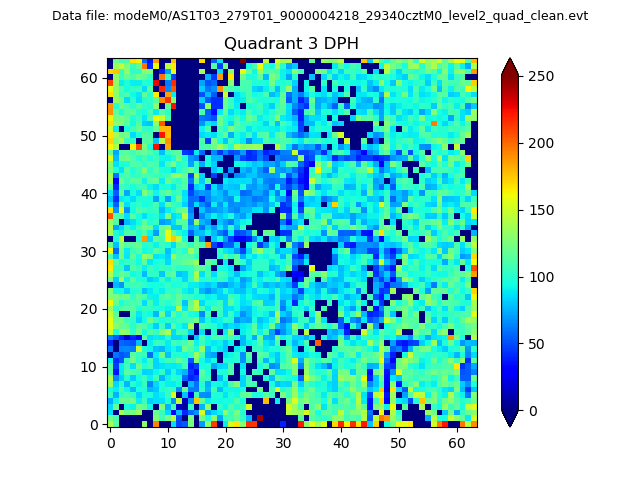 |
 |
Quadrant C |
| Plot type | Count rate plots | Images |
|---|---|---|
| Comparison with Poisson distribution Blue bars denote a histogram of data divided into 1 sec bins. Red curve is a Poisson curve with rate = median count rate of data. |
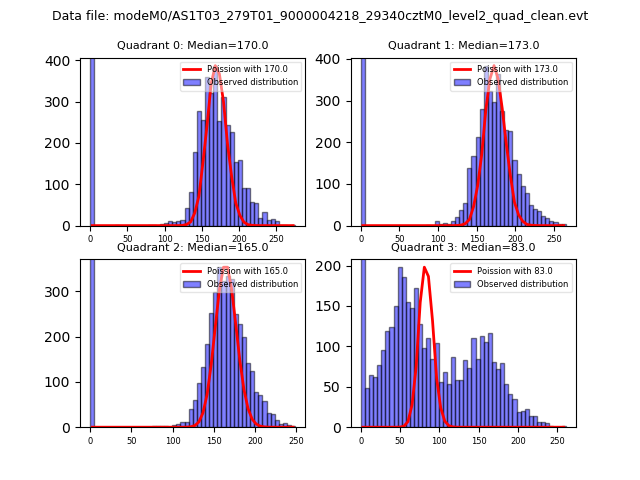 |
 |
| Quadrant-wise count rates Data is divided into 100 sec bins |
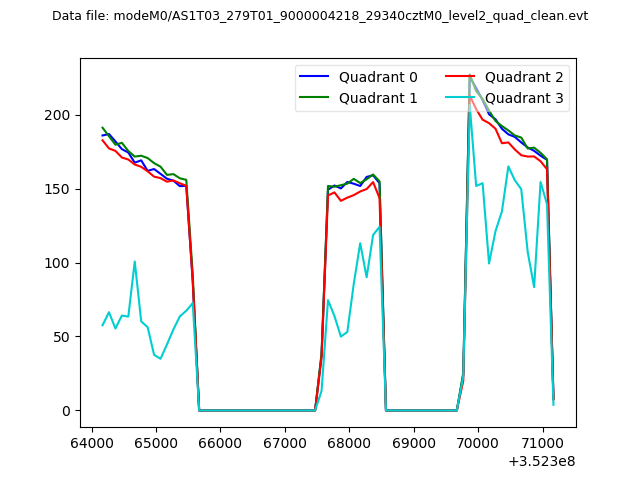 |
|
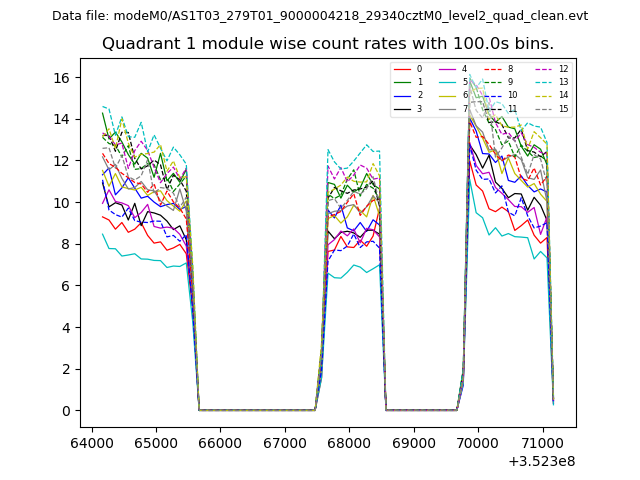
| Module-wise count rates for Quadrant A Data is divided into 100 sec bins |
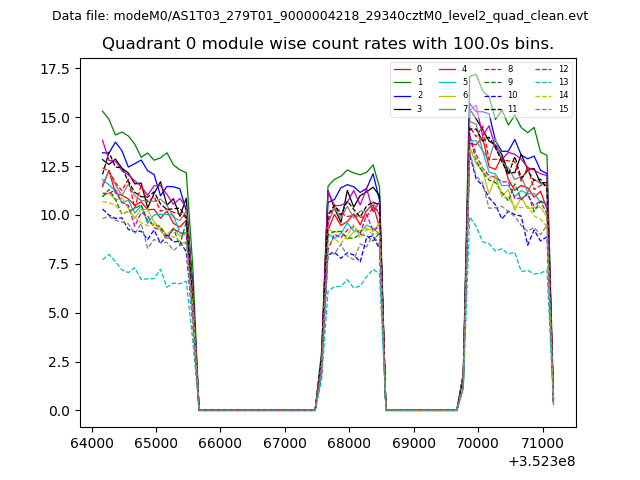 |
 |
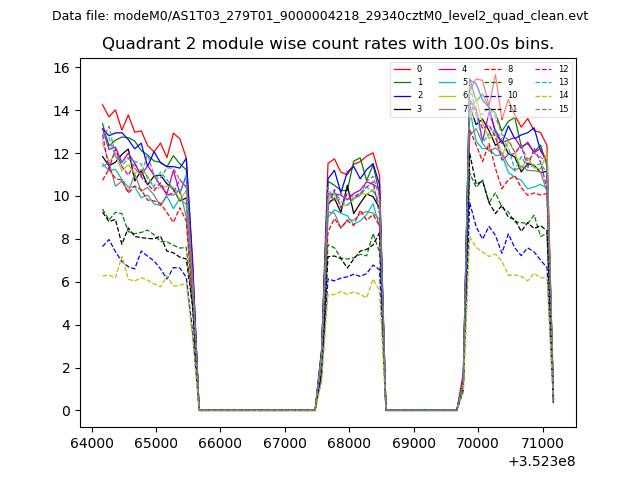
| Module-wise count rates for Quadrant B Data is divided into 100 sec bins |
 |
 |
| Module-wise count rates for Quadrant C Data is divided into 100 sec bins |
 |
 |
| Module-wise count rates for Quadrant D Data is divided into 100 sec bins |
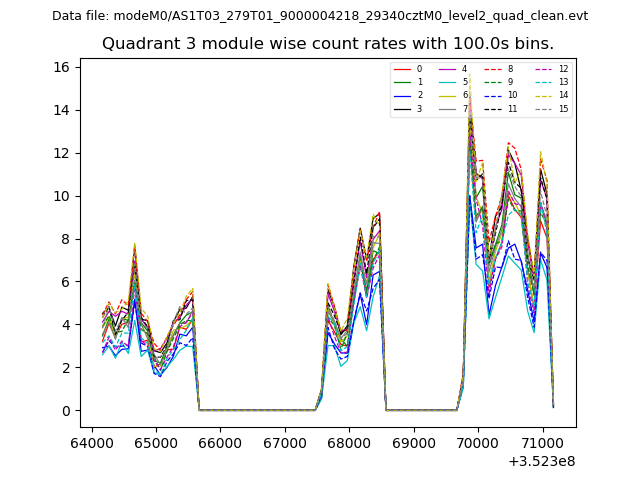 |
 |
| Parameter | Plot |
|---|---|
| CZT HV Monitor | 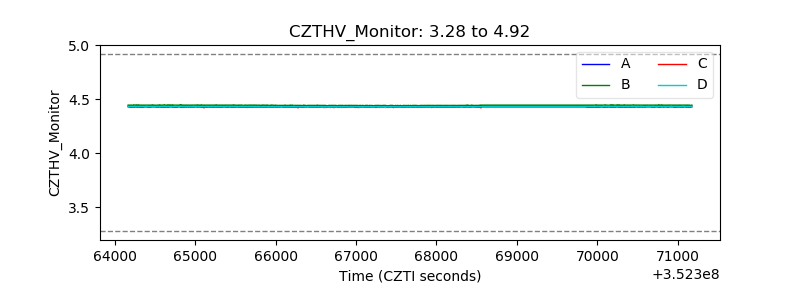 |
| D_VDD | 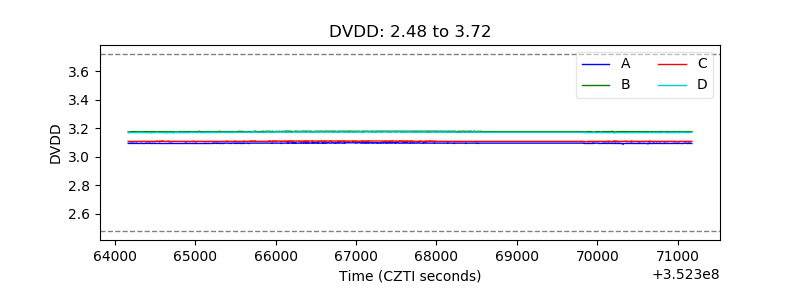 |
| Temperature 1 | 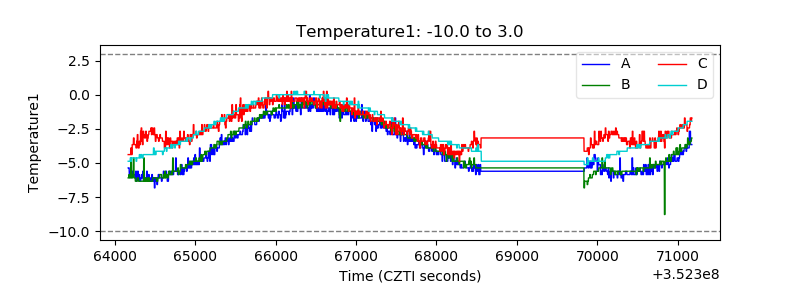 |
| Veto HV Monitor | 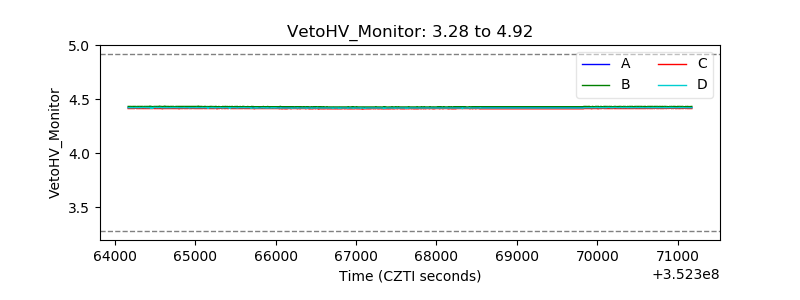 |
| Veto LLD | 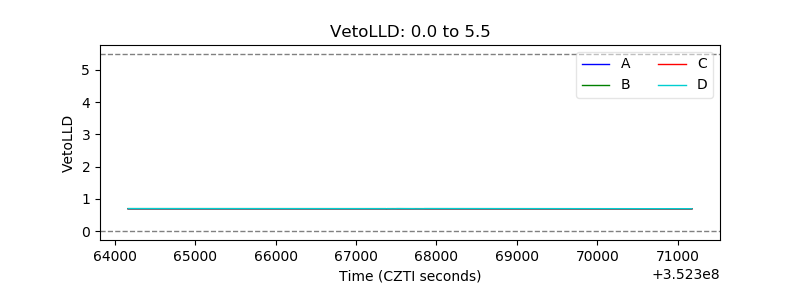 |
| Alpha Counter | 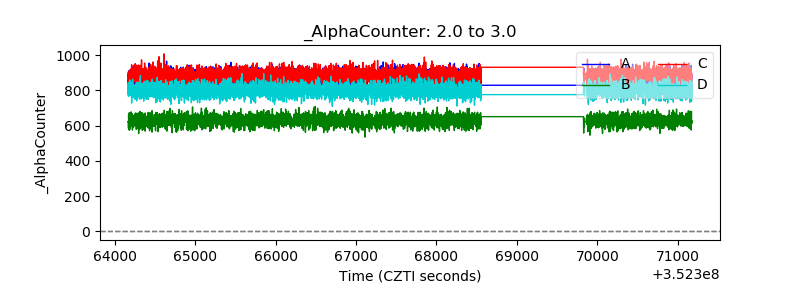 |
| _CPM_Rate | 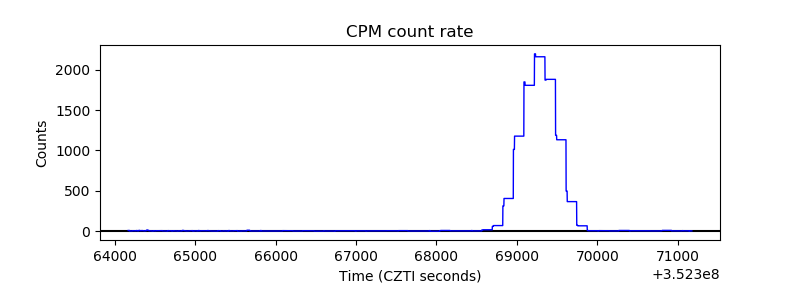 |
| CZT Counter | 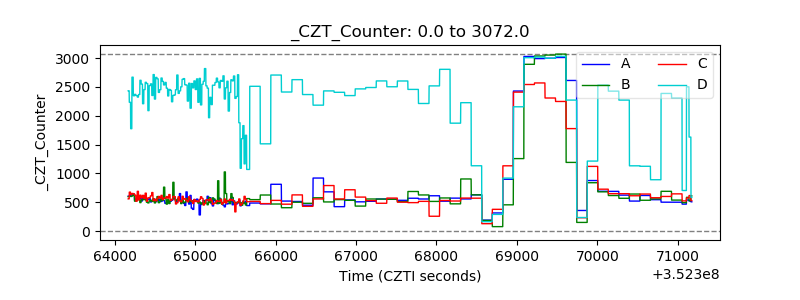 |
| +2.5 Volts monitor |  |
| +5 Volts monitor |  |
| _ROLL_ROT | 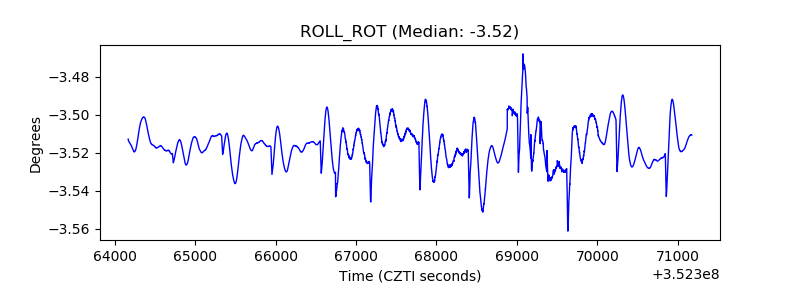 |
| _Roll_DEC | 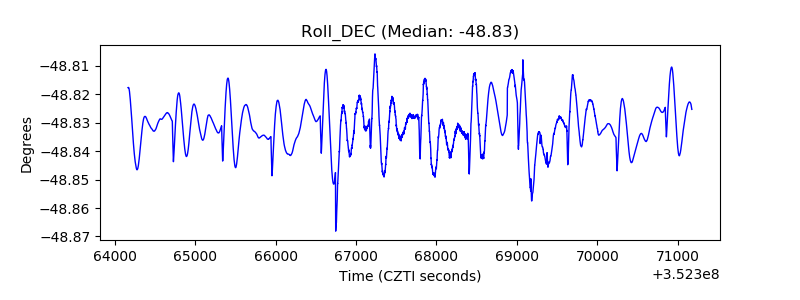 |
| _Roll_RA | 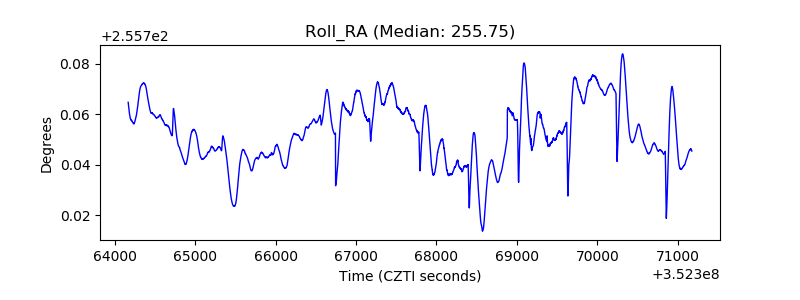 |
| Veto Counter | 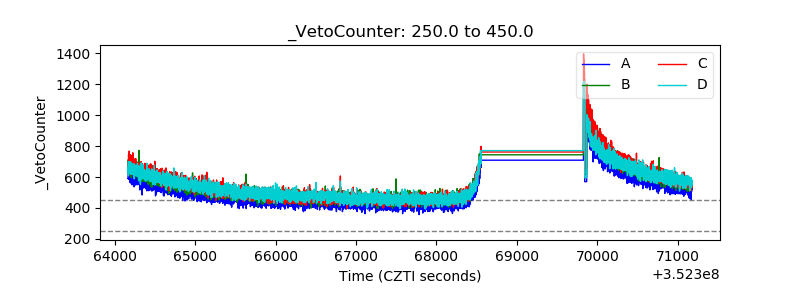 |