| Param | Original file | Final file |
|---|---|---|
| Filename | modeM0/AS1T03_279T01_9000004218_29341cztM0_level2.evt | modeM0/AS1T03_279T01_9000004218_29341cztM0_level2_quad_clean.evt |
| Size (bytes) | 751,939,200 | 90,737,280 |
| Size | 717.1 MB | 86.5 MB |
| Events in quadrant A | 3,218,964 | 647,813 |
| Events in quadrant B | 3,281,081 | 651,276 |
| Events in quadrant C | 3,999,023 | 613,746 |
| Events in quadrant D | 11,875,290 | 422,581 |
| Mode SS | |||
|---|---|---|---|
| Quadrant | BADHDUFLAG | Total packets | Discarded packets |
| A | 0 | 120 | 0 |
| B | 0 | 120 | 0 |
| C | 0 | 120 | 0 |
| D | 0 | 120 | 0 |
| Mode M9 | |||
|---|---|---|---|
| Quadrant | BADHDUFLAG | Total packets | Discarded packets |
| A | 0 | 13 | 0 |
| B | 0 | 13 | 0 |
| C | 0 | 13 | 0 |
| D | 0 | 13 | 0 |
| Mode M0 | |||
|---|---|---|---|
| Quadrant | BADHDUFLAG | Total packets | Discarded packets |
| A | 0 | 12882 | 1 |
| B | 0 | 13103 | 1 |
| C | 0 | 15768 | 1 |
| D | 0 | 39289 | 1 |
| Quadrant | Total seconds | Saturated seconds | Saturation percentage |
|---|---|---|---|
| A | 5886 | 80 | 1.359157% |
| B | 5887 | 58 | 0.985222% |
| C | 5887 | 163 | 2.768813% |
| D | 5887 | 3949 | 67.080007% |
Noise dominated data is calculated using 1-second bins in cleaned event files. If a bin has >2000 counts, and if more than 50% of those come from <1% of pixels, then it is considered to be noise-dominated and hence unusable.
| Quadrant | # 1 sec bins | Bins with >0 counts | Bins with >2000 counts | High rate bins dominated by noise | Noise dominated (total time) | Noise dominated (detector-on time) | Marked lightcurve |
|---|---|---|---|---|---|---|---|
| A | 7181 | 5887 | 11 | 11 | 0.15% | 0.19% | 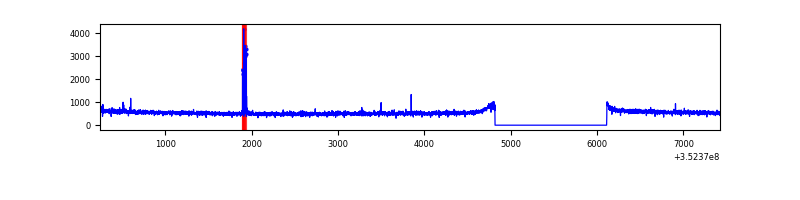 |
| B | 7182 | 5888 | 6 | 6 | 0.08% | 0.10% | 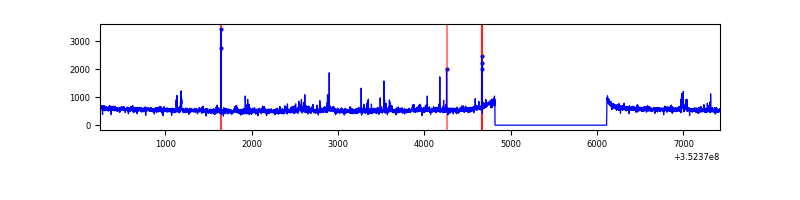 |
| C | 7182 | 5888 | 1 | 1 | 0.01% | 0.02% | 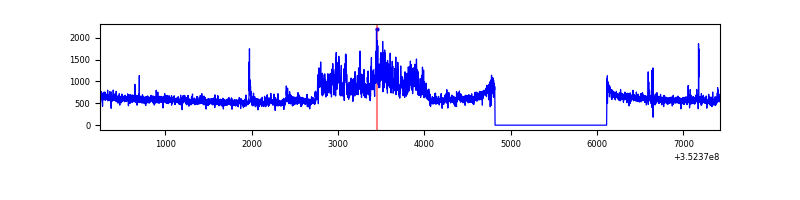 |
| D | 7182 | 5888 | 3134 | 3134 | 43.64% | 53.23% | 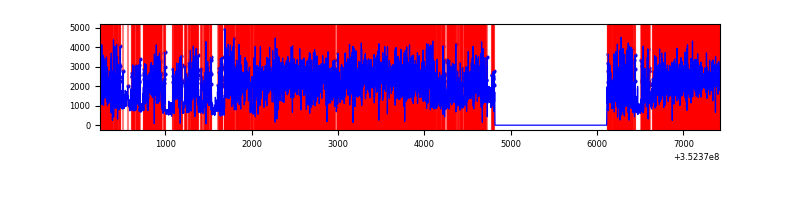 |
Top three noisy pixels from each quadrant. If the there are fewer than three noisy pixels in the level2.evt file, extra rows are filled as -1
| Pixel properties | Quadrant properties | ||||||
|---|---|---|---|---|---|---|---|
| Quadrant | DetID | PixID | Counts | Sigma | Mean | Median | Sigma |
| A | 15 | 174 | 59736 | 363.96 | 817 | 803 | 161.9 |
| A | 13 | 254 | 11853 | 68.24 | 817 | 803 | 161.9 |
| A | 0 | 226 | 7096 | 38.86 | 817 | 803 | 161.9 |
| B | 10 | 245 | 76168 | 509.02 | 802 | 786 | 148.1 |
| B | 0 | 190 | 25858 | 169.3 | 802 | 786 | 148.1 |
| B | 12 | 111 | 16523 | 106.26 | 802 | 786 | 148.1 |
| C | 3 | 233 | 786548 | 4390.13 | 779 | 787 | 179.0 |
| C | 14 | 238 | 137379 | 763.15 | 779 | 787 | 179.0 |
| C | 14 | 254 | 16218 | 86.21 | 779 | 787 | 179.0 |
| D | 12 | 33 | 6215761 | 46785.86 | 561 | 548 | 132.8 |
| D | 1 | 52 | 2458854 | 18505.23 | 561 | 548 | 132.8 |
| D | 13 | 104 | 314495 | 2363.28 | 561 | 548 | 132.8 |
Histogram calculated using DETX and DETY for each event in the final _common_clean file
| Quadrant A |  |
 |
Quadrant B |
|---|---|---|---|
| Quadrant D |  |
 |
Quadrant C |
| Plot type | Count rate plots | Images |
|---|---|---|
| Comparison with Poisson distribution Blue bars denote a histogram of data divided into 1 sec bins. Red curve is a Poisson curve with rate = median count rate of data. |
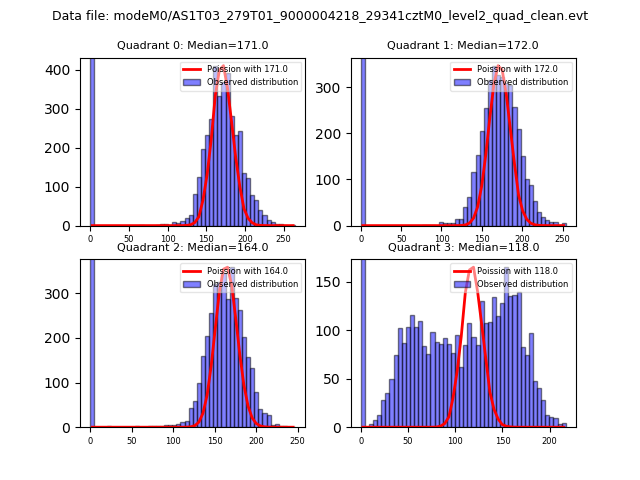 |
 |
| Quadrant-wise count rates Data is divided into 100 sec bins |
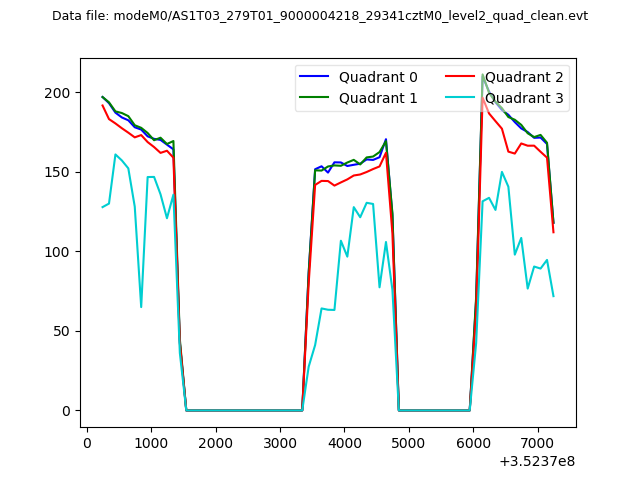 |
|
| Module-wise count rates for Quadrant A Data is divided into 100 sec bins |
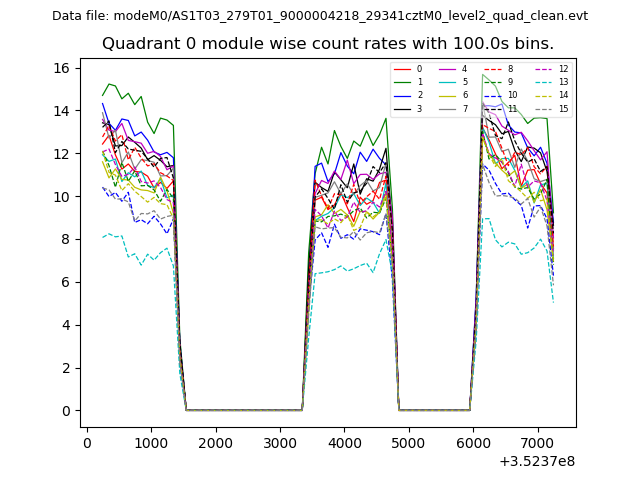 |
 |
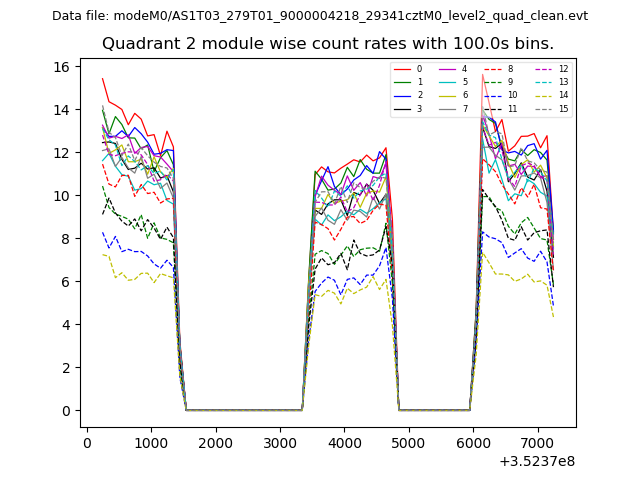
| Module-wise count rates for Quadrant B Data is divided into 100 sec bins |
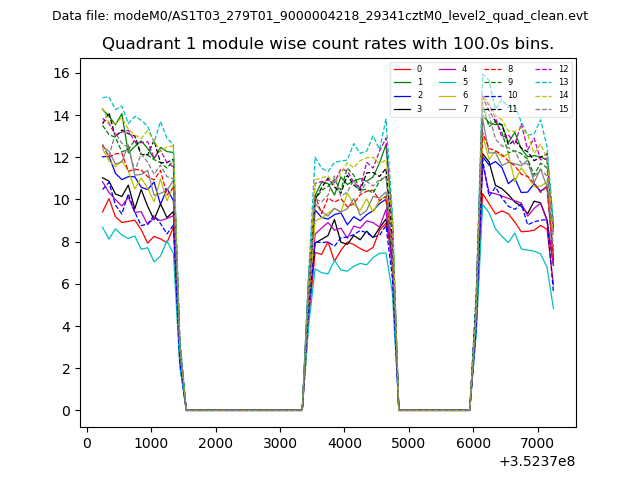 |
 |
| Module-wise count rates for Quadrant C Data is divided into 100 sec bins |
 |
 |
| Module-wise count rates for Quadrant D Data is divided into 100 sec bins |
 |
 |
| Parameter | Plot |
|---|---|
| CZT HV Monitor | 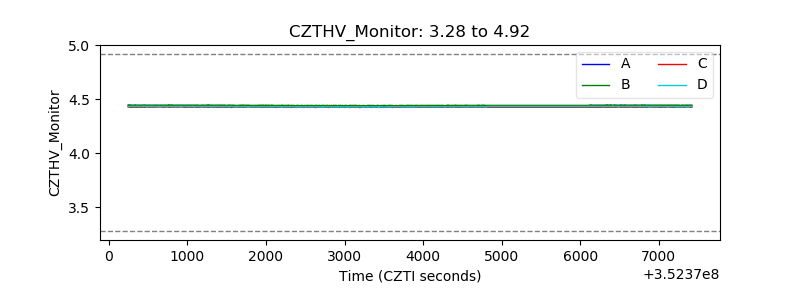 |
| D_VDD |  |
| Temperature 1 |  |
| Veto HV Monitor |  |
| Veto LLD |  |
| Alpha Counter | 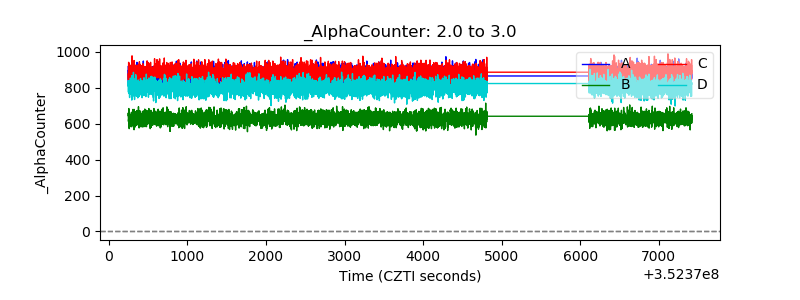 |
| _CPM_Rate | 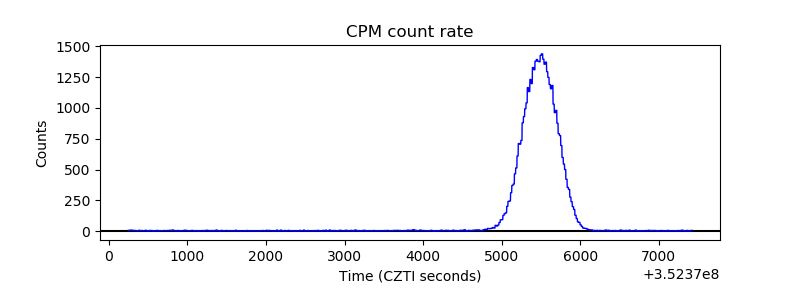 |
| CZT Counter |  |
| +2.5 Volts monitor |  |
| +5 Volts monitor |  |
| _ROLL_ROT |  |
| _Roll_DEC |  |
| _Roll_RA |  |
| Veto Counter |  |