| Param | Original file | Final file |
|---|---|---|
| Filename | modeM0/AS1T03_279T01_9000004218_29343cztM0_level2.evt | modeM0/AS1T03_279T01_9000004218_29343cztM0_level2_quad_clean.evt |
| Size (bytes) | 714,185,280 | 69,788,160 |
| Size | 681.1 MB | 66.6 MB |
| Events in quadrant A | 3,202,304 | 461,910 |
| Events in quadrant B | 3,324,424 | 464,145 |
| Events in quadrant C | 3,420,677 | 428,002 |
| Events in quadrant D | 11,250,881 | 314,123 |
| Mode SS | |||
|---|---|---|---|
| Quadrant | BADHDUFLAG | Total packets | Discarded packets |
| A | 0 | 128 | 0 |
| B | 0 | 128 | 0 |
| C | 0 | 128 | 0 |
| D | 0 | 128 | 0 |
| Mode M9 | |||
|---|---|---|---|
| Quadrant | BADHDUFLAG | Total packets | Discarded packets |
| A | 0 | 10 | 0 |
| B | 0 | 10 | 0 |
| C | 0 | 10 | 0 |
| D | 0 | 10 | 0 |
| Mode M0 | |||
|---|---|---|---|
| Quadrant | BADHDUFLAG | Total packets | Discarded packets |
| A | 0 | 13227 | 1 |
| B | 0 | 13583 | 1 |
| C | 0 | 13868 | 1 |
| D | 0 | 37805 | 1 |
| Quadrant | Total seconds | Saturated seconds | Saturation percentage |
|---|---|---|---|
| A | 6366 | 90 | 1.413761% |
| B | 6367 | 121 | 1.900424% |
| C | 6367 | 430 | 6.753573% |
| D | 6367 | 3083 | 48.421549% |
Noise dominated data is calculated using 1-second bins in cleaned event files. If a bin has >2000 counts, and if more than 50% of those come from <1% of pixels, then it is considered to be noise-dominated and hence unusable.
| Quadrant | # 1 sec bins | Bins with >0 counts | Bins with >2000 counts | High rate bins dominated by noise | Noise dominated (total time) | Noise dominated (detector-on time) | Marked lightcurve |
|---|---|---|---|---|---|---|---|
| A | 7302 | 6368 | 0 | 0 | 0.00% | 0.00% |  |
| B | 7303 | 6369 | 6 | 6 | 0.08% | 0.09% | 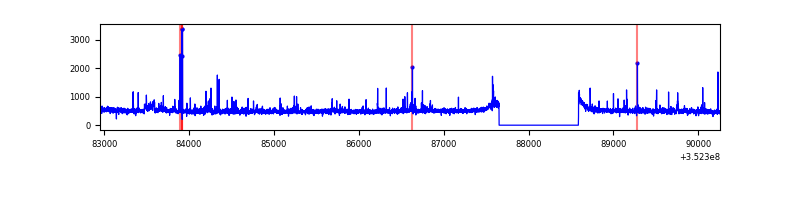 |
| C | 7303 | 6369 | 0 | 0 | 0.00% | 0.00% | 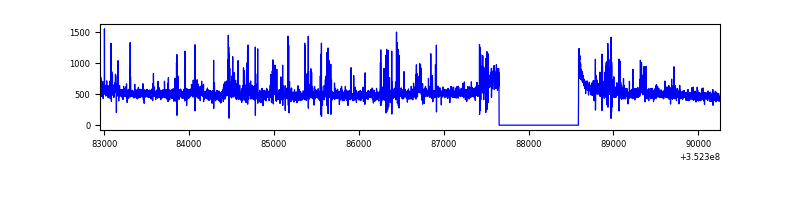 |
| D | 7303 | 6369 | 2460 | 2460 | 33.68% | 38.62% | 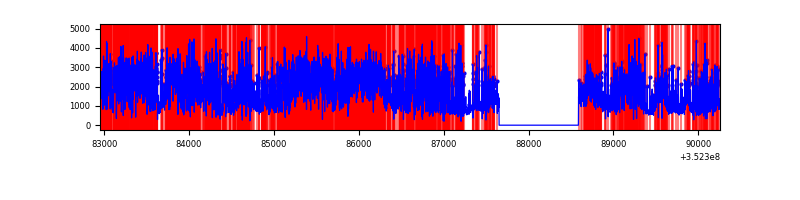 |
Top three noisy pixels from each quadrant. If the there are fewer than three noisy pixels in the level2.evt file, extra rows are filled as -1
| Pixel properties | Quadrant properties | ||||||
|---|---|---|---|---|---|---|---|
| Quadrant | DetID | PixID | Counts | Sigma | Mean | Median | Sigma |
| A | 15 | 174 | 27051 | 162.15 | 815 | 798 | 161.9 |
| A | 0 | 13 | 20837 | 123.77 | 815 | 798 | 161.9 |
| A | 13 | 254 | 13668 | 79.49 | 815 | 798 | 161.9 |
| B | 10 | 245 | 106021 | 698.56 | 803 | 785 | 150.6 |
| B | 0 | 244 | 19602 | 124.91 | 803 | 785 | 150.6 |
| B | 12 | 111 | 17534 | 111.18 | 803 | 785 | 150.6 |
| C | 14 | 238 | 209838 | 1184.35 | 760 | 767 | 176.5 |
| C | 14 | 254 | 128654 | 724.45 | 760 | 767 | 176.5 |
| C | 3 | 233 | 73164 | 410.11 | 760 | 767 | 176.5 |
| D | 12 | 33 | 4025957 | 26809.9 | 632 | 617 | 150.1 |
| D | 1 | 52 | 2795882 | 18617.26 | 632 | 617 | 150.1 |
| D | 7 | 80 | 901159 | 5997.86 | 632 | 617 | 150.1 |
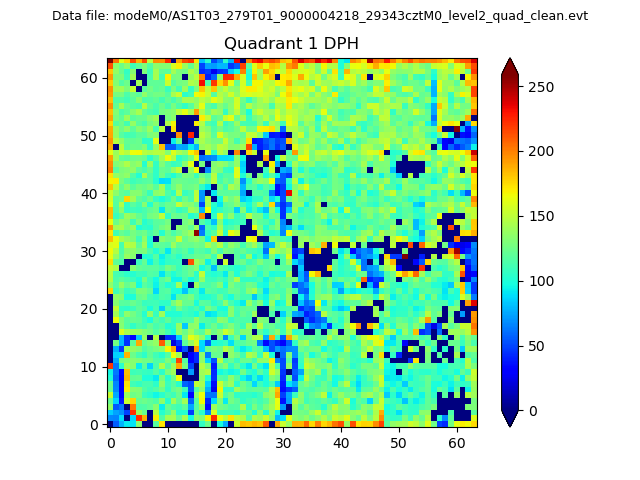
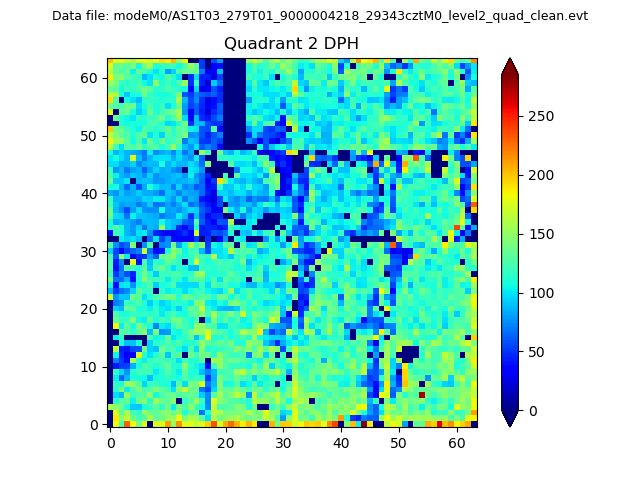
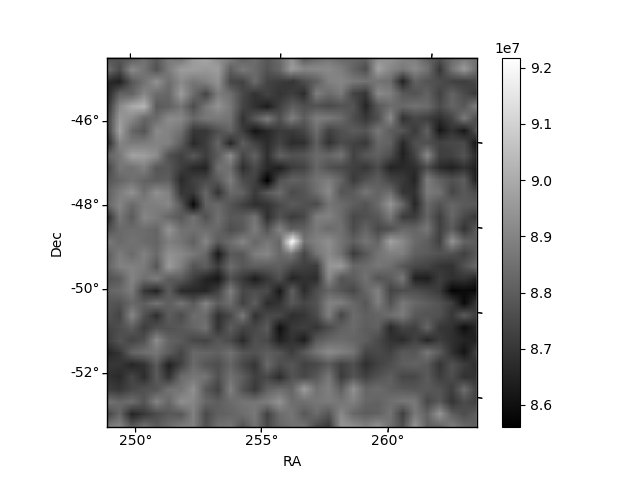
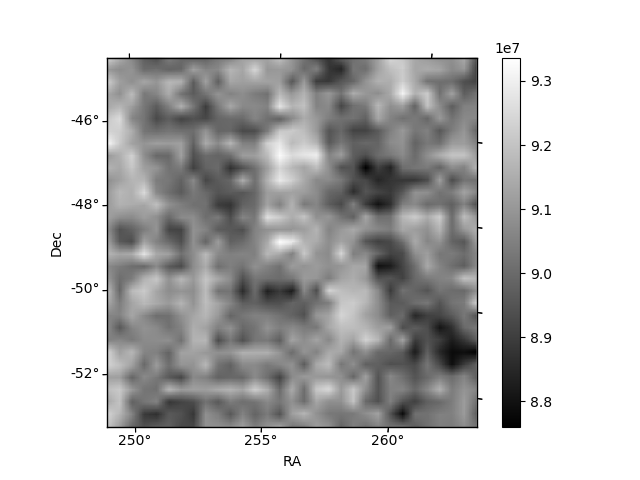
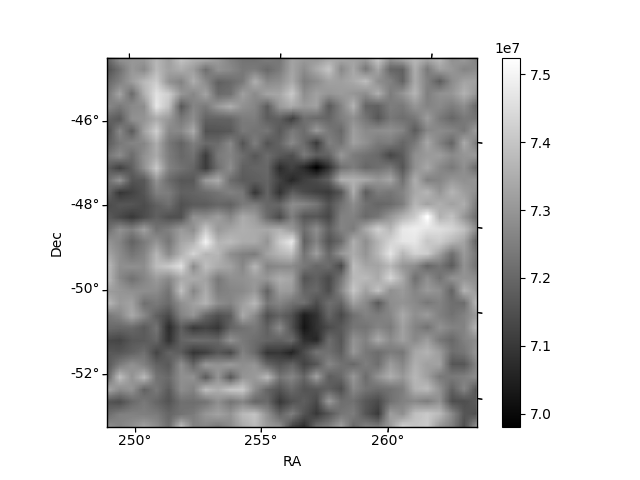
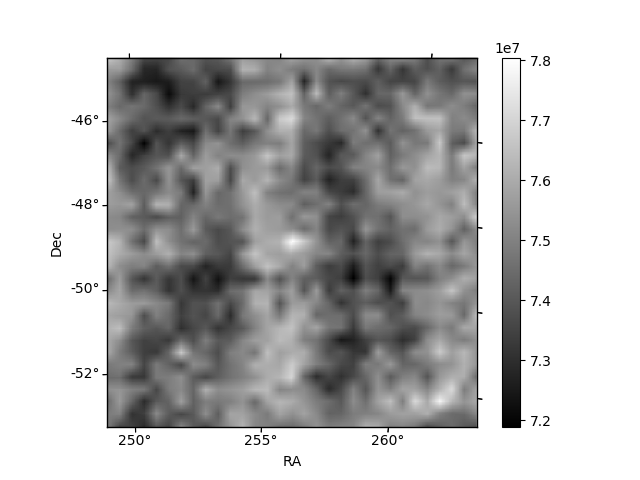
Histogram calculated using DETX and DETY for each event in the final _common_clean file
| Quadrant A | 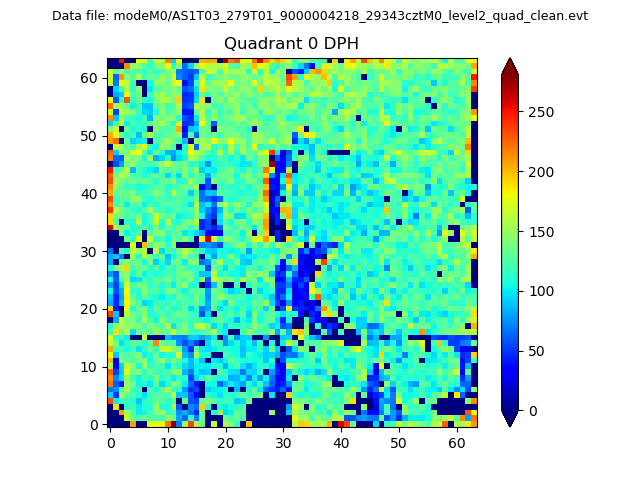 |
 |
Quadrant B |
|---|---|---|---|
| Quadrant D | 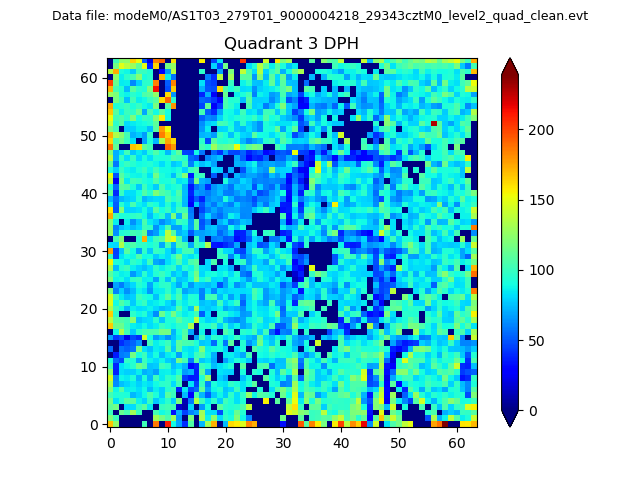 |
 |
Quadrant C |
| Plot type | Count rate plots | Images |
|---|---|---|
| Comparison with Poisson distribution Blue bars denote a histogram of data divided into 1 sec bins. Red curve is a Poisson curve with rate = median count rate of data. |
 |
 |
| Quadrant-wise count rates Data is divided into 100 sec bins |
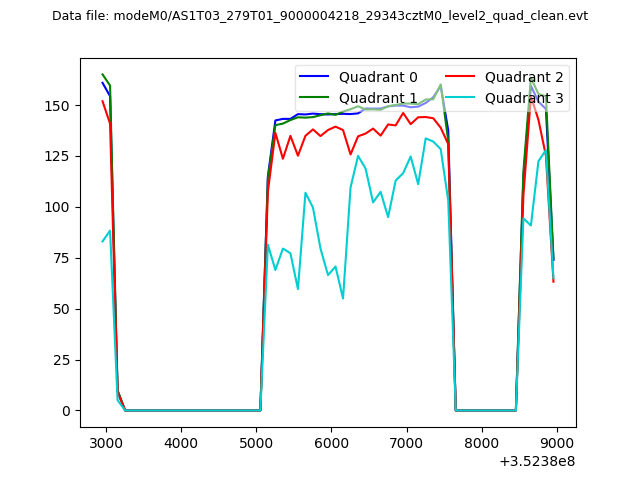 |
|
| Module-wise count rates for Quadrant A Data is divided into 100 sec bins |
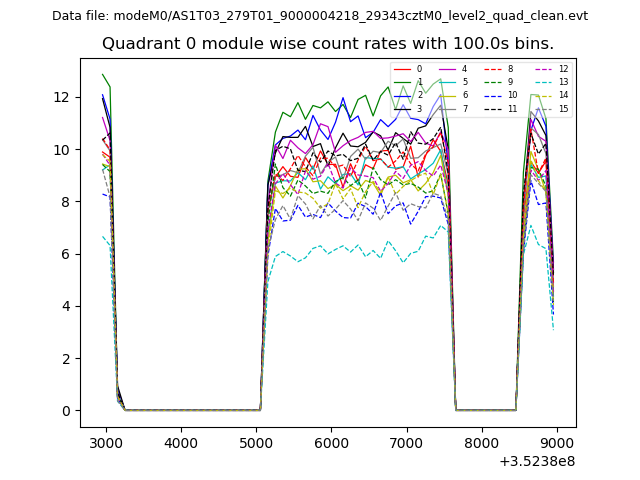 |
 |
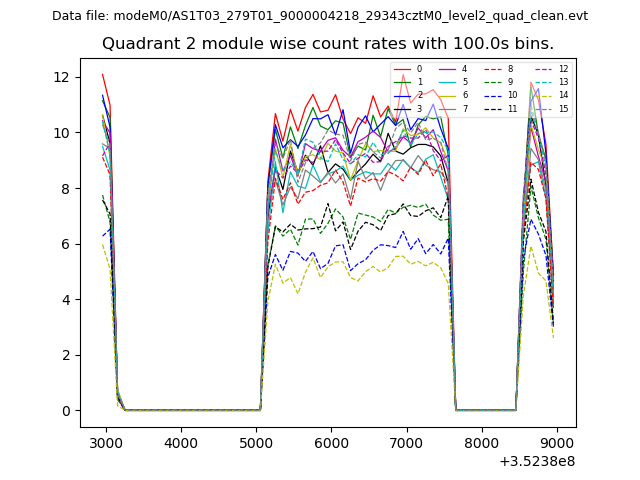
| Module-wise count rates for Quadrant B Data is divided into 100 sec bins |
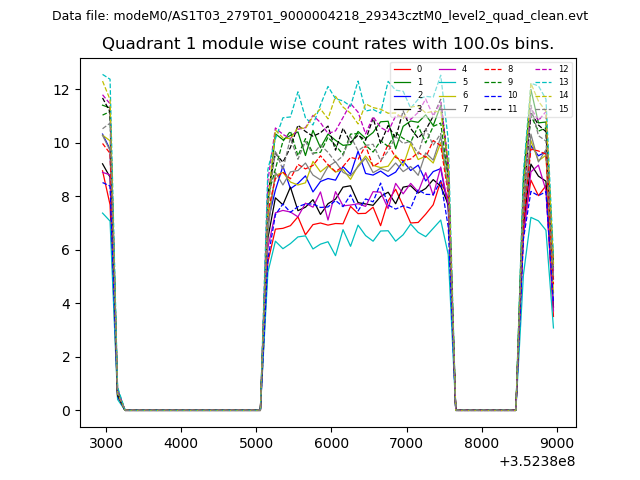 |
 |
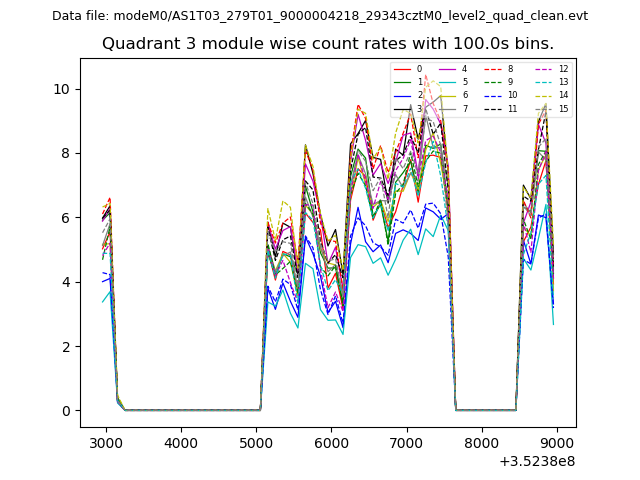
| Module-wise count rates for Quadrant C Data is divided into 100 sec bins |
 |
 |
| Module-wise count rates for Quadrant D Data is divided into 100 sec bins |
 |
 |
| Parameter | Plot |
|---|---|
| CZT HV Monitor | 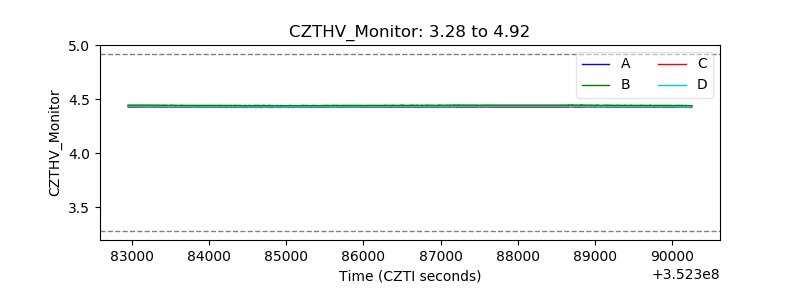 |
| D_VDD | 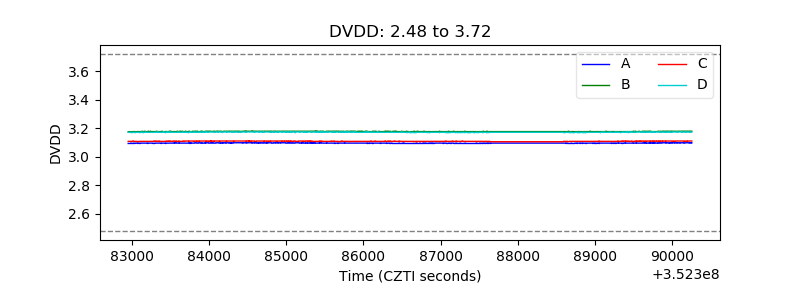 |
| Temperature 1 | 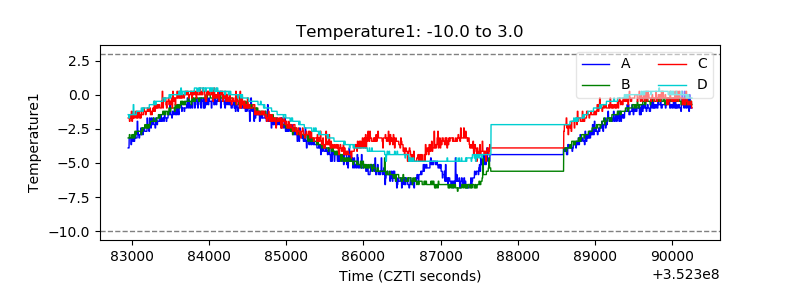 |
| Veto HV Monitor | 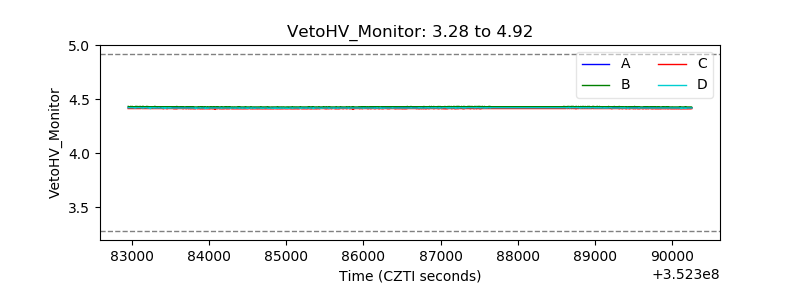 |
| Veto LLD | 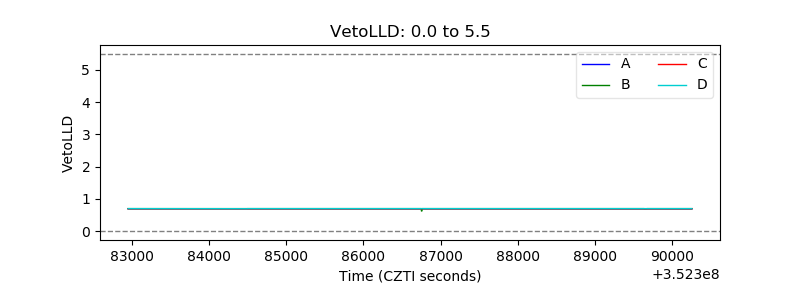 |
| Alpha Counter | 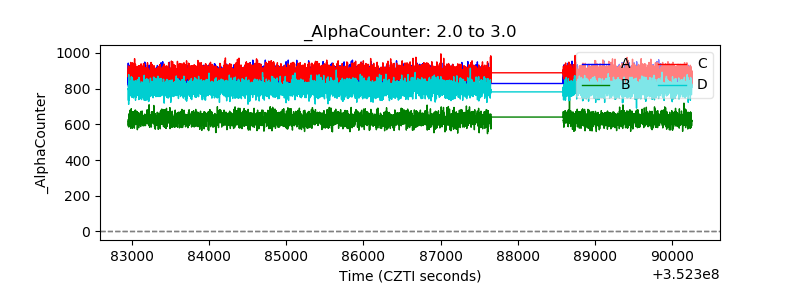 |
| _CPM_Rate | 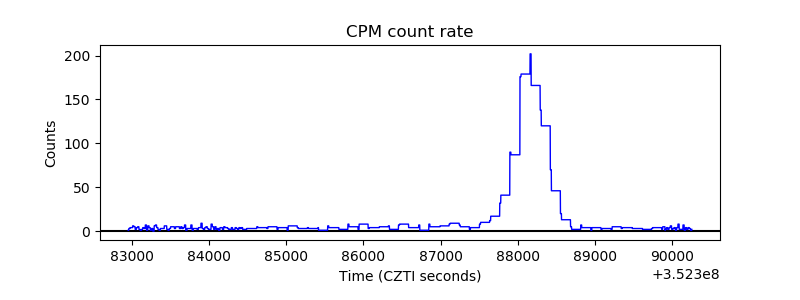 |
| CZT Counter | 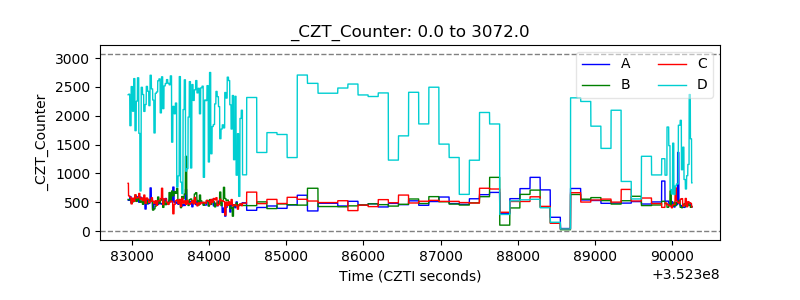 |
| +2.5 Volts monitor |  |
| +5 Volts monitor |  |
| _ROLL_ROT | 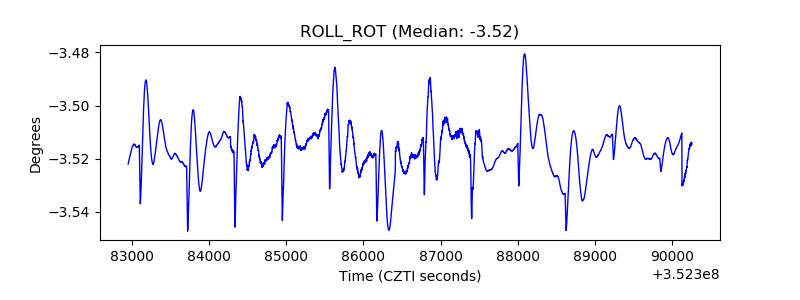 |
| _Roll_DEC | 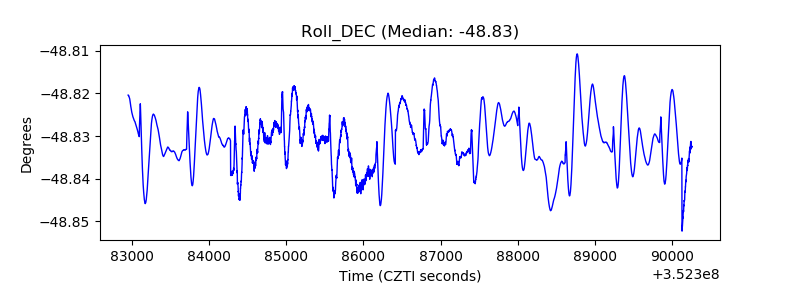 |
| _Roll_RA | 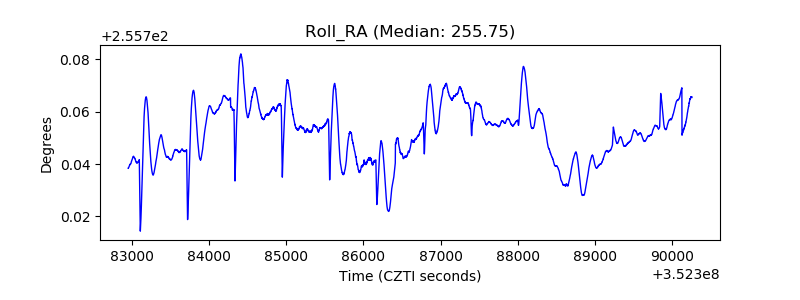 |
| Veto Counter | 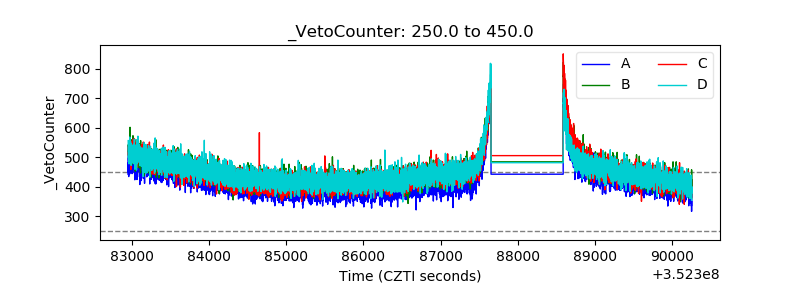 |