| Param | Original file | Final file |
|---|---|---|
| Filename | modeM0/AS1T03_279T01_9000004218_29344cztM0_level2.evt | modeM0/AS1T03_279T01_9000004218_29344cztM0_level2_quad_clean.evt |
| Size (bytes) | 776,335,680 | 77,736,960 |
| Size | 740.4 MB | 74.1 MB |
| Events in quadrant A | 3,569,199 | 496,550 |
| Events in quadrant B | 3,762,612 | 500,246 |
| Events in quadrant C | 3,753,403 | 471,301 |
| Events in quadrant D | 11,945,909 | 390,725 |
| Mode SS | |||
|---|---|---|---|
| Quadrant | BADHDUFLAG | Total packets | Discarded packets |
| A | 0 | 142 | 0 |
| B | 0 | 142 | 0 |
| C | 0 | 142 | 0 |
| D | 0 | 142 | 0 |
| Mode M9 | |||
|---|---|---|---|
| Quadrant | BADHDUFLAG | Total packets | Discarded packets |
| A | 0 | 6 | 0 |
| B | 0 | 6 | 0 |
| C | 0 | 6 | 0 |
| D | 0 | 6 | 0 |
| Mode M0 | |||
|---|---|---|---|
| Quadrant | BADHDUFLAG | Total packets | Discarded packets |
| A | 0 | 14997 | 1 |
| B | 0 | 15480 | 1 |
| C | 0 | 15364 | 1 |
| D | 0 | 40450 | 1 |
| Quadrant | Total seconds | Saturated seconds | Saturation percentage |
|---|---|---|---|
| A | 7105 | 144 | 2.026742% |
| B | 7106 | 168 | 2.364199% |
| C | 7106 | 314 | 4.418801% |
| D | 7106 | 3065 | 43.132564% |
Noise dominated data is calculated using 1-second bins in cleaned event files. If a bin has >2000 counts, and if more than 50% of those come from <1% of pixels, then it is considered to be noise-dominated and hence unusable.
| Quadrant | # 1 sec bins | Bins with >0 counts | Bins with >2000 counts | High rate bins dominated by noise | Noise dominated (total time) | Noise dominated (detector-on time) | Marked lightcurve |
|---|---|---|---|---|---|---|---|
| A | 7625 | 7106 | 17 | 17 | 0.22% | 0.24% | 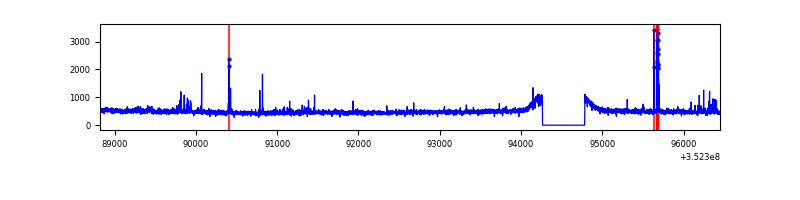 |
| B | 7626 | 7107 | 28 | 28 | 0.37% | 0.39% | 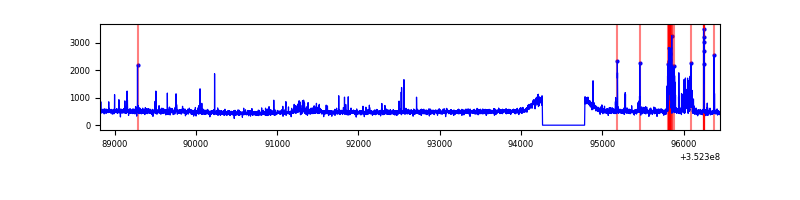 |
| C | 7626 | 7107 | 0 | 0 | 0.00% | 0.00% | 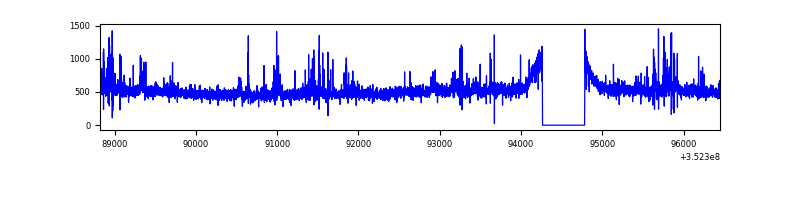 |
| D | 7626 | 7107 | 2419 | 2419 | 31.72% | 34.04% | 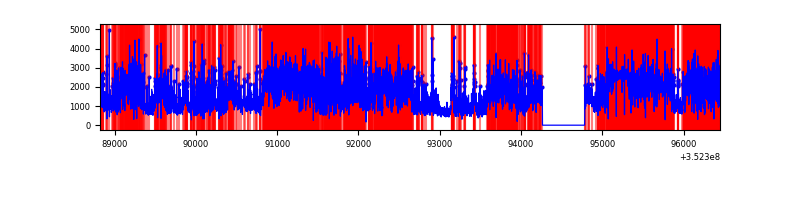 |
Top three noisy pixels from each quadrant. If the there are fewer than three noisy pixels in the level2.evt file, extra rows are filled as -1
| Pixel properties | Quadrant properties | ||||||
|---|---|---|---|---|---|---|---|
| Quadrant | DetID | PixID | Counts | Sigma | Mean | Median | Sigma |
| A | 15 | 174 | 80289 | 441.27 | 893 | 873 | 180.0 |
| A | 0 | 13 | 28980 | 156.18 | 893 | 873 | 180.0 |
| A | 13 | 254 | 14791 | 77.34 | 893 | 873 | 180.0 |
| B | 5 | 172 | 164771 | 974.35 | 883 | 862 | 168.2 |
| B | 3 | 209 | 48448 | 282.87 | 883 | 862 | 168.2 |
| B | 10 | 245 | 30246 | 174.67 | 883 | 862 | 168.2 |
| C | 14 | 238 | 199752 | 1007.65 | 846 | 854 | 197.4 |
| C | 3 | 233 | 107986 | 542.75 | 846 | 854 | 197.4 |
| C | 14 | 254 | 95247 | 478.21 | 846 | 854 | 197.4 |
| D | 12 | 33 | 4531765 | 25985.13 | 728 | 709 | 174.4 |
| D | 1 | 52 | 1977387 | 11336.04 | 728 | 709 | 174.4 |
| D | 7 | 80 | 1084114 | 6213.22 | 728 | 709 | 174.4 |
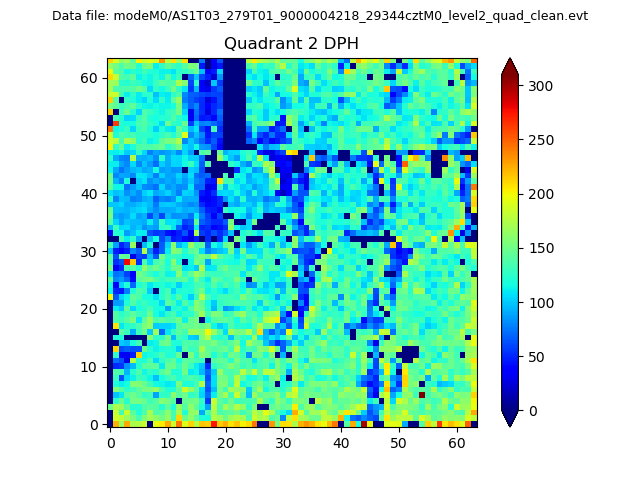
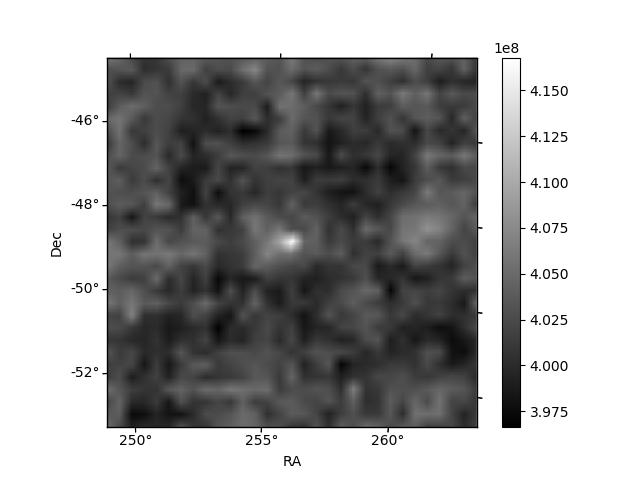
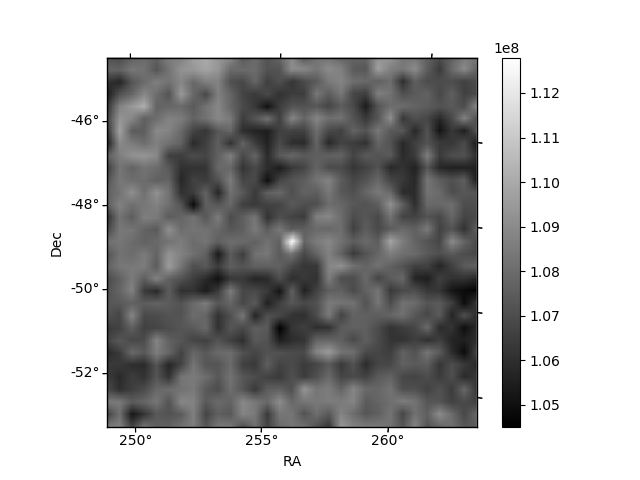
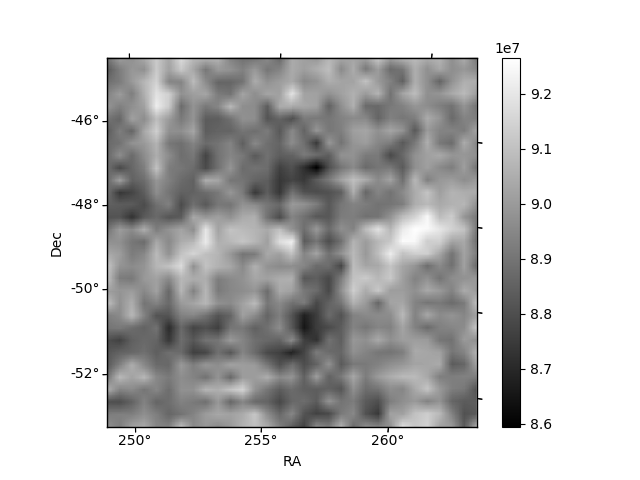
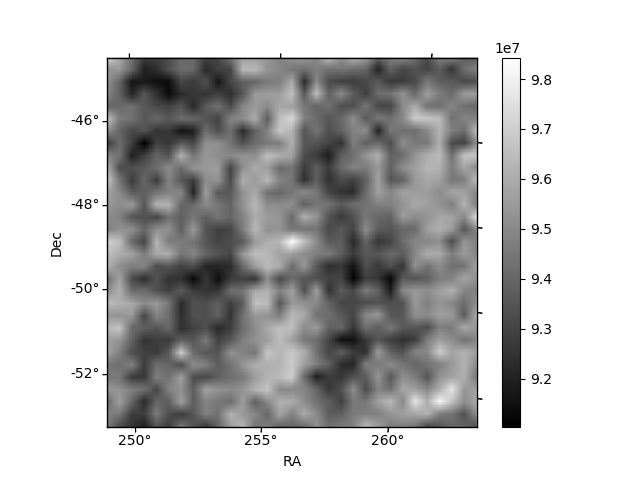
Histogram calculated using DETX and DETY for each event in the final _common_clean file
| Quadrant A | 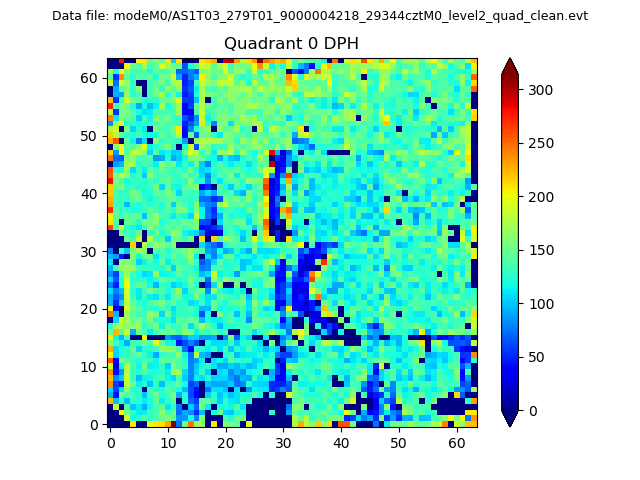 |
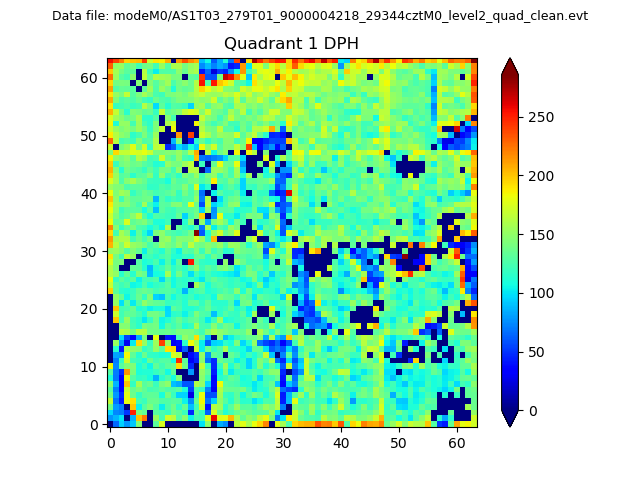 |
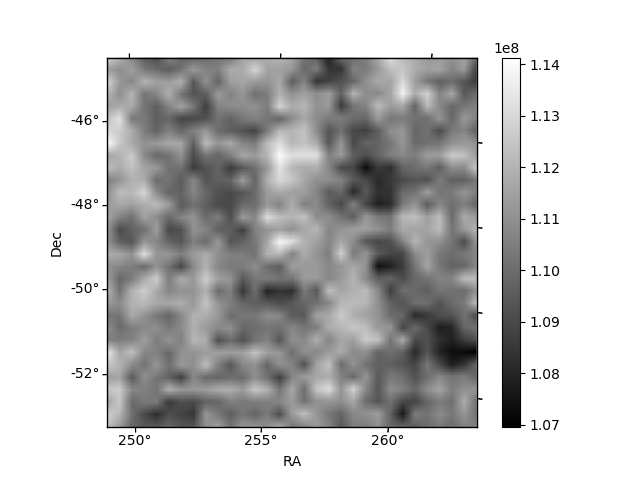
Quadrant B |
|---|---|---|---|
| Quadrant D | 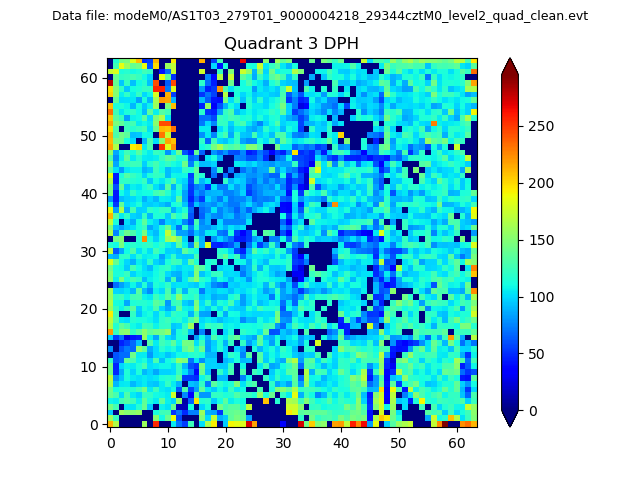 |
 |
Quadrant C |
| Plot type | Count rate plots | Images |
|---|---|---|
| Comparison with Poisson distribution Blue bars denote a histogram of data divided into 1 sec bins. Red curve is a Poisson curve with rate = median count rate of data. |
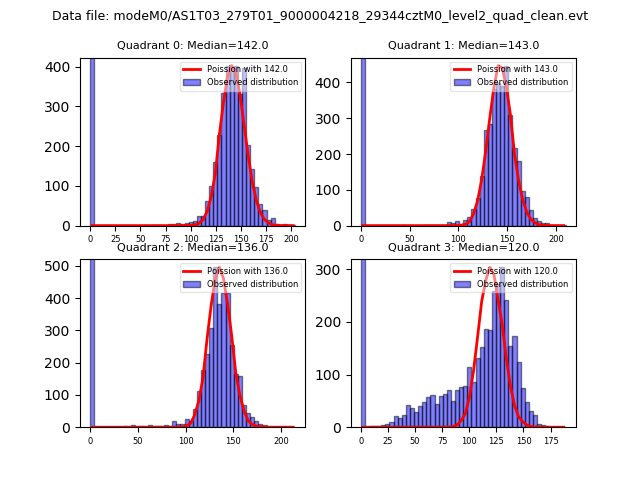 |
 |
| Quadrant-wise count rates Data is divided into 100 sec bins |
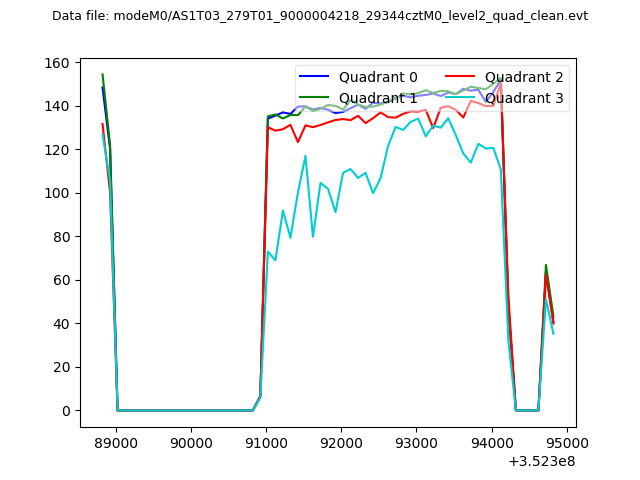 |
|
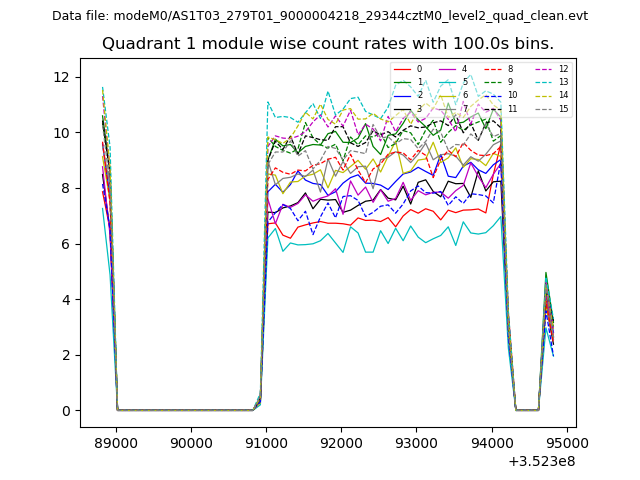
| Module-wise count rates for Quadrant A Data is divided into 100 sec bins |
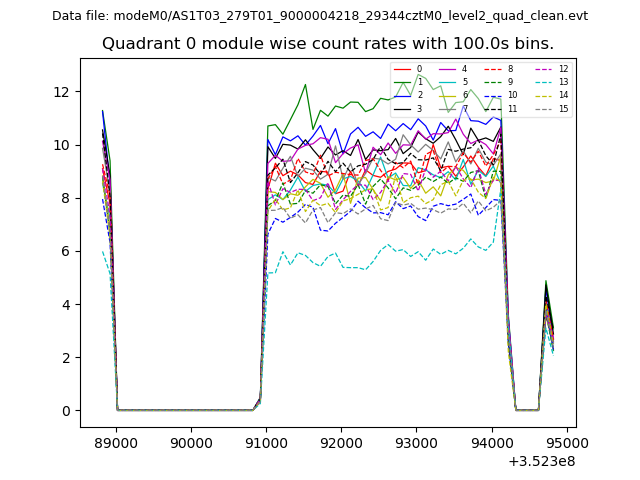 |
 |
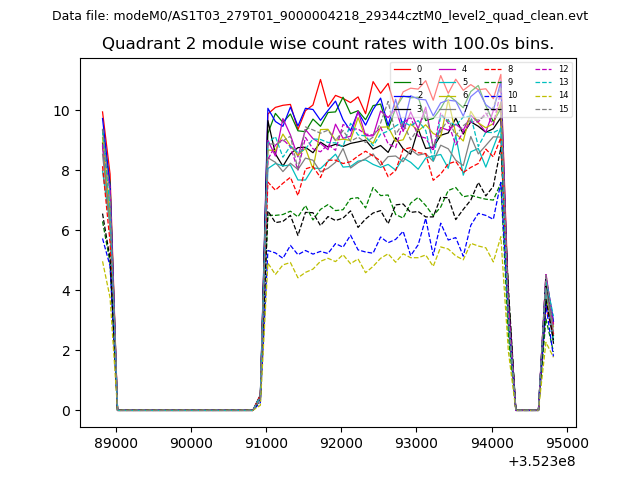
| Module-wise count rates for Quadrant B Data is divided into 100 sec bins |
 |
 |
| Module-wise count rates for Quadrant C Data is divided into 100 sec bins |
 |
 |
| Module-wise count rates for Quadrant D Data is divided into 100 sec bins |
 |
 |
| Parameter | Plot |
|---|---|
| CZT HV Monitor | 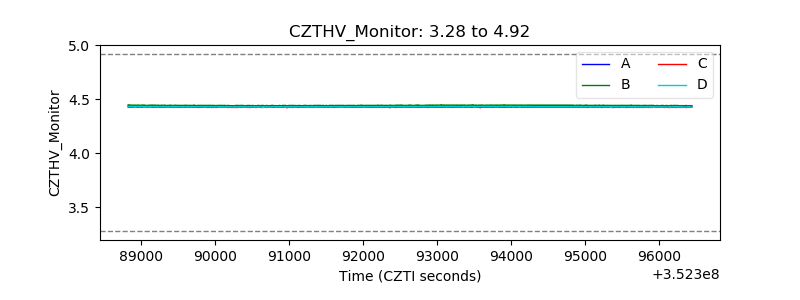 |
| D_VDD |  |
| Temperature 1 | 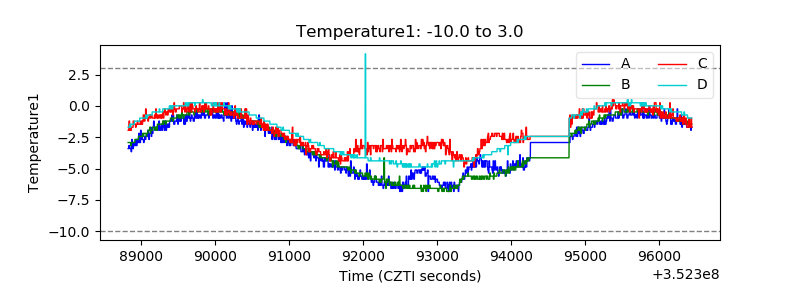 |
| Veto HV Monitor | 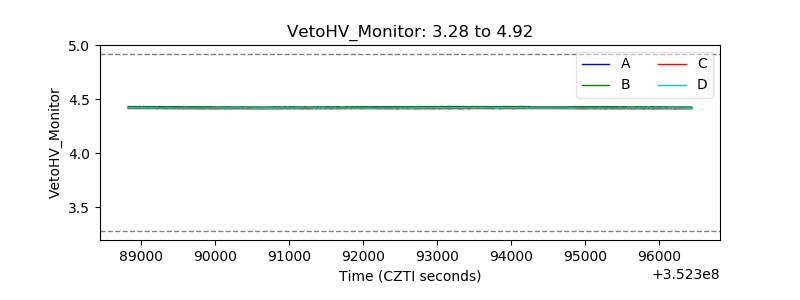 |
| Veto LLD |  |
| Alpha Counter | 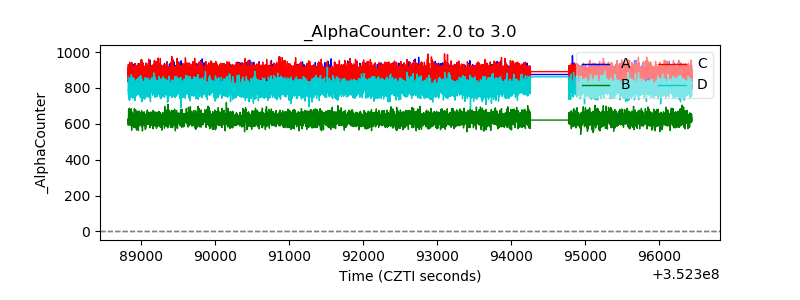 |
| _CPM_Rate | 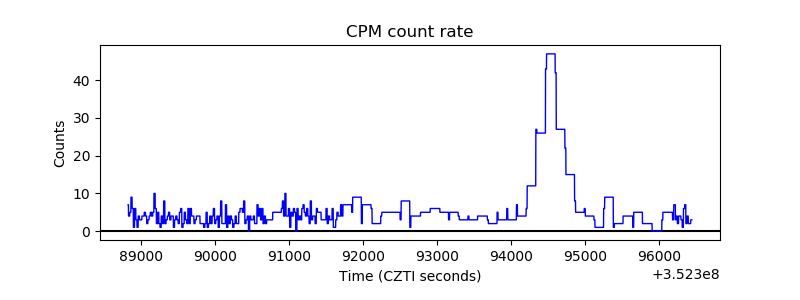 |
| CZT Counter | 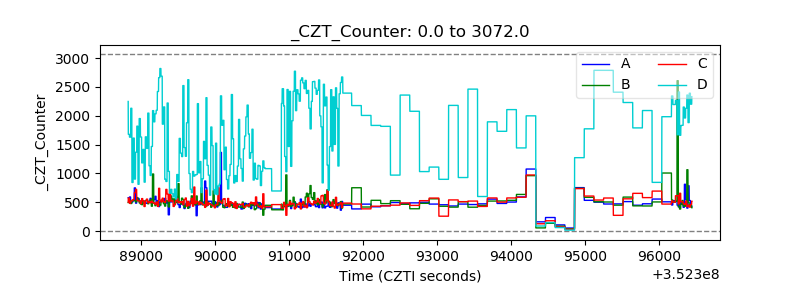 |
| +2.5 Volts monitor |  |
| +5 Volts monitor |  |
| _ROLL_ROT | 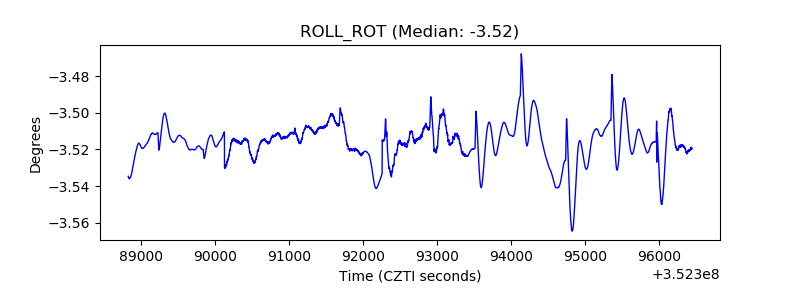 |
| _Roll_DEC | 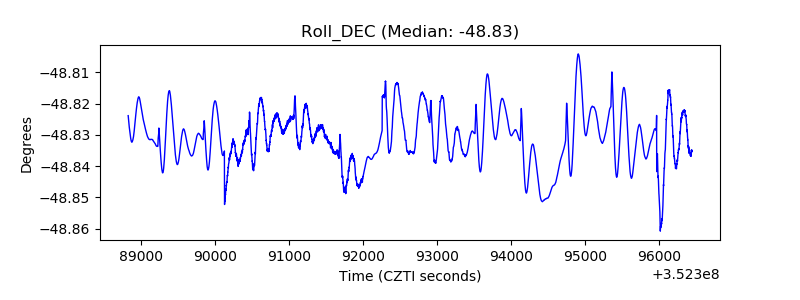 |
| _Roll_RA | 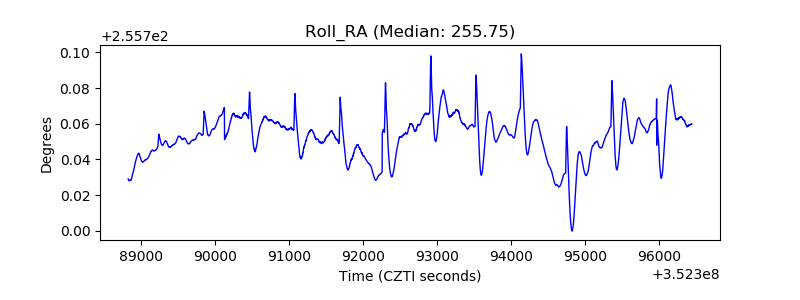 |
| Veto Counter |  |