| Param | Original file | Final file |
|---|---|---|
| Filename | modeM0/AS1T03_279T01_9000004218_29345cztM0_level2.evt | modeM0/AS1T03_279T01_9000004218_29345cztM0_level2_quad_clean.evt |
| Size (bytes) | 827,101,440 | 84,994,560 |
| Size | 788.8 MB | 81.1 MB |
| Events in quadrant A | 3,975,833 | 540,636 |
| Events in quadrant B | 5,067,454 | 541,530 |
| Events in quadrant C | 4,300,835 | 501,627 |
| Events in quadrant D | 11,189,812 | 459,855 |
| Mode SS | |||
|---|---|---|---|
| Quadrant | BADHDUFLAG | Total packets | Discarded packets |
| A | 0 | 154 | 0 |
| B | 0 | 154 | 0 |
| C | 0 | 154 | 0 |
| D | 0 | 154 | 0 |
| Mode M9 | |||
|---|---|---|---|
| Quadrant | BADHDUFLAG | Total packets | Discarded packets |
| A | 0 | 4 | 0 |
| B | 0 | 5 | 0 |
| C | 0 | 5 | 0 |
| D | 0 | 5 | 0 |
| Mode M0 | |||
|---|---|---|---|
| Quadrant | BADHDUFLAG | Total packets | Discarded packets |
| A | 0 | 16600 | 2 |
| B | 0 | 19874 | 2 |
| C | 0 | 17349 | 2 |
| D | 0 | 38603 | 2 |
| Quadrant | Total seconds | Saturated seconds | Saturation percentage |
|---|---|---|---|
| A | 7614 | 250 | 3.283425% |
| B | 7614 | 749 | 9.837142% |
| C | 7614 | 524 | 6.882059% |
| D | 7614 | 2766 | 36.327817% |
Noise dominated data is calculated using 1-second bins in cleaned event files. If a bin has >2000 counts, and if more than 50% of those come from <1% of pixels, then it is considered to be noise-dominated and hence unusable.
| Quadrant | # 1 sec bins | Bins with >0 counts | Bins with >2000 counts | High rate bins dominated by noise | Noise dominated (total time) | Noise dominated (detector-on time) | Marked lightcurve |
|---|---|---|---|---|---|---|---|
| A | 7834 | 7615 | 30 | 30 | 0.38% | 0.39% | 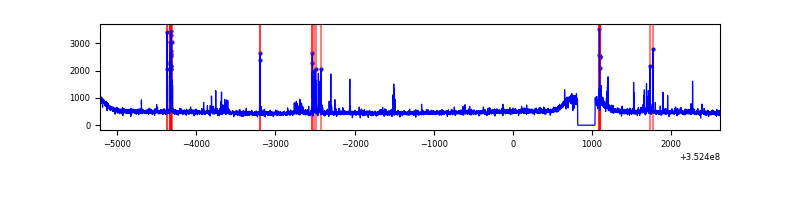 |
| B | 7834 | 7615 | 329 | 329 | 4.20% | 4.32% | 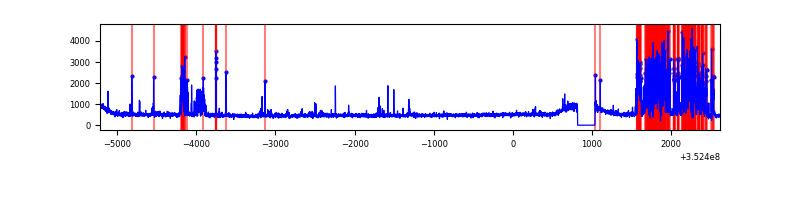 |
| C | 7834 | 7615 | 9 | 9 | 0.11% | 0.12% | 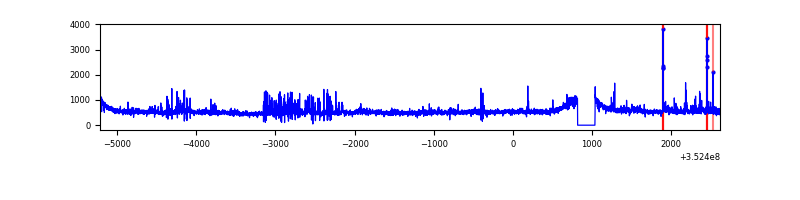 |
| D | 7834 | 7615 | 2083 | 2083 | 26.59% | 27.35% | 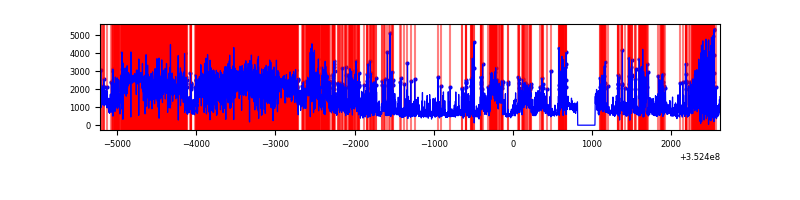 |
Top three noisy pixels from each quadrant. If the there are fewer than three noisy pixels in the level2.evt file, extra rows are filled as -1
| Pixel properties | Quadrant properties | ||||||
|---|---|---|---|---|---|---|---|
| Quadrant | DetID | PixID | Counts | Sigma | Mean | Median | Sigma |
| A | 15 | 174 | 223523 | 1137.74 | 965 | 944 | 195.6 |
| A | 0 | 13 | 21156 | 103.32 | 965 | 944 | 195.6 |
| A | 13 | 254 | 16231 | 78.14 | 965 | 944 | 195.6 |
| B | 5 | 172 | 1254737 | 7045.48 | 927 | 903 | 178.0 |
| B | 5 | 255 | 44453 | 244.71 | 927 | 903 | 178.0 |
| B | 10 | 245 | 22099 | 119.1 | 927 | 903 | 178.0 |
| C | 14 | 238 | 240992 | 1120.52 | 907 | 911 | 214.3 |
| C | 3 | 233 | 197206 | 916.16 | 907 | 911 | 214.3 |
| C | 14 | 254 | 139167 | 645.28 | 907 | 911 | 214.3 |
| D | 12 | 33 | 3846880 | 19768.44 | 807 | 783 | 194.6 |
| D | 1 | 52 | 1726088 | 8867.84 | 807 | 783 | 194.6 |
| D | 7 | 80 | 1359861 | 6985.48 | 807 | 783 | 194.6 |
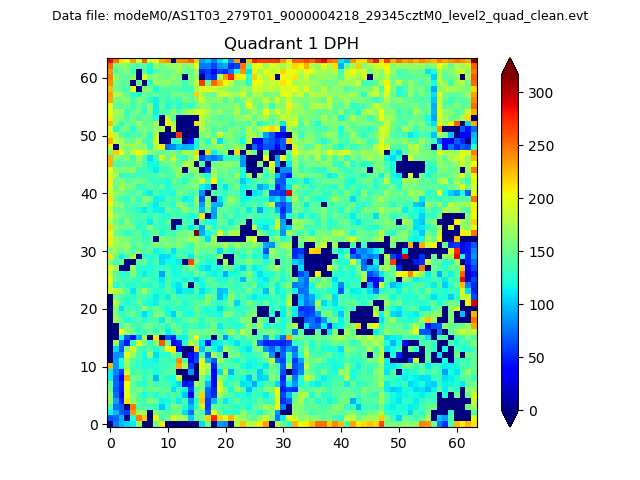
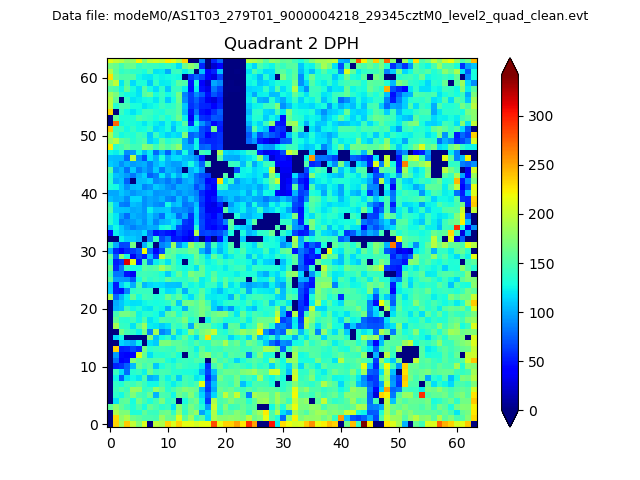
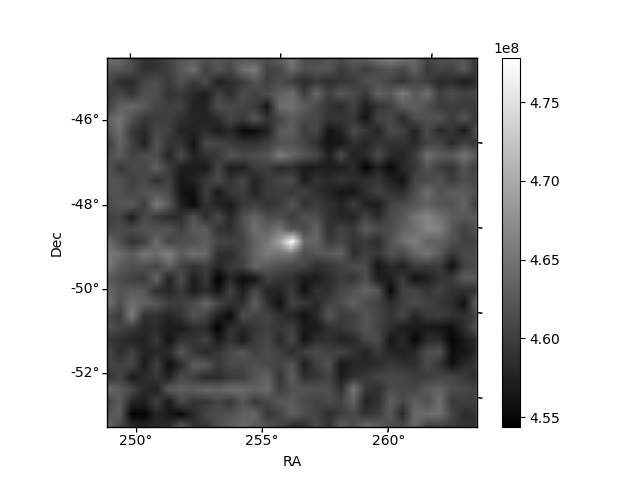
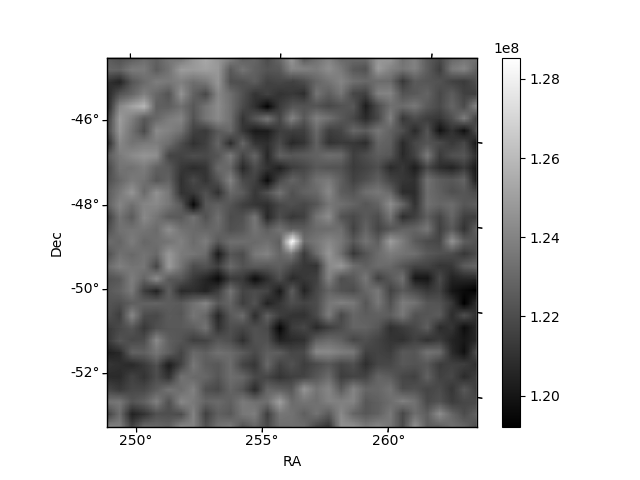
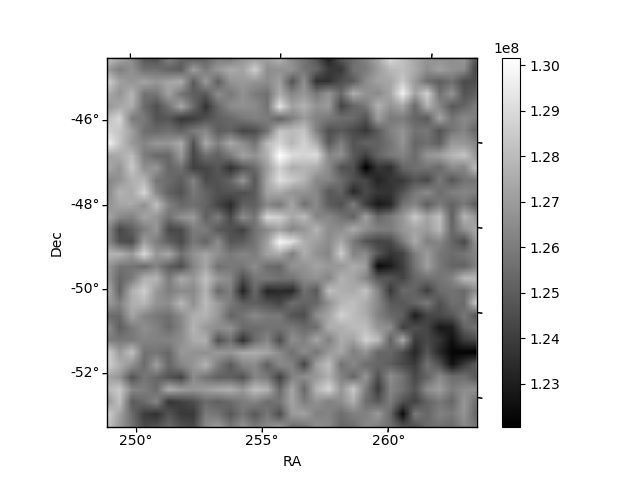
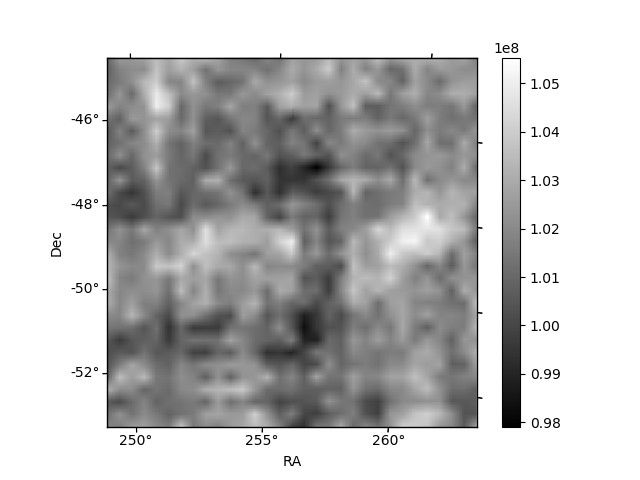
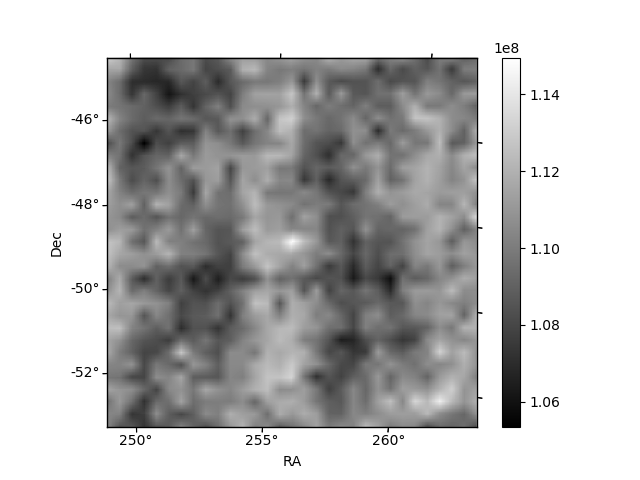
Histogram calculated using DETX and DETY for each event in the final _common_clean file
| Quadrant A |  |
 |
Quadrant B |
|---|---|---|---|
| Quadrant D | 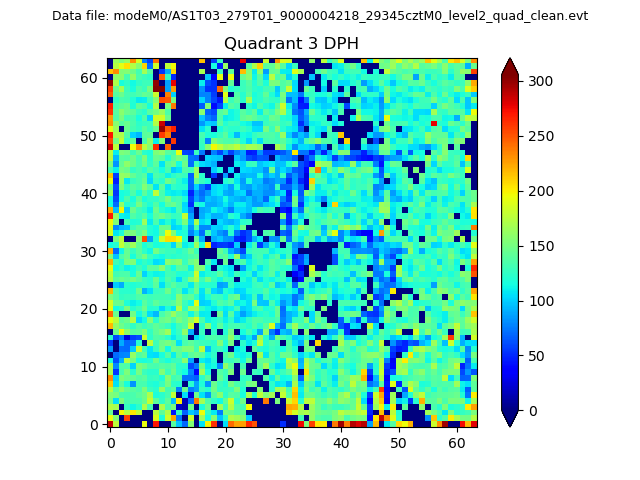 |
 |
Quadrant C |
| Plot type | Count rate plots | Images |
|---|---|---|
| Comparison with Poisson distribution Blue bars denote a histogram of data divided into 1 sec bins. Red curve is a Poisson curve with rate = median count rate of data. |
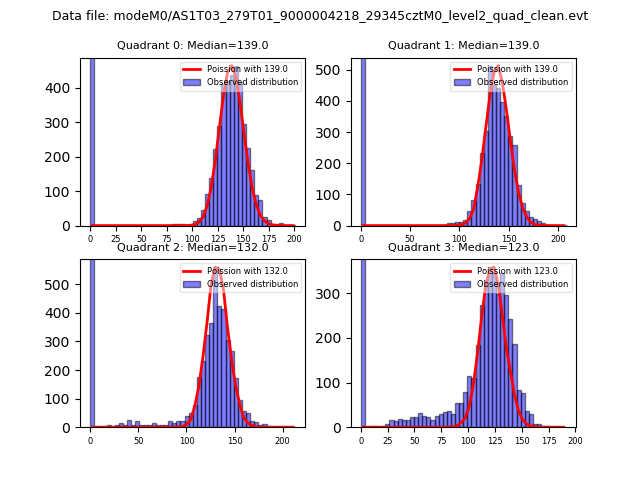 |
 |
| Quadrant-wise count rates Data is divided into 100 sec bins |
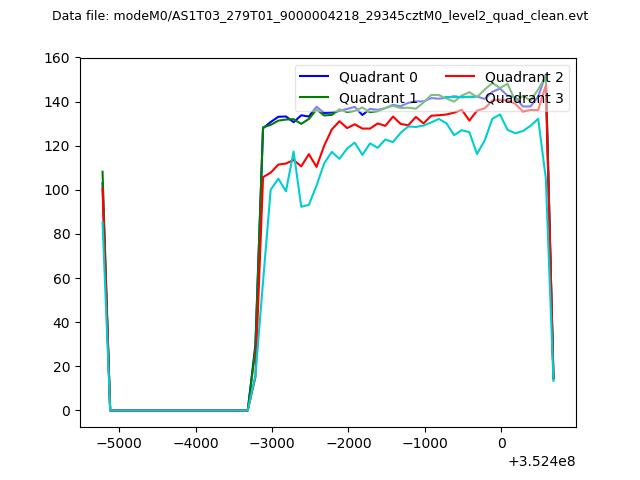 |
|
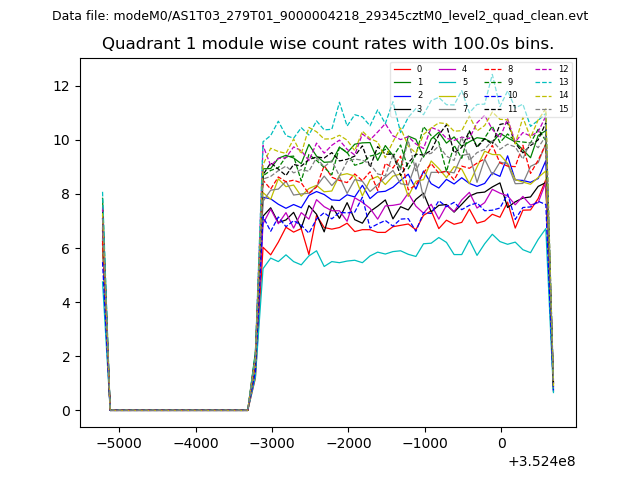
| Module-wise count rates for Quadrant A Data is divided into 100 sec bins |
 |
 |
| Module-wise count rates for Quadrant B Data is divided into 100 sec bins |
 |
 |
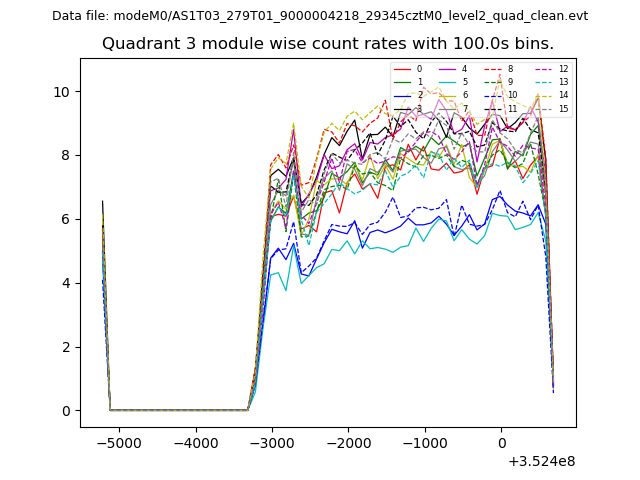
| Module-wise count rates for Quadrant C Data is divided into 100 sec bins |
 |
 |
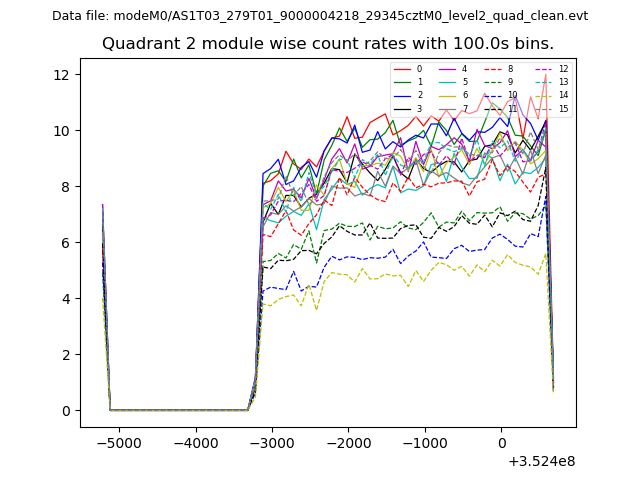
| Module-wise count rates for Quadrant D Data is divided into 100 sec bins |
 |
 |
| Parameter | Plot |
|---|---|
| CZT HV Monitor | 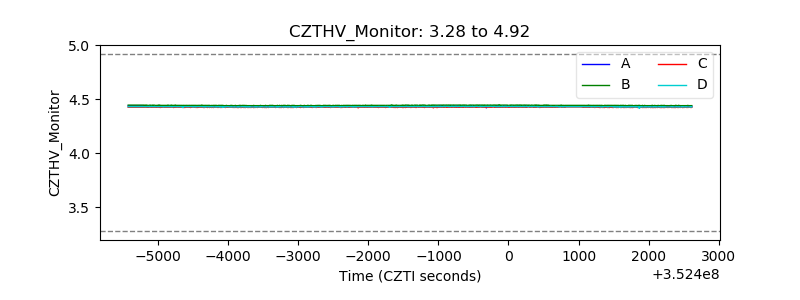 |
| D_VDD | 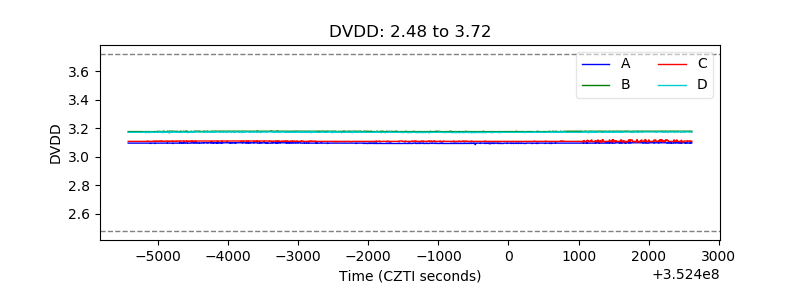 |
| Temperature 1 | 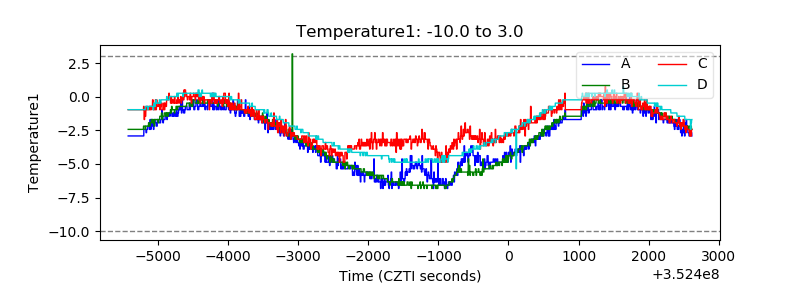 |
| Veto HV Monitor | 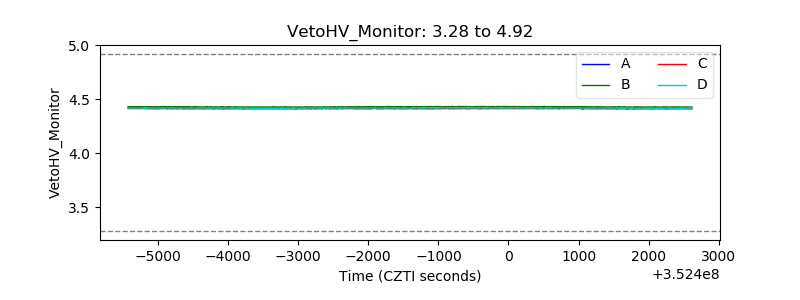 |
| Veto LLD | 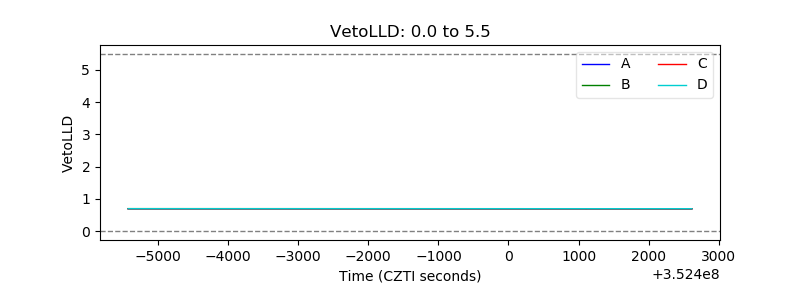 |
| Alpha Counter | 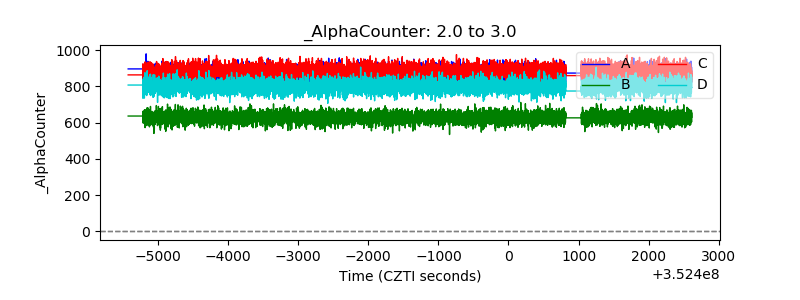 |
| _CPM_Rate | 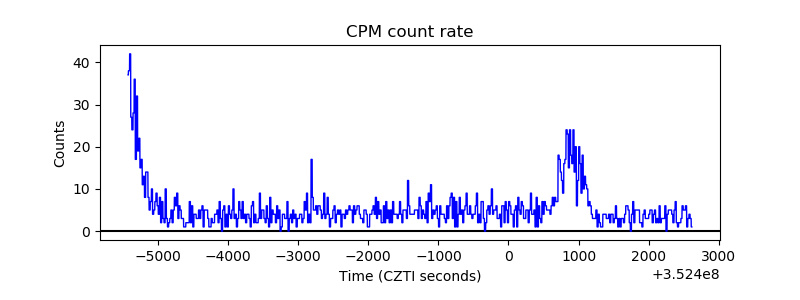 |
| CZT Counter | 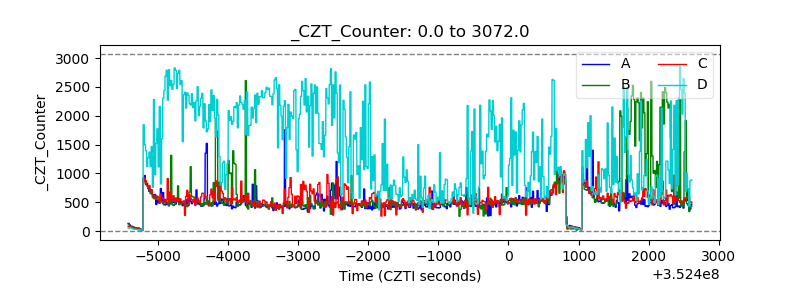 |
| +2.5 Volts monitor |  |
| +5 Volts monitor |  |
| _ROLL_ROT |  |
| _Roll_DEC | 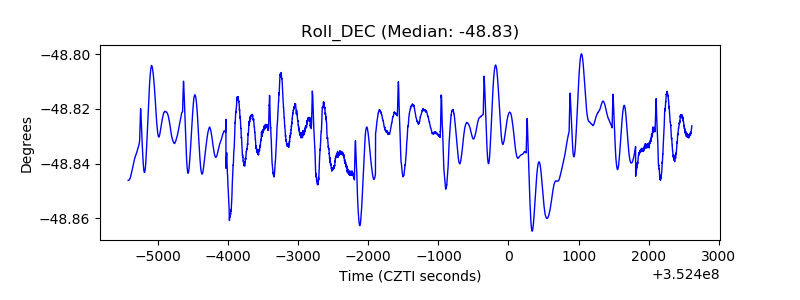 |
| _Roll_RA | 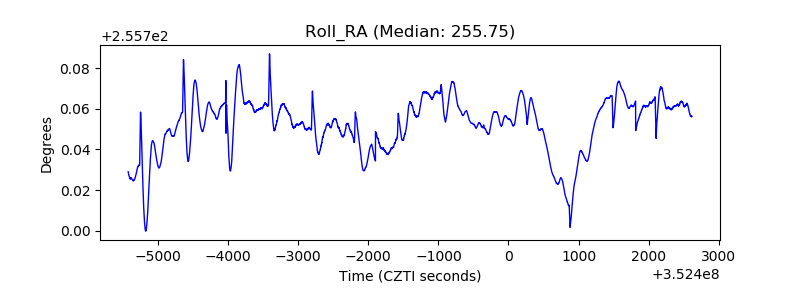 |
| Veto Counter |  |