| Param | Original file | Final file |
|---|---|---|
| Filename | modeM0/AS1T03_279T01_9000004218_29346cztM0_level2.evt | modeM0/AS1T03_279T01_9000004218_29346cztM0_level2_quad_clean.evt |
| Size (bytes) | 788,996,160 | 88,375,680 |
| Size | 752.4 MB | 84.3 MB |
| Events in quadrant A | 4,053,711 | 570,182 |
| Events in quadrant B | 4,930,160 | 575,964 |
| Events in quadrant C | 5,841,965 | 537,707 |
| Events in quadrant D | 8,567,699 | 475,628 |
| Mode SS | |||
|---|---|---|---|
| Quadrant | BADHDUFLAG | Total packets | Discarded packets |
| A | 0 | 150 | 0 |
| B | 0 | 150 | 0 |
| C | 0 | 150 | 0 |
| D | 0 | 150 | 0 |
| Mode M9 | |||
|---|---|---|---|
| Quadrant | BADHDUFLAG | Total packets | Discarded packets |
| A | 0 | 3 | 0 |
| B | 0 | 3 | 0 |
| C | 0 | 3 | 0 |
| D | 0 | 3 | 0 |
| Mode M0 | |||
|---|---|---|---|
| Quadrant | BADHDUFLAG | Total packets | Discarded packets |
| A | 0 | 16754 | 1 |
| B | 0 | 19405 | 1 |
| C | 0 | 22462 | 1 |
| D | 0 | 30646 | 1 |
| Quadrant | Total seconds | Saturated seconds | Saturation percentage |
|---|---|---|---|
| A | 7419 | 216 | 2.911444% |
| B | 7419 | 676 | 9.111740% |
| C | 7420 | 667 | 8.989218% |
| D | 7420 | 1438 | 19.380054% |
Noise dominated data is calculated using 1-second bins in cleaned event files. If a bin has >2000 counts, and if more than 50% of those come from <1% of pixels, then it is considered to be noise-dominated and hence unusable.
| Quadrant | # 1 sec bins | Bins with >0 counts | Bins with >2000 counts | High rate bins dominated by noise | Noise dominated (total time) | Noise dominated (detector-on time) | Marked lightcurve |
|---|---|---|---|---|---|---|---|
| A | 7694 | 7420 | 96 | 96 | 1.25% | 1.29% | 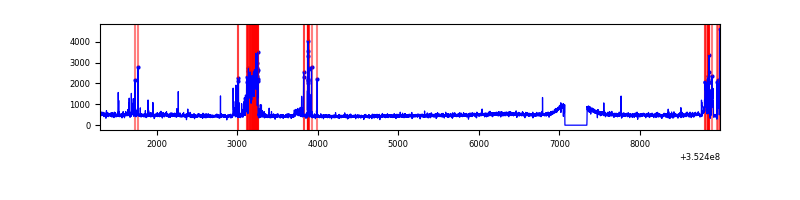 |
| B | 7694 | 7420 | 343 | 343 | 4.46% | 4.62% | 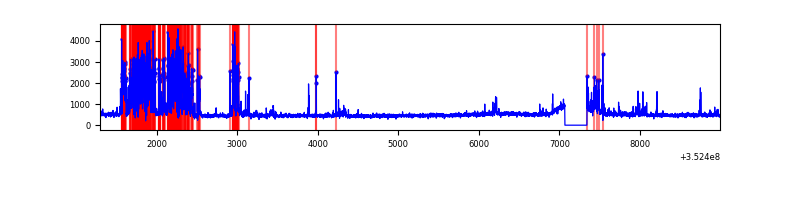 |
| C | 7695 | 7421 | 23 | 23 | 0.30% | 0.31% | 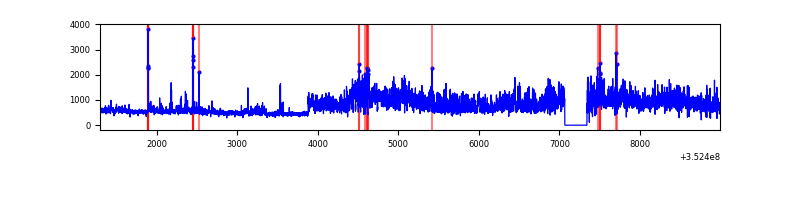 |
| D | 7695 | 7421 | 1057 | 1057 | 13.74% | 14.24% | 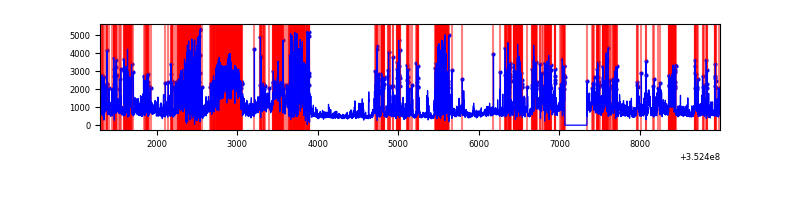 |
Top three noisy pixels from each quadrant. If the there are fewer than three noisy pixels in the level2.evt file, extra rows are filled as -1
| Pixel properties | Quadrant properties | ||||||
|---|---|---|---|---|---|---|---|
| Quadrant | DetID | PixID | Counts | Sigma | Mean | Median | Sigma |
| A | 15 | 174 | 541369 | 2928.34 | 908 | 887 | 184.6 |
| A | 13 | 254 | 16365 | 83.86 | 908 | 887 | 184.6 |
| A | 3 | 137 | 8691 | 42.28 | 908 | 887 | 184.6 |
| B | 5 | 172 | 1193066 | 7157.69 | 871 | 847 | 166.6 |
| B | 10 | 245 | 179552 | 1072.89 | 871 | 847 | 166.6 |
| B | 5 | 255 | 42549 | 250.37 | 871 | 847 | 166.6 |
| C | 10 | 9 | 2018222 | 10258.08 | 832 | 837 | 196.7 |
| C | 14 | 238 | 227600 | 1153.05 | 832 | 837 | 196.7 |
| C | 14 | 254 | 135477 | 684.62 | 832 | 837 | 196.7 |
| D | 7 | 80 | 2960274 | 15369.04 | 800 | 778 | 192.6 |
| D | 12 | 33 | 1036199 | 5377.07 | 800 | 778 | 192.6 |
| D | 8 | 195 | 646096 | 3351.22 | 800 | 778 | 192.6 |
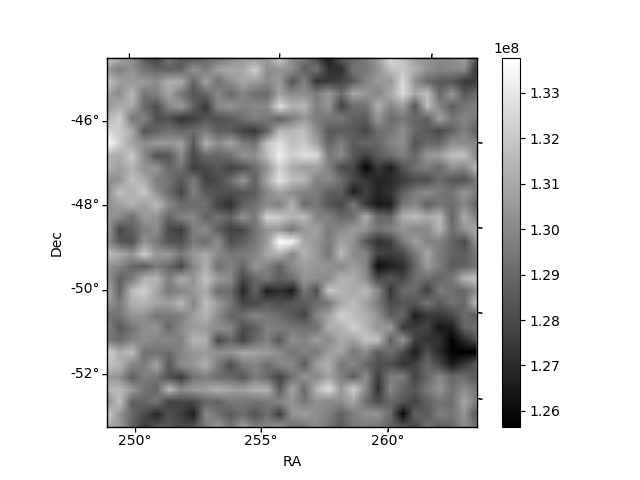
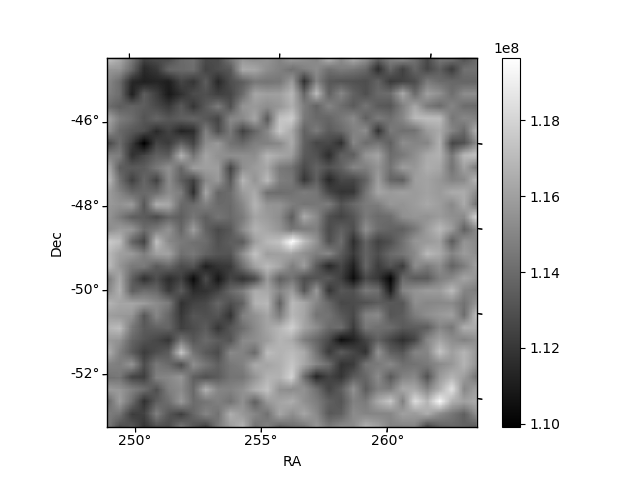
Histogram calculated using DETX and DETY for each event in the final _common_clean file
| Quadrant A |  |
 |
Quadrant B |
|---|---|---|---|
| Quadrant D |  |
 |
Quadrant C |
| Plot type | Count rate plots | Images |
|---|---|---|
| Comparison with Poisson distribution Blue bars denote a histogram of data divided into 1 sec bins. Red curve is a Poisson curve with rate = median count rate of data. |
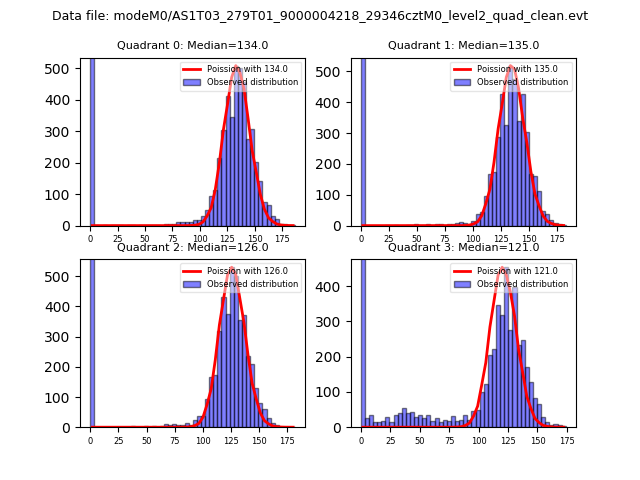 |
 |
| Quadrant-wise count rates Data is divided into 100 sec bins |
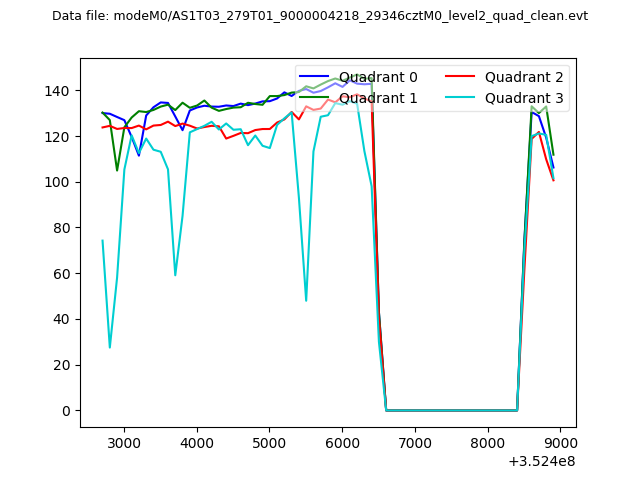 |
|
| Module-wise count rates for Quadrant A Data is divided into 100 sec bins |
 |
 |
| Module-wise count rates for Quadrant B Data is divided into 100 sec bins |
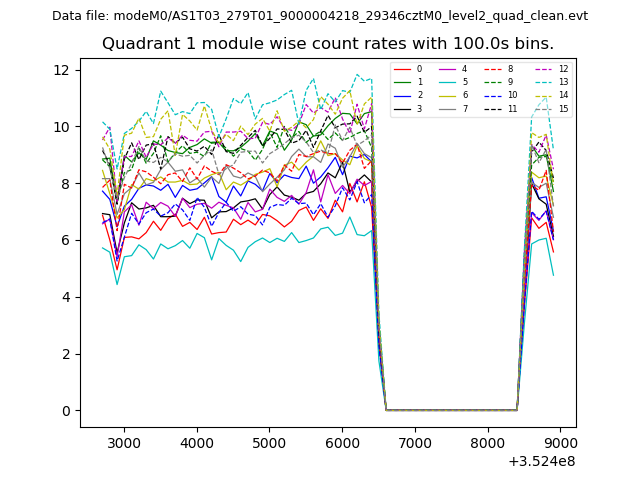 |
 |
| Module-wise count rates for Quadrant C Data is divided into 100 sec bins |
 |
 |
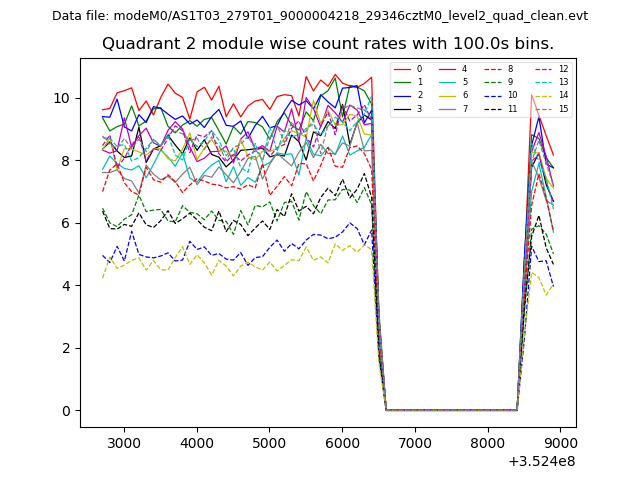
| Module-wise count rates for Quadrant D Data is divided into 100 sec bins |
 |
 |
| Parameter | Plot |
|---|---|
| CZT HV Monitor | 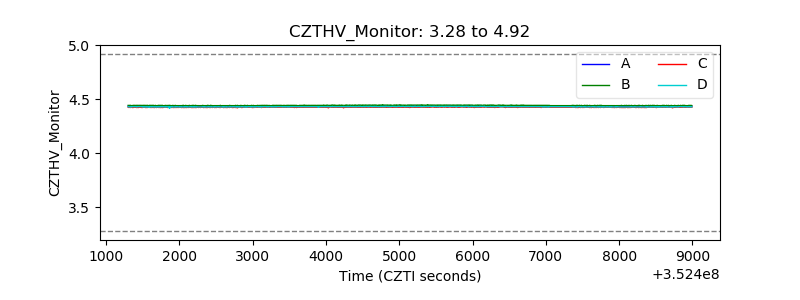 |
| D_VDD |  |
| Temperature 1 |  |
| Veto HV Monitor |  |
| Veto LLD |  |
| Alpha Counter | 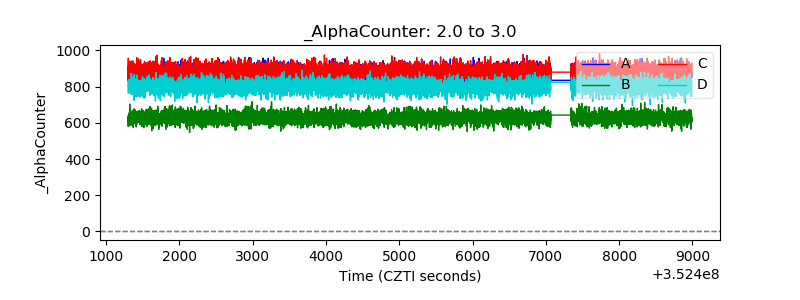 |
| _CPM_Rate | 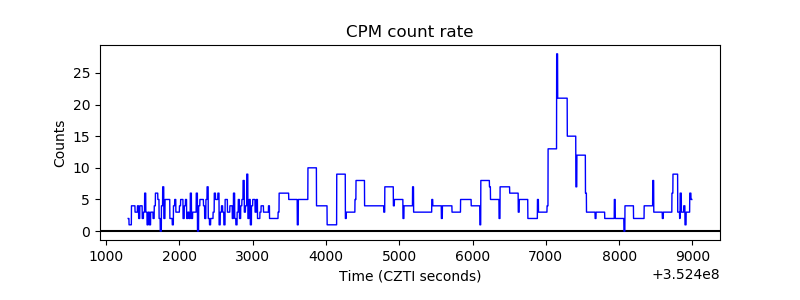 |
| CZT Counter |  |
| +2.5 Volts monitor |  |
| +5 Volts monitor |  |
| _ROLL_ROT |  |
| _Roll_DEC |  |
| _Roll_RA |  |
| Veto Counter |  |