| Param | Original file | Final file |
|---|---|---|
| Filename | modeM0/AS1T03_279T01_9000004218_29349cztM0_level2.evt | modeM0/AS1T03_279T01_9000004218_29349cztM0_level2_quad_clean.evt |
| Size (bytes) | 1,472,679,360 | 208,751,040 |
| Size | 1.4 GB | 199.1 MB |
| Events in quadrant A | 6,929,774 | 1,415,742 |
| Events in quadrant B | 7,716,991 | 1,419,036 |
| Events in quadrant C | 10,560,261 | 1,329,821 |
| Events in quadrant D | 18,430,405 | 1,169,300 |
| Mode SS | |||
|---|---|---|---|
| Quadrant | BADHDUFLAG | Total packets | Discarded packets |
| A | 0 | 288 | 0 |
| B | 0 | 288 | 0 |
| C | 0 | 288 | 0 |
| D | 0 | 288 | 0 |
| Mode M9 | |||
|---|---|---|---|
| Quadrant | BADHDUFLAG | Total packets | Discarded packets |
| A | 0 | 12 | 0 |
| B | 0 | 12 | 0 |
| C | 0 | 12 | 0 |
| D | 0 | 12 | 0 |
| Mode M0 | |||
|---|---|---|---|
| Quadrant | BADHDUFLAG | Total packets | Discarded packets |
| A | 0 | 29890 | 2 |
| B | 0 | 32341 | 2 |
| C | 0 | 41317 | 2 |
| D | 0 | 64713 | 9 |
| Quadrant | Total seconds | Saturated seconds | Saturation percentage |
|---|---|---|---|
| A | 14314 | 122 | 0.852312% |
| B | 14314 | 250 | 1.746542% |
| C | 14314 | 705 | 4.925248% |
| D | 14314 | 3436 | 24.004471% |
Noise dominated data is calculated using 1-second bins in cleaned event files. If a bin has >2000 counts, and if more than 50% of those come from <1% of pixels, then it is considered to be noise-dominated and hence unusable.
| Quadrant | # 1 sec bins | Bins with >0 counts | Bins with >2000 counts | High rate bins dominated by noise | Noise dominated (total time) | Noise dominated (detector-on time) | Marked lightcurve |
|---|---|---|---|---|---|---|---|
| A | 15454 | 14316 | 30 | 30 | 0.19% | 0.21% | 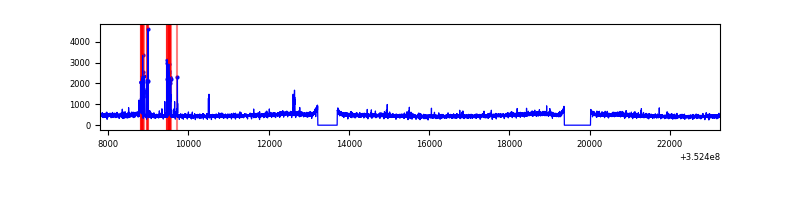 |
| B | 15454 | 14316 | 57 | 57 | 0.37% | 0.40% | 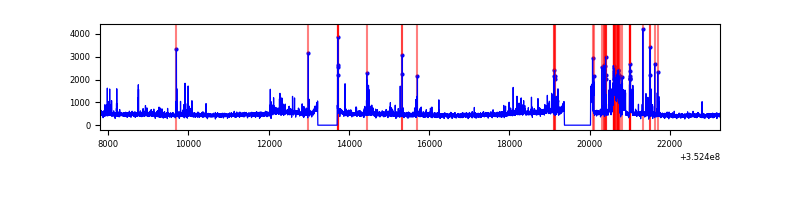 |
| C | 15454 | 14316 | 2 | 2 | 0.01% | 0.01% | 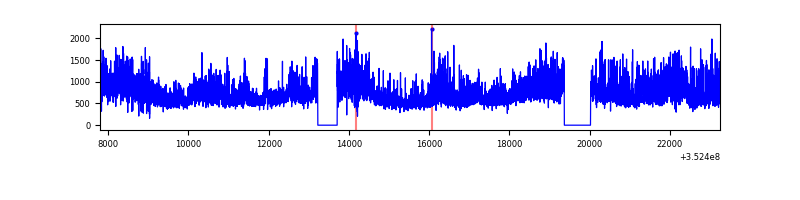 |
| D | 15454 | 14316 | 2686 | 2686 | 17.38% | 18.76% | 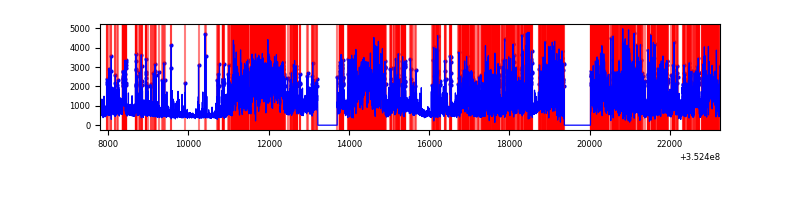 |
Top three noisy pixels from each quadrant. If the there are fewer than three noisy pixels in the level2.evt file, extra rows are filled as -1
| Pixel properties | Quadrant properties | ||||||
|---|---|---|---|---|---|---|---|
| Quadrant | DetID | PixID | Counts | Sigma | Mean | Median | Sigma |
| A | 15 | 174 | 269161 | 784.56 | 1712 | 1680 | 340.9 |
| A | 0 | 13 | 38034 | 106.63 | 1712 | 1680 | 340.9 |
| A | 13 | 254 | 29936 | 82.88 | 1712 | 1680 | 340.9 |
| B | 10 | 245 | 791579 | 2458.46 | 1700 | 1658 | 321.3 |
| B | 3 | 209 | 79663 | 242.77 | 1700 | 1658 | 321.3 |
| B | 5 | 172 | 56806 | 171.64 | 1700 | 1658 | 321.3 |
| C | 10 | 9 | 3507910 | 9236.18 | 1619 | 1633 | 379.6 |
| C | 14 | 238 | 366399 | 960.86 | 1619 | 1633 | 379.6 |
| C | 14 | 254 | 160299 | 417.96 | 1619 | 1633 | 379.6 |
| D | 12 | 33 | 4325340 | 12104.61 | 1493 | 1456 | 357.2 |
| D | 7 | 80 | 3917086 | 10961.71 | 1493 | 1456 | 357.2 |
| D | 1 | 52 | 2966880 | 8301.63 | 1493 | 1456 | 357.2 |
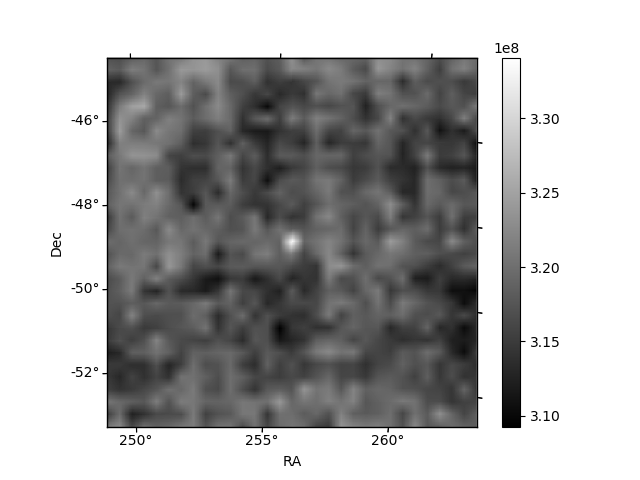
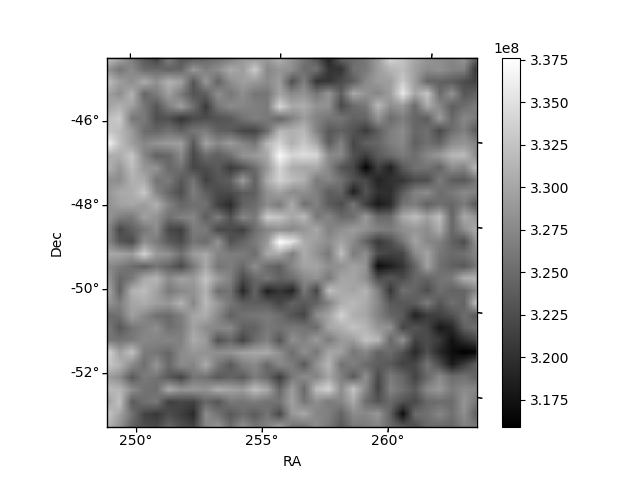
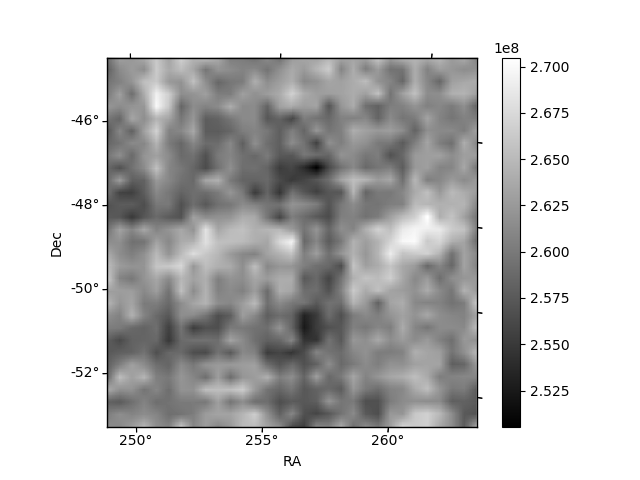
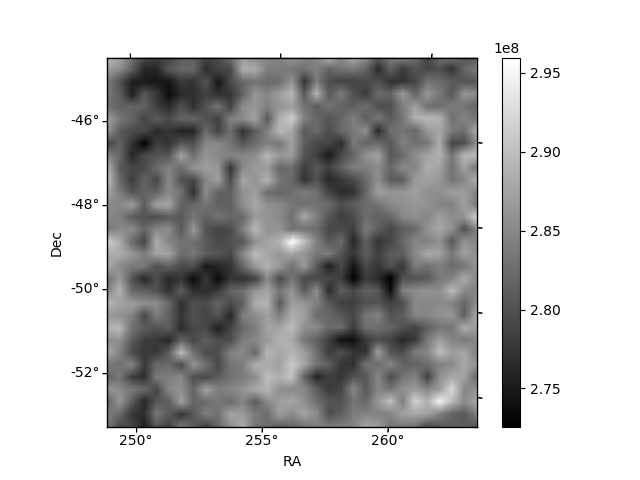
Histogram calculated using DETX and DETY for each event in the final _common_clean file
| Quadrant A | 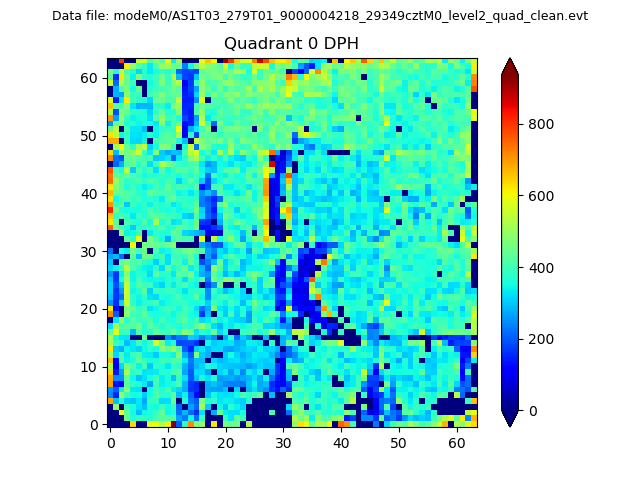 |
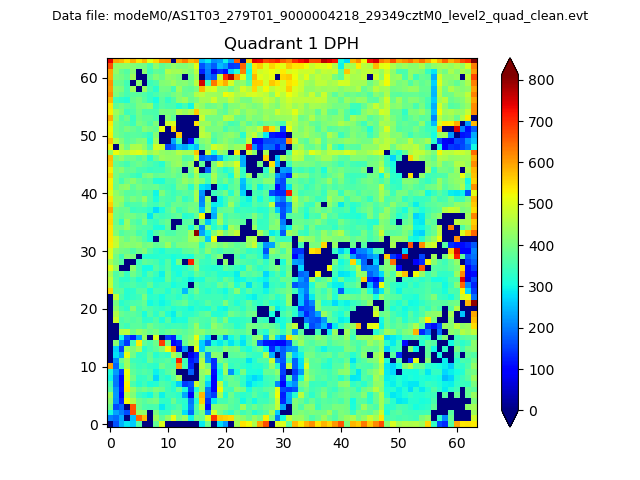 |
Quadrant B |
|---|---|---|---|
| Quadrant D | 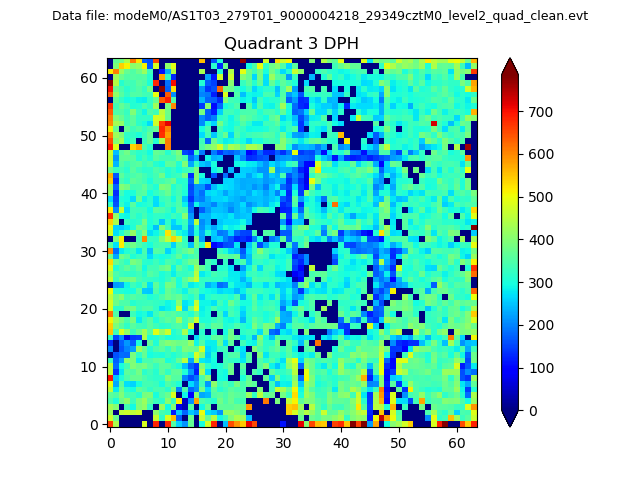 |
 |
Quadrant C |
| Plot type | Count rate plots | Images |
|---|---|---|
| Comparison with Poisson distribution Blue bars denote a histogram of data divided into 1 sec bins. Red curve is a Poisson curve with rate = median count rate of data. |
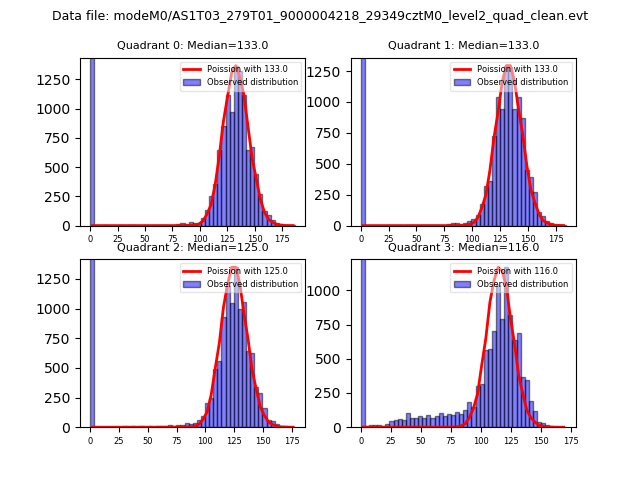 |
 |
| Quadrant-wise count rates Data is divided into 100 sec bins |
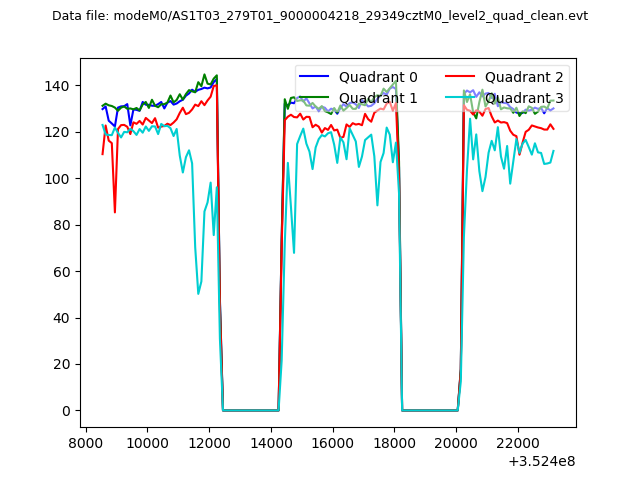 |
|
| Module-wise count rates for Quadrant A Data is divided into 100 sec bins |
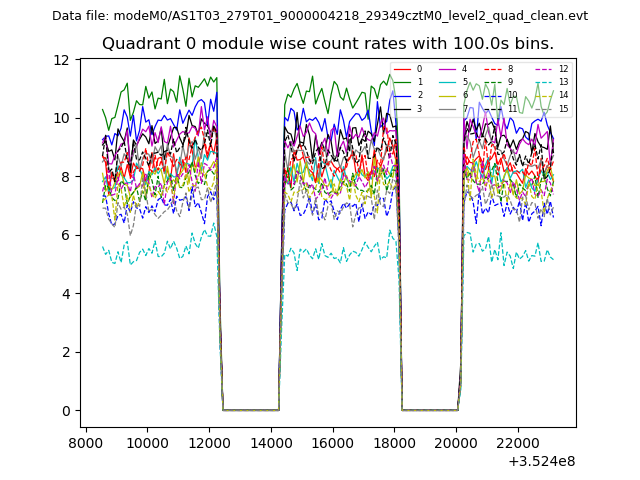 |
 |
| Module-wise count rates for Quadrant B Data is divided into 100 sec bins |
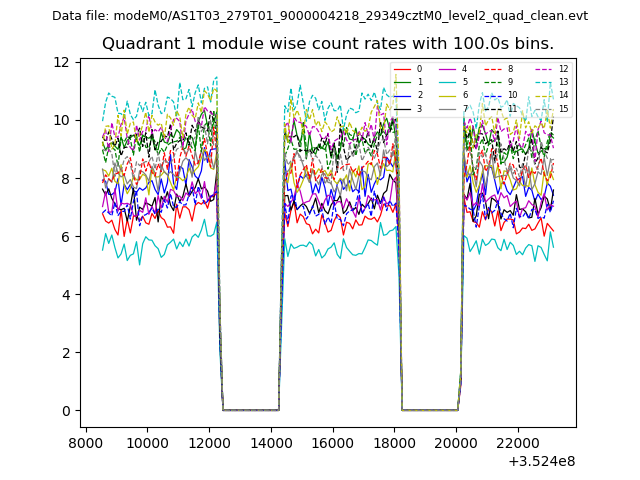 |
 |
| Module-wise count rates for Quadrant C Data is divided into 100 sec bins |
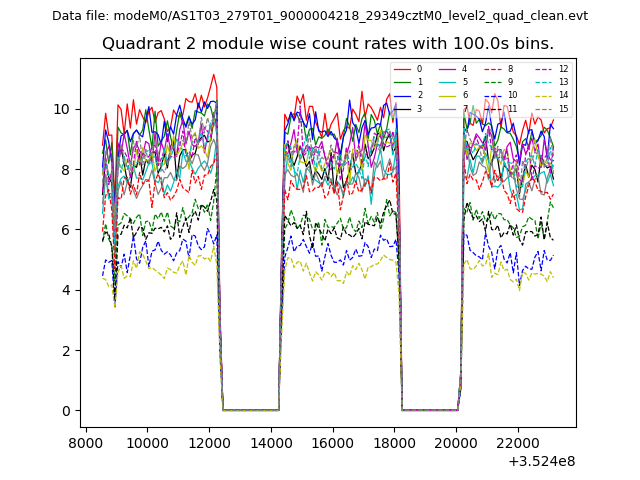 |
 |
| Module-wise count rates for Quadrant D Data is divided into 100 sec bins |
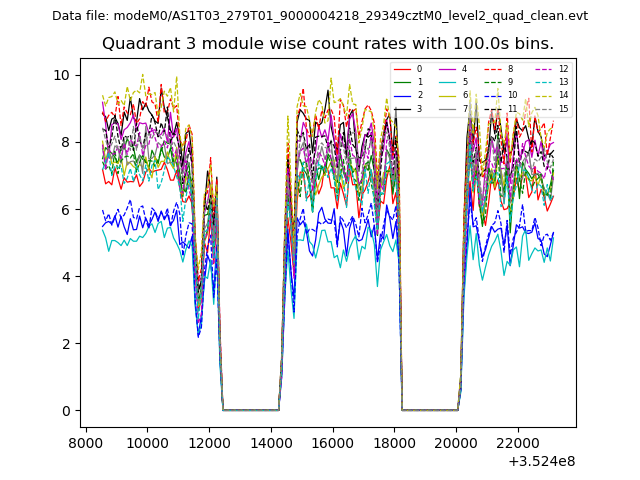 |
 |
| Parameter | Plot |
|---|---|
| CZT HV Monitor | 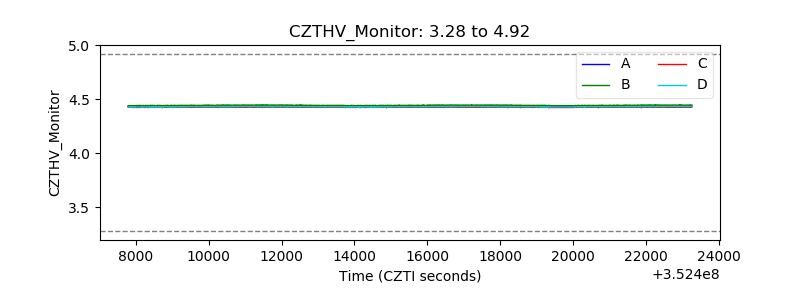 |
| D_VDD | 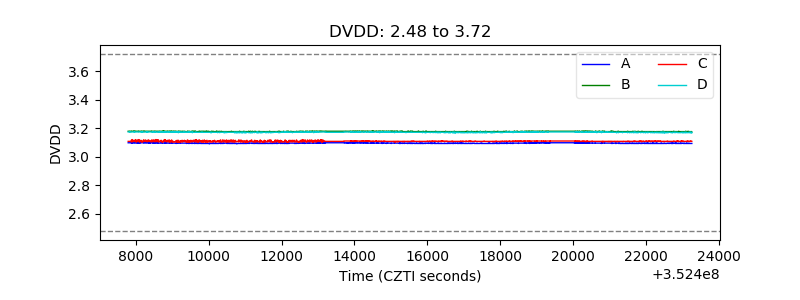 |
| Temperature 1 | 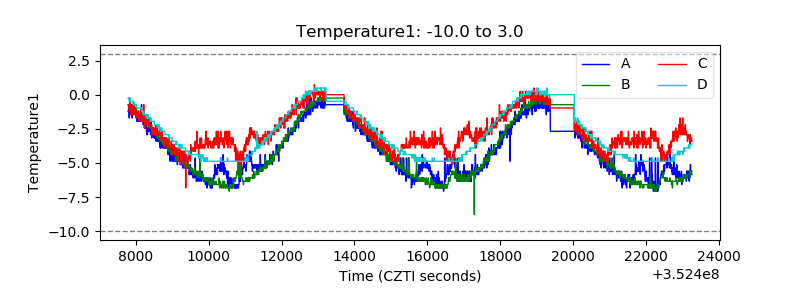 |
| Veto HV Monitor | 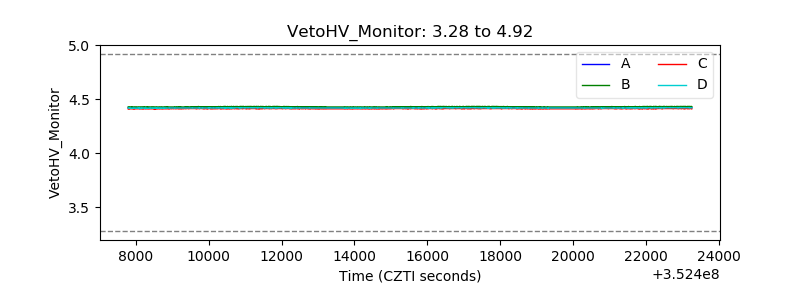 |
| Veto LLD |  |
| Alpha Counter | 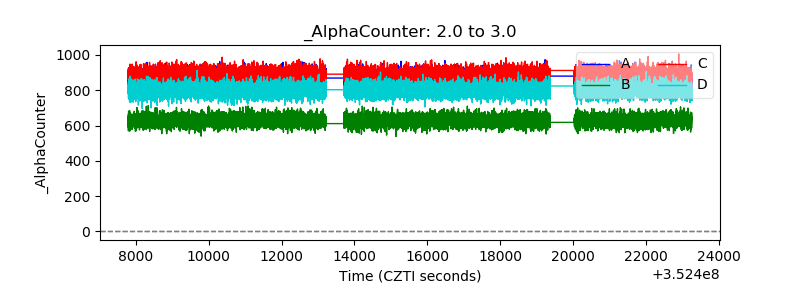 |
| _CPM_Rate | 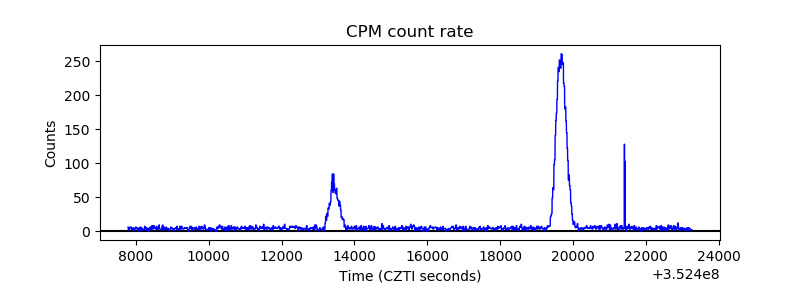 |
| CZT Counter | 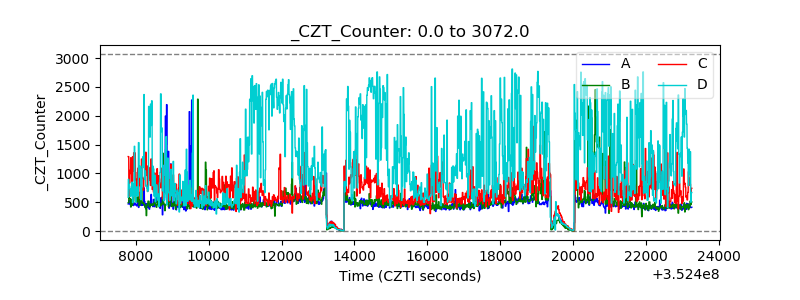 |
| +2.5 Volts monitor |  |
| +5 Volts monitor | 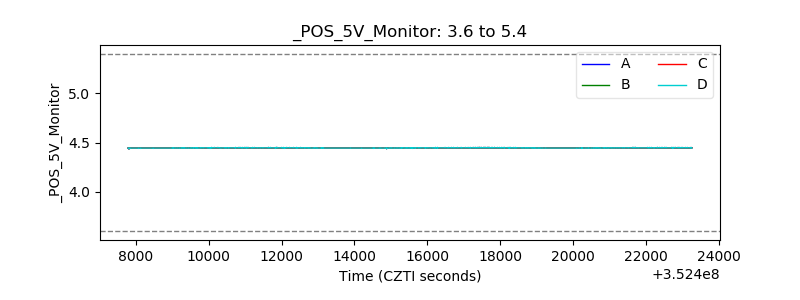 |
| _ROLL_ROT | 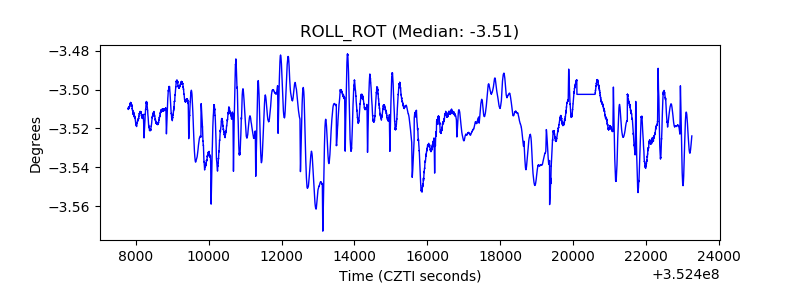 |
| _Roll_DEC | 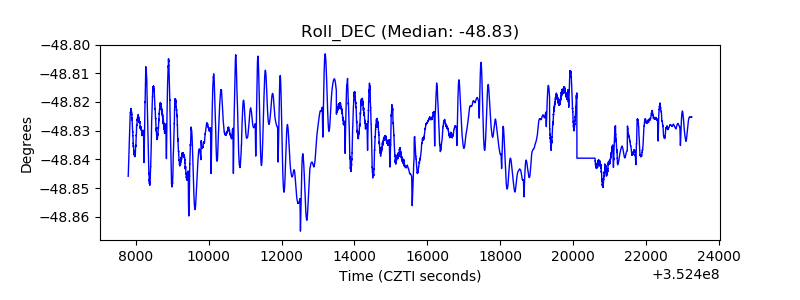 |
| _Roll_RA |  |
| Veto Counter | 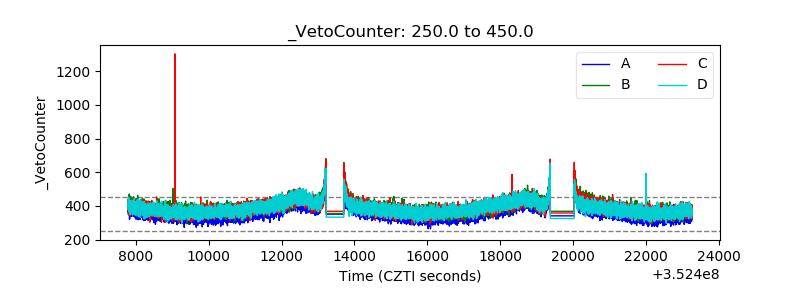 |