| Param | Original file | Final file |
|---|---|---|
| Filename | modeM0/AS1T03_279T01_9000004218_29350cztM0_level2.evt | modeM0/AS1T03_279T01_9000004218_29350cztM0_level2_quad_clean.evt |
| Size (bytes) | 940,976,640 | 131,883,840 |
| Size | 897.4 MB | 125.8 MB |
| Events in quadrant A | 4,581,371 | 867,391 |
| Events in quadrant B | 4,890,427 | 881,527 |
| Events in quadrant C | 7,059,588 | 834,071 |
| Events in quadrant D | 11,326,708 | 753,705 |
| Mode SS | |||
|---|---|---|---|
| Quadrant | BADHDUFLAG | Total packets | Discarded packets |
| A | 0 | 194 | 0 |
| B | 0 | 194 | 0 |
| C | 0 | 194 | 0 |
| D | 0 | 194 | 0 |
| Mode M9 | |||
|---|---|---|---|
| Quadrant | BADHDUFLAG | Total packets | Discarded packets |
| A | 0 | 18 | 0 |
| B | 0 | 18 | 0 |
| C | 0 | 18 | 0 |
| D | 0 | 18 | 0 |
| Mode M0 | |||
|---|---|---|---|
| Quadrant | BADHDUFLAG | Total packets | Discarded packets |
| A | 0 | 19521 | 2 |
| B | 0 | 20569 | 4 |
| C | 0 | 27724 | 2 |
| D | 0 | 40202 | 2 |
| Quadrant | Total seconds | Saturated seconds | Saturation percentage |
|---|---|---|---|
| A | 9477 | 39 | 0.411523% |
| B | 9476 | 76 | 0.802026% |
| C | 9477 | 339 | 3.577081% |
| D | 9477 | 2113 | 22.296085% |
Noise dominated data is calculated using 1-second bins in cleaned event files. If a bin has >2000 counts, and if more than 50% of those come from <1% of pixels, then it is considered to be noise-dominated and hence unusable.
| Quadrant | # 1 sec bins | Bins with >0 counts | Bins with >2000 counts | High rate bins dominated by noise | Noise dominated (total time) | Noise dominated (detector-on time) | Marked lightcurve |
|---|---|---|---|---|---|---|---|
| A | 11257 | 9479 | 6 | 6 | 0.05% | 0.06% | 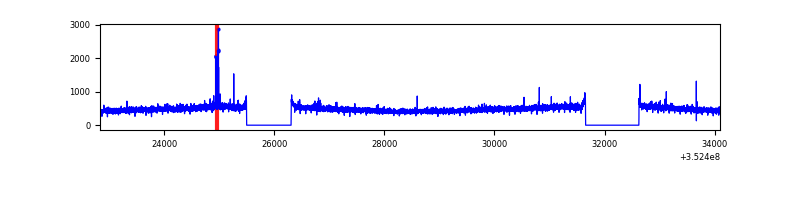 |
| B | 11257 | 9479 | 3 | 3 | 0.03% | 0.03% | 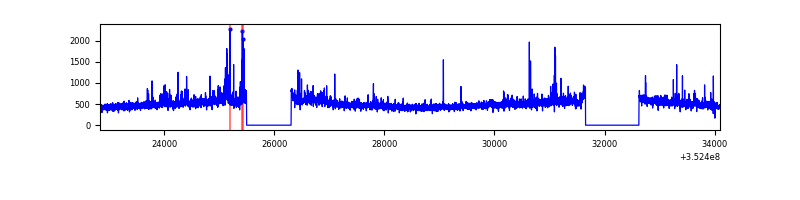 |
| C | 11257 | 9479 | 31 | 31 | 0.28% | 0.33% | 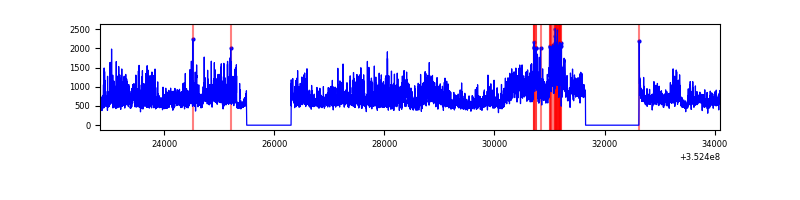 |
| D | 11257 | 9479 | 1641 | 1641 | 14.58% | 17.31% | 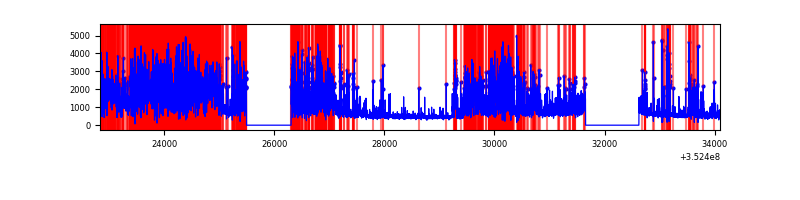 |
Top three noisy pixels from each quadrant. If the there are fewer than three noisy pixels in the level2.evt file, extra rows are filled as -1
| Pixel properties | Quadrant properties | ||||||
|---|---|---|---|---|---|---|---|
| Quadrant | DetID | PixID | Counts | Sigma | Mean | Median | Sigma |
| A | 0 | 13 | 32730 | 133.87 | 1177 | 1155 | 235.9 |
| A | 13 | 254 | 18641 | 74.14 | 1177 | 1155 | 235.9 |
| A | 3 | 137 | 11188 | 42.54 | 1177 | 1155 | 235.9 |
| B | 10 | 245 | 191967 | 862.21 | 1171 | 1142 | 221.3 |
| B | 0 | 229 | 44979 | 198.07 | 1171 | 1142 | 221.3 |
| B | 12 | 111 | 27121 | 117.38 | 1171 | 1142 | 221.3 |
| C | 10 | 9 | 1760664 | 6648.46 | 1130 | 1137 | 264.7 |
| C | 3 | 233 | 651358 | 2456.89 | 1130 | 1137 | 264.7 |
| C | 14 | 238 | 188809 | 709.13 | 1130 | 1137 | 264.7 |
| D | 1 | 52 | 3551588 | 14119.94 | 1049 | 1020 | 251.5 |
| D | 7 | 80 | 2682458 | 10663.57 | 1049 | 1020 | 251.5 |
| D | 8 | 195 | 463348 | 1838.59 | 1049 | 1020 | 251.5 |
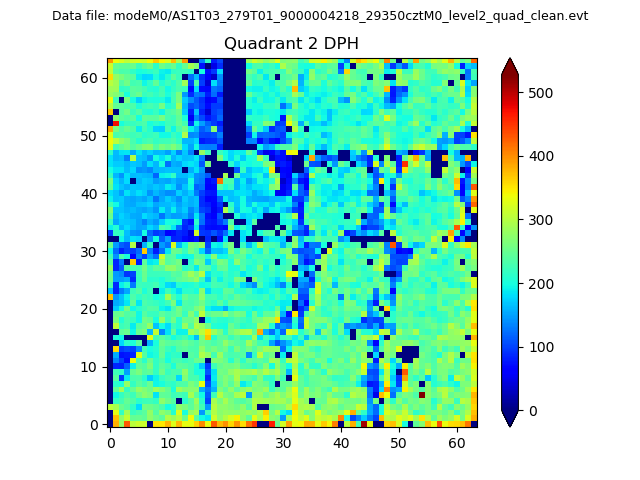
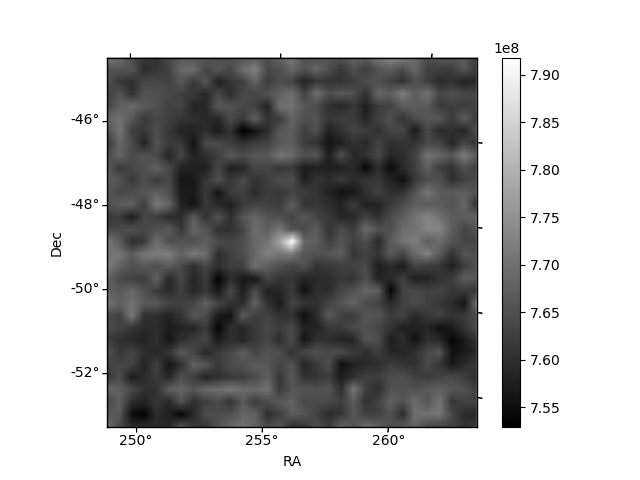
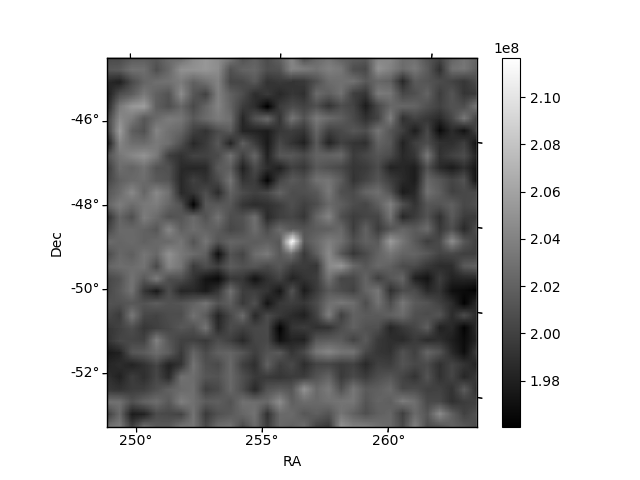
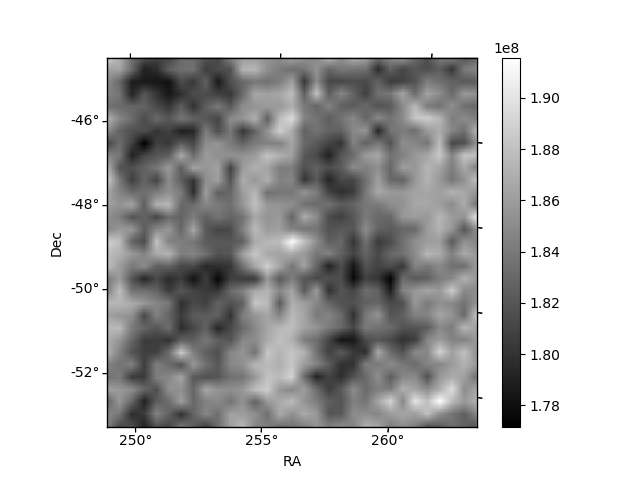
Histogram calculated using DETX and DETY for each event in the final _common_clean file
| Quadrant A | 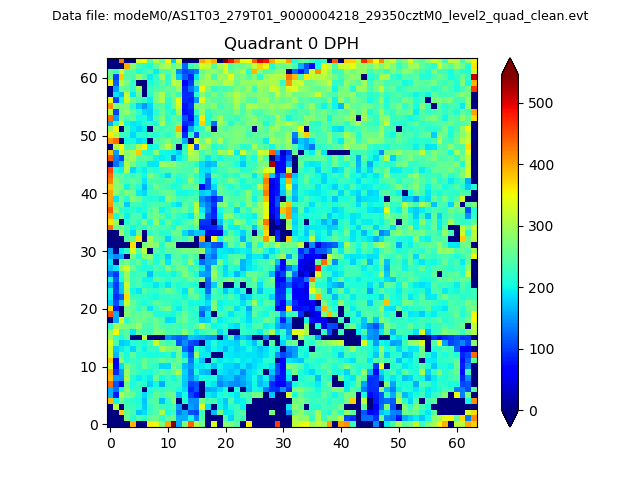 |
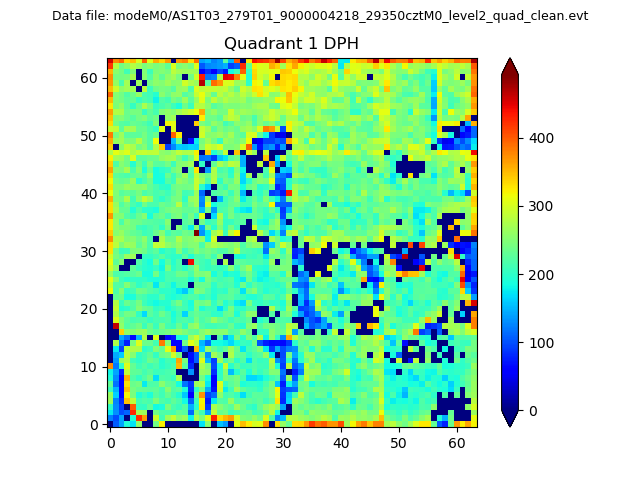 |
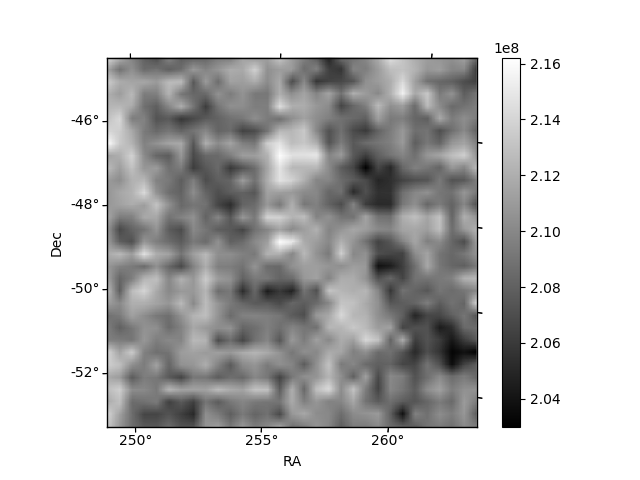
Quadrant B |
|---|---|---|---|
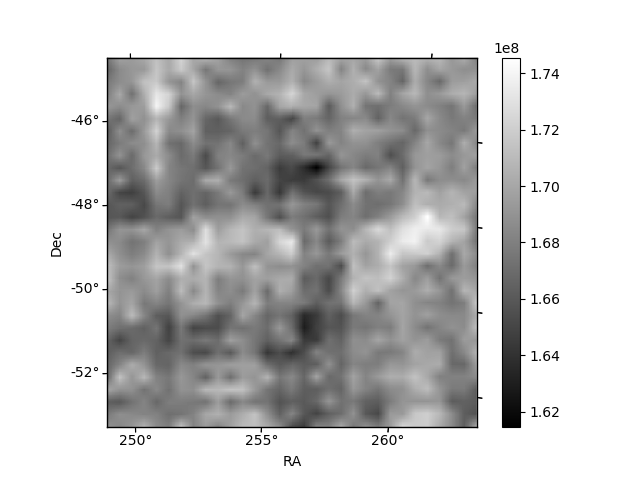
| Quadrant D | 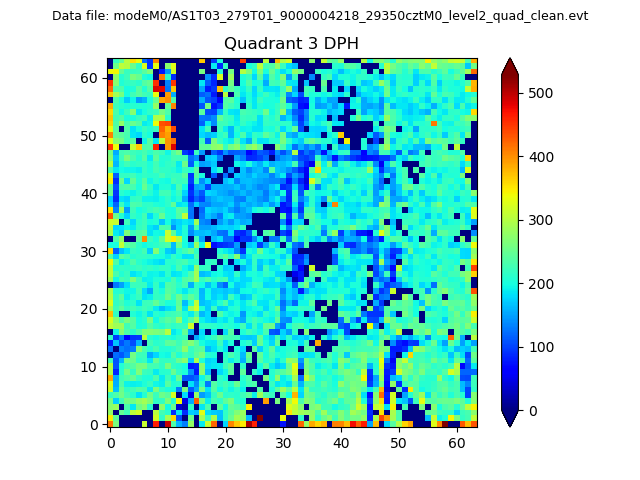 |
 |
Quadrant C |
| Plot type | Count rate plots | Images |
|---|---|---|
| Comparison with Poisson distribution Blue bars denote a histogram of data divided into 1 sec bins. Red curve is a Poisson curve with rate = median count rate of data. |
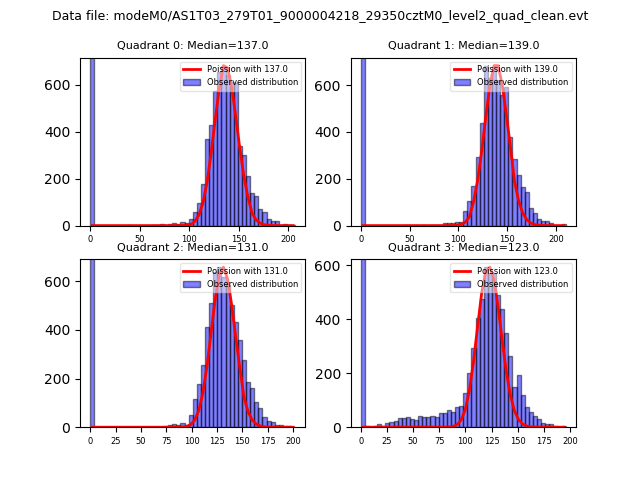 |
 |
| Quadrant-wise count rates Data is divided into 100 sec bins |
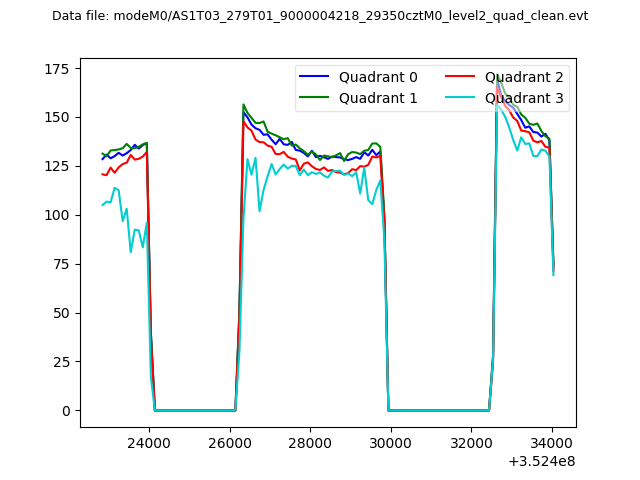 |
|
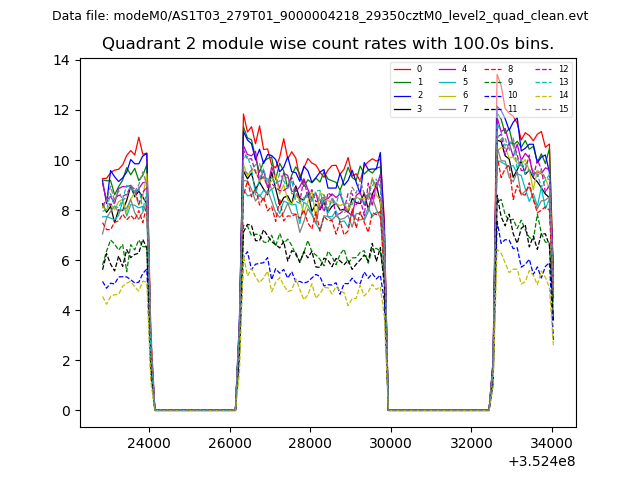
| Module-wise count rates for Quadrant A Data is divided into 100 sec bins |
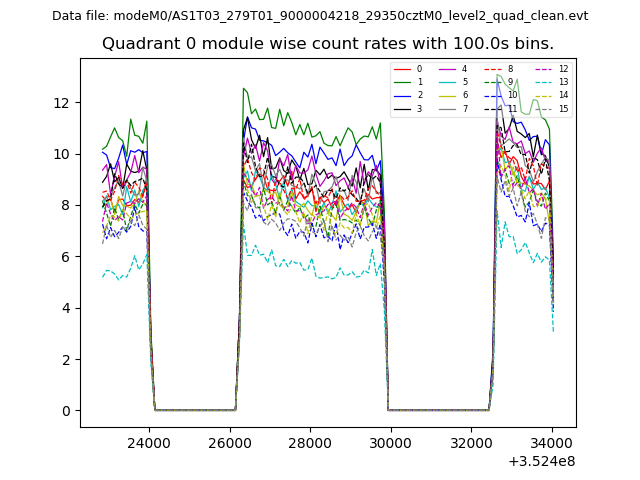 |
 |
| Module-wise count rates for Quadrant B Data is divided into 100 sec bins |
 |
 |
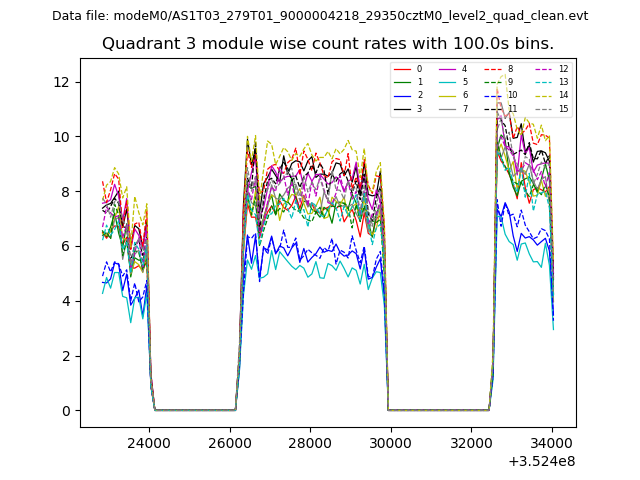
| Module-wise count rates for Quadrant C Data is divided into 100 sec bins |
 |
 |
| Module-wise count rates for Quadrant D Data is divided into 100 sec bins |
 |
 |
| Parameter | Plot |
|---|---|
| CZT HV Monitor | 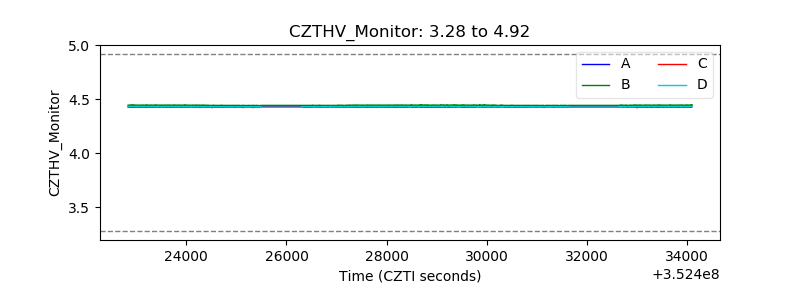 |
| D_VDD | 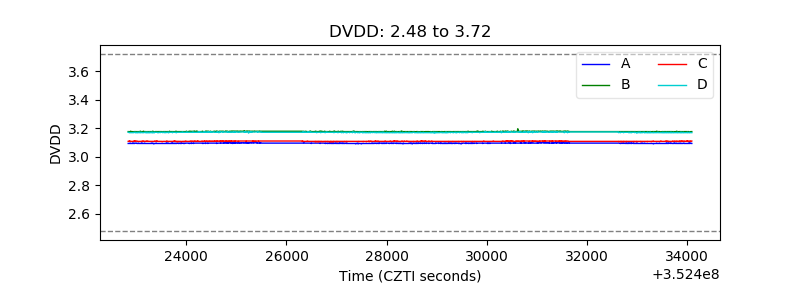 |
| Temperature 1 | 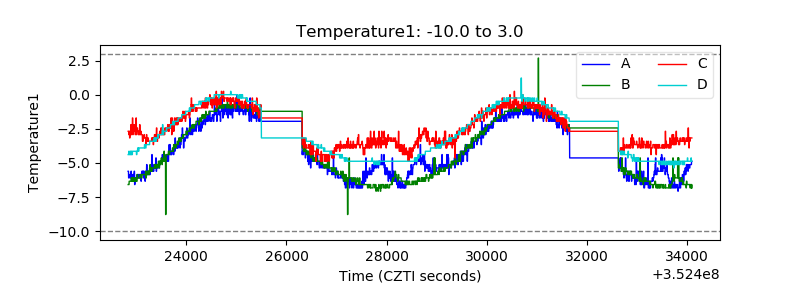 |
| Veto HV Monitor | 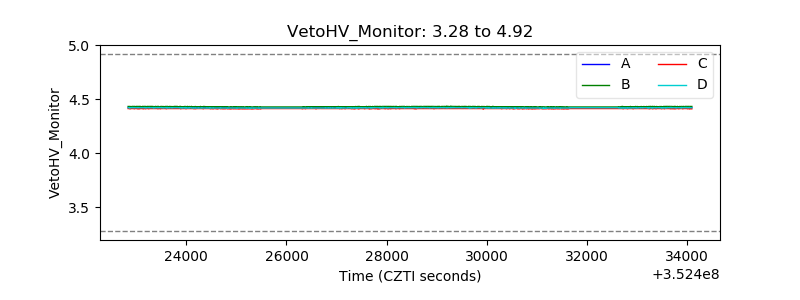 |
| Veto LLD | 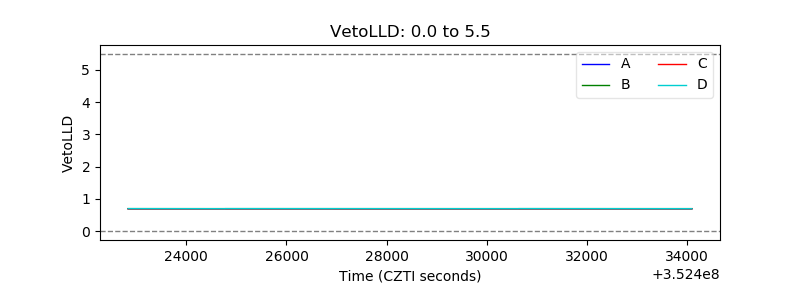 |
| Alpha Counter | 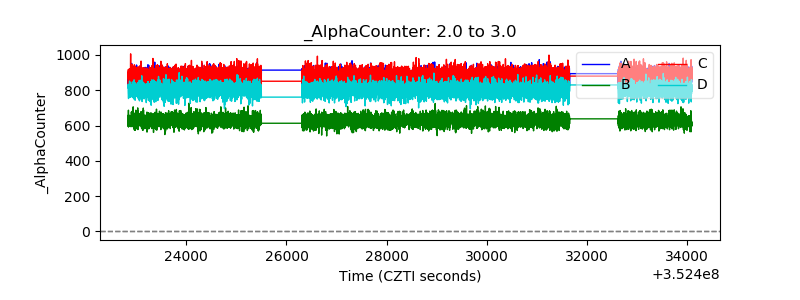 |
| _CPM_Rate | 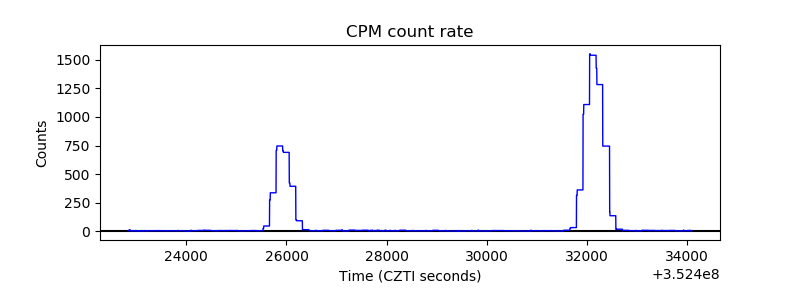 |
| CZT Counter | 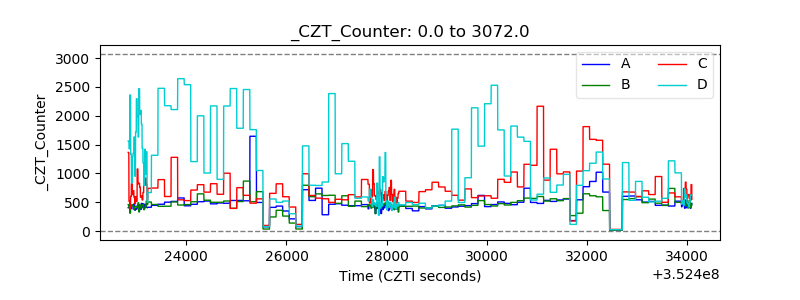 |
| +2.5 Volts monitor |  |
| +5 Volts monitor |  |
| _ROLL_ROT | 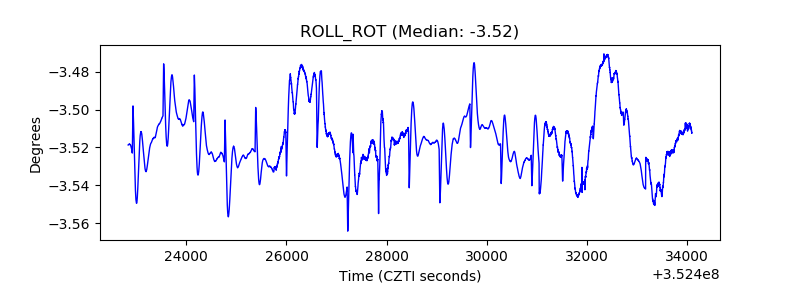 |
| _Roll_DEC | 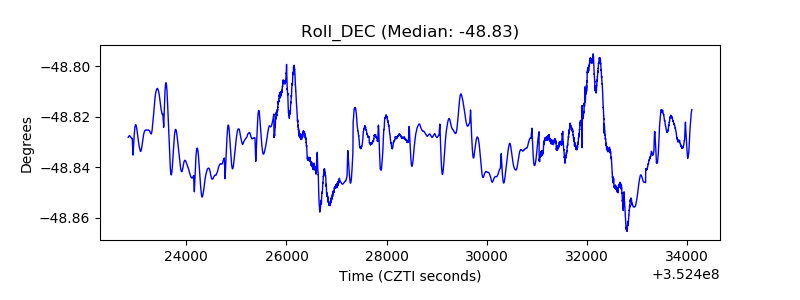 |
| _Roll_RA | 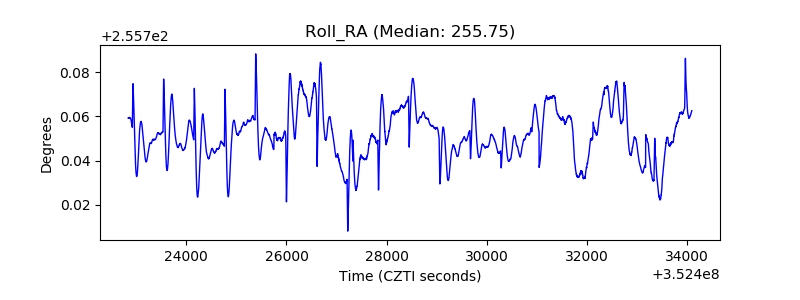 |
| Veto Counter | 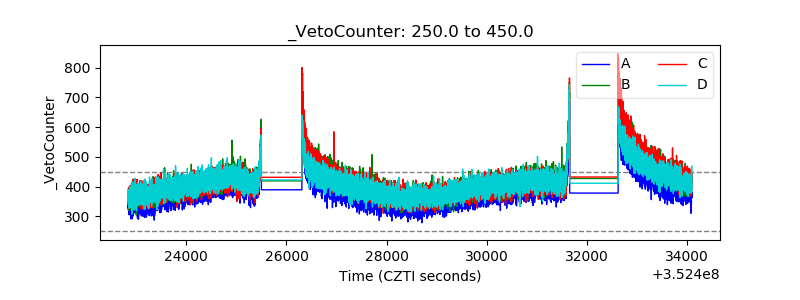 |