| Param | Original file | Final file |
|---|---|---|
| Filename | modeM0/AS1T03_279T01_9000004218_29353cztM0_level2.evt | modeM0/AS1T03_279T01_9000004218_29353cztM0_level2_quad_clean.evt |
| Size (bytes) | 592,917,120 | 82,019,520 |
| Size | 565.4 MB | 78.2 MB |
| Events in quadrant A | 2,772,972 | 542,774 |
| Events in quadrant B | 2,927,935 | 553,932 |
| Events in quadrant C | 6,503,081 | 519,501 |
| Events in quadrant D | 5,383,720 | 485,510 |
| Mode SS | |||
|---|---|---|---|
| Quadrant | BADHDUFLAG | Total packets | Discarded packets |
| A | 0 | 112 | 0 |
| B | 0 | 112 | 0 |
| C | 0 | 112 | 0 |
| D | 0 | 112 | 0 |
| Mode M9 | |||
|---|---|---|---|
| Quadrant | BADHDUFLAG | Total packets | Discarded packets |
| A | 0 | 12 | 0 |
| B | 0 | 12 | 0 |
| C | 0 | 12 | 0 |
| D | 0 | 12 | 0 |
| Mode M0 | |||
|---|---|---|---|
| Quadrant | BADHDUFLAG | Total packets | Discarded packets |
| A | 0 | 11515 | 1 |
| B | 0 | 12024 | 1 |
| C | 0 | 23218 | 1 |
| D | 0 | 19591 | 1 |
| Quadrant | Total seconds | Saturated seconds | Saturation percentage |
|---|---|---|---|
| A | 5450 | 12 | 0.220183% |
| B | 5451 | 42 | 0.770501% |
| C | 5451 | 872 | 15.997065% |
| D | 5451 | 752 | 13.795634% |
Noise dominated data is calculated using 1-second bins in cleaned event files. If a bin has >2000 counts, and if more than 50% of those come from <1% of pixels, then it is considered to be noise-dominated and hence unusable.
| Quadrant | # 1 sec bins | Bins with >0 counts | Bins with >2000 counts | High rate bins dominated by noise | Noise dominated (total time) | Noise dominated (detector-on time) | Marked lightcurve |
|---|---|---|---|---|---|---|---|
| A | 6675 | 5451 | 1 | 1 | 0.01% | 0.02% | 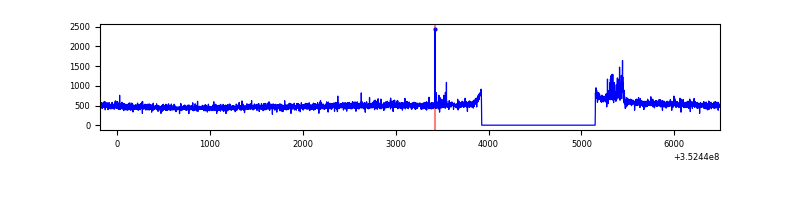 |
| B | 6676 | 5452 | 20 | 20 | 0.30% | 0.37% | 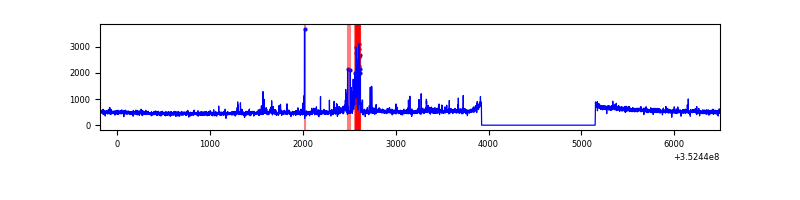 |
| C | 6676 | 5452 | 493 | 493 | 7.38% | 9.04% | 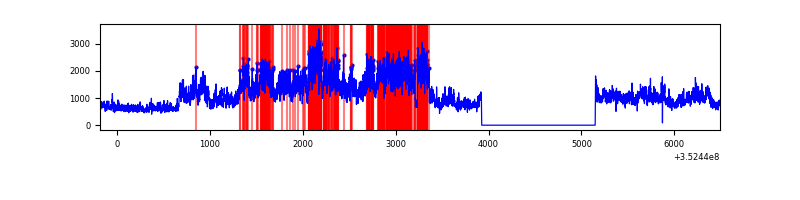 |
| D | 6676 | 5452 | 557 | 557 | 8.34% | 10.22% | 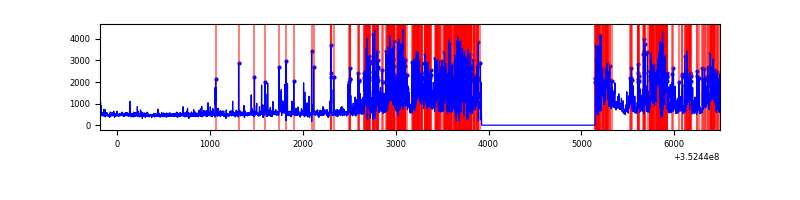 |
Top three noisy pixels from each quadrant. If the there are fewer than three noisy pixels in the level2.evt file, extra rows are filled as -1
| Pixel properties | Quadrant properties | ||||||
|---|---|---|---|---|---|---|---|
| Quadrant | DetID | PixID | Counts | Sigma | Mean | Median | Sigma |
| A | 1 | 113 | 54807 | 384.08 | 704 | 689 | 140.9 |
| A | 13 | 254 | 10996 | 73.15 | 704 | 689 | 140.9 |
| A | 3 | 137 | 6112 | 38.49 | 704 | 689 | 140.9 |
| B | 10 | 245 | 144243 | 1108.0 | 697 | 684 | 129.6 |
| B | 0 | 229 | 24110 | 180.8 | 697 | 684 | 129.6 |
| B | 12 | 111 | 14749 | 108.55 | 697 | 684 | 129.6 |
| C | 3 | 233 | 3178012 | 20644.19 | 667 | 674 | 153.9 |
| C | 10 | 9 | 559661 | 3631.92 | 667 | 674 | 153.9 |
| C | 14 | 238 | 108645 | 701.52 | 667 | 674 | 153.9 |
| D | 1 | 52 | 1806432 | 11561.64 | 659 | 642 | 156.2 |
| D | 13 | 104 | 591889 | 3785.48 | 659 | 642 | 156.2 |
| D | 13 | 153 | 165113 | 1053.03 | 659 | 642 | 156.2 |
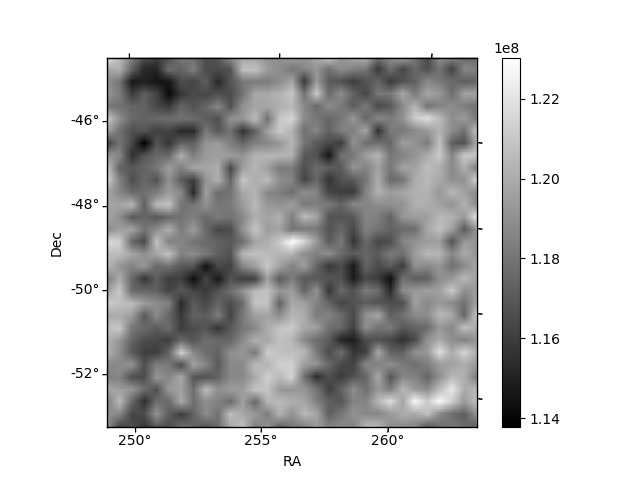
Histogram calculated using DETX and DETY for each event in the final _common_clean file
| Quadrant A | 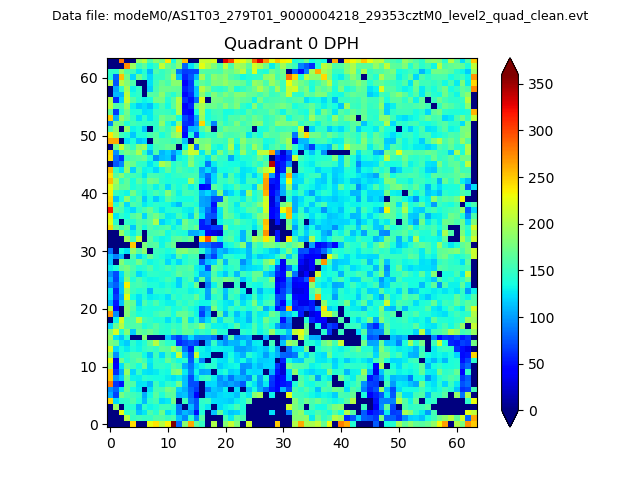 |
 |
Quadrant B |
|---|---|---|---|
| Quadrant D | 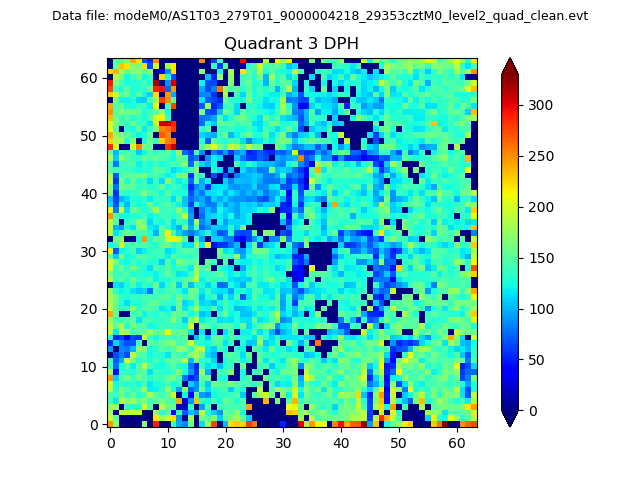 |
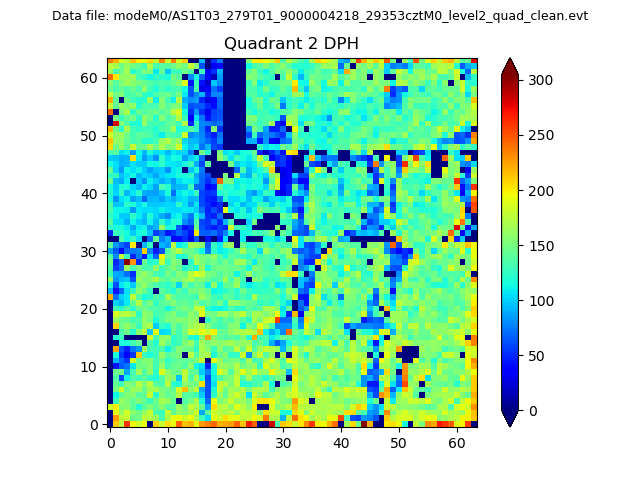 |
Quadrant C |
| Plot type | Count rate plots | Images |
|---|---|---|
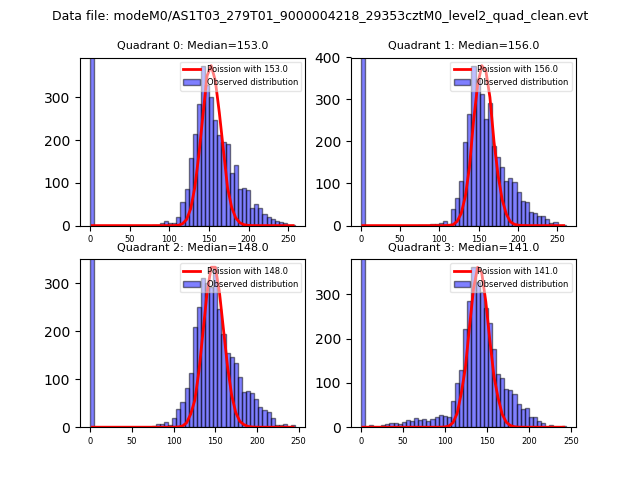
| Comparison with Poisson distribution Blue bars denote a histogram of data divided into 1 sec bins. Red curve is a Poisson curve with rate = median count rate of data. |
 |
 |
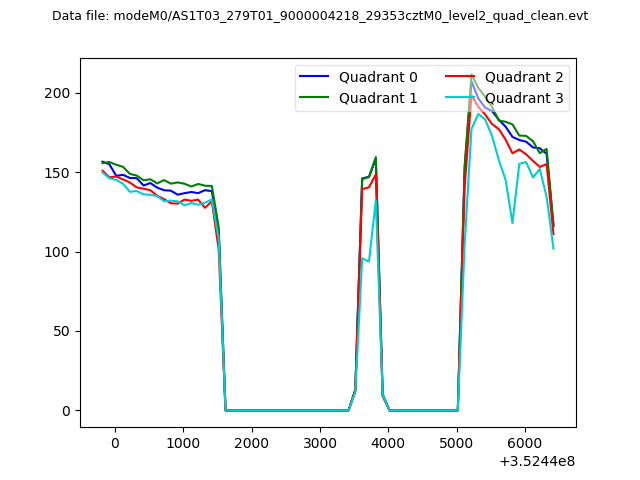
| Quadrant-wise count rates Data is divided into 100 sec bins |
 |
|
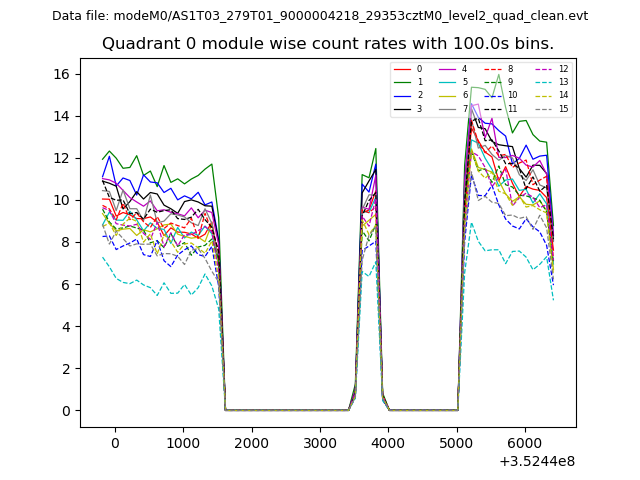
| Module-wise count rates for Quadrant A Data is divided into 100 sec bins |
 |
 |
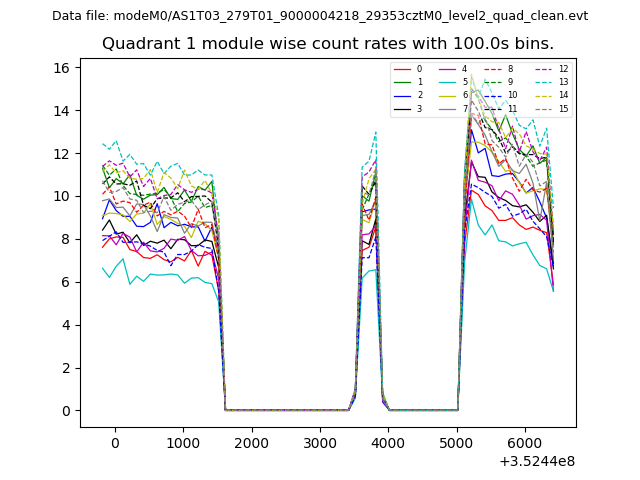
| Module-wise count rates for Quadrant B Data is divided into 100 sec bins |
 |
 |
| Module-wise count rates for Quadrant C Data is divided into 100 sec bins |
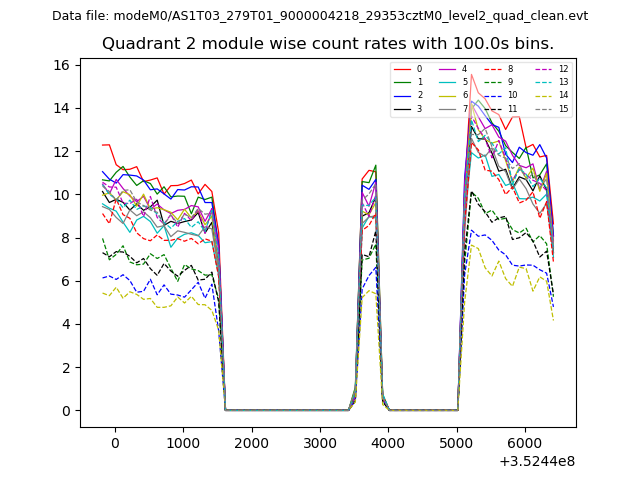 |
 |
| Module-wise count rates for Quadrant D Data is divided into 100 sec bins |
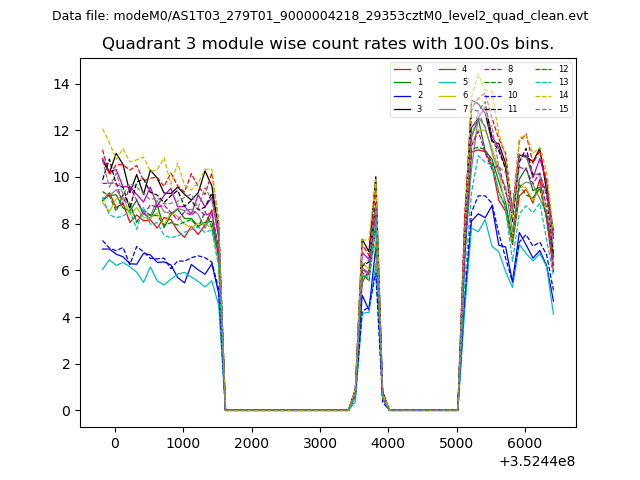 |
 |
| Parameter | Plot |
|---|---|
| CZT HV Monitor | 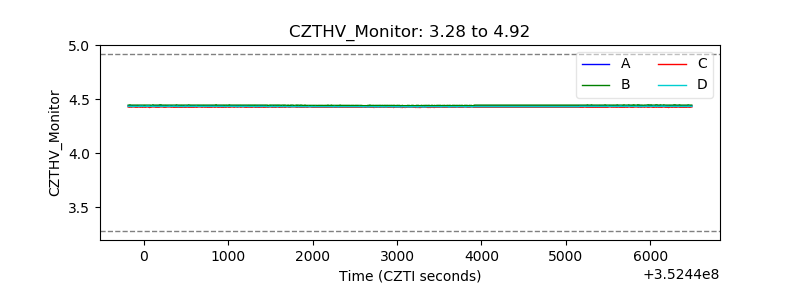 |
| D_VDD | 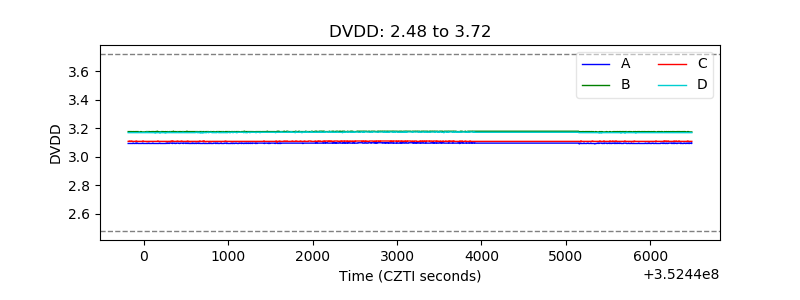 |
| Temperature 1 | 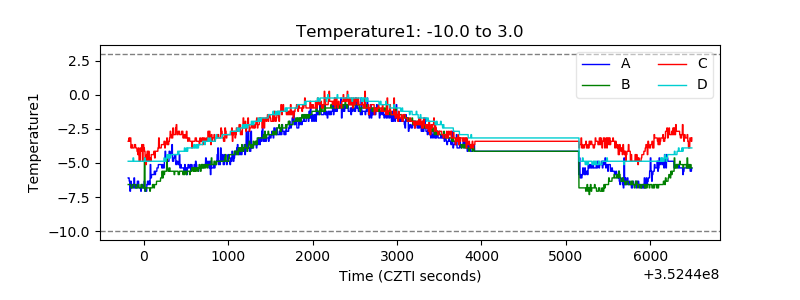 |
| Veto HV Monitor | 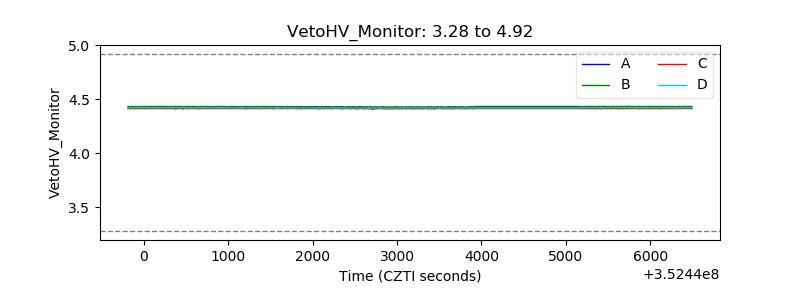 |
| Veto LLD |  |
| Alpha Counter | 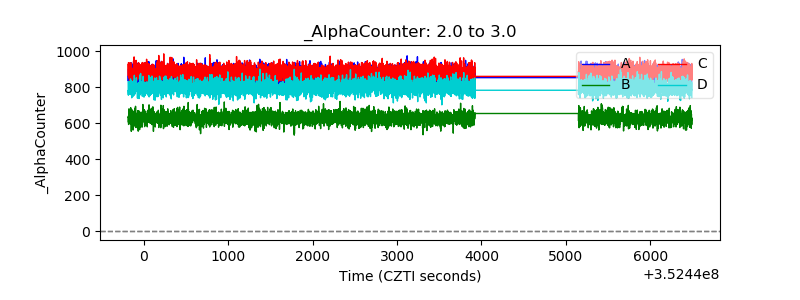 |
| _CPM_Rate | 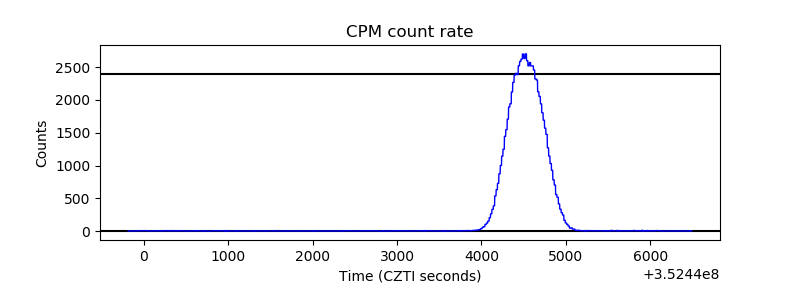 |
| CZT Counter |  |
| +2.5 Volts monitor |  |
| +5 Volts monitor | 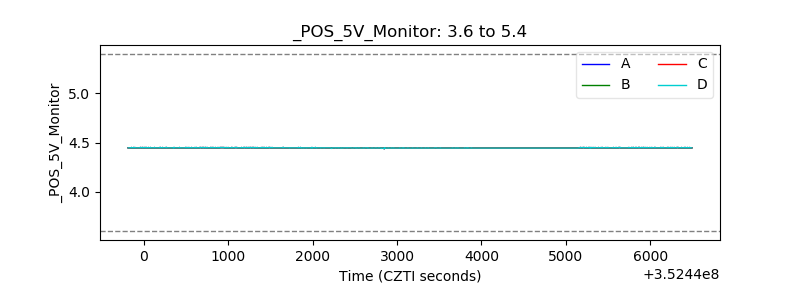 |
| _ROLL_ROT | 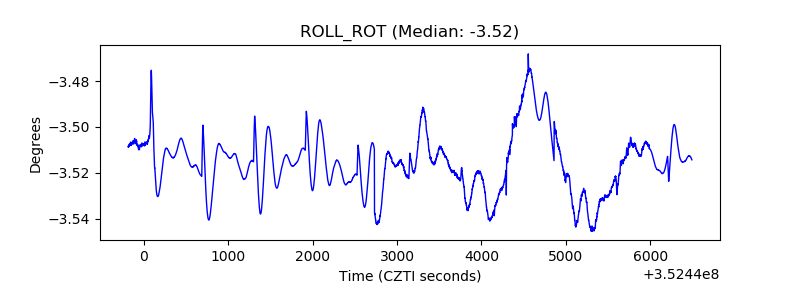 |
| _Roll_DEC | 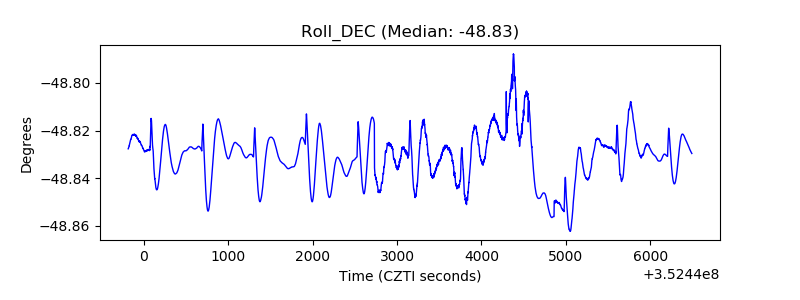 |
| _Roll_RA |  |
| Veto Counter | 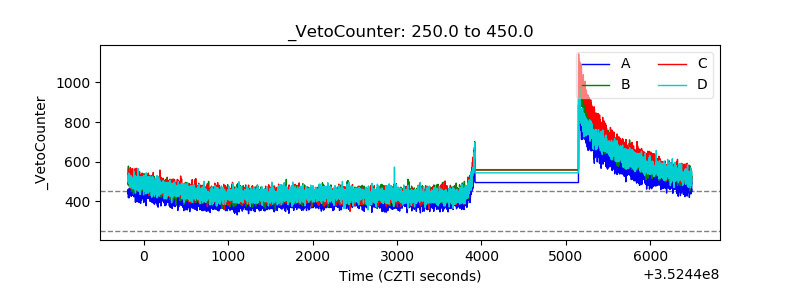 |