| Param | Original file | Final file |
|---|---|---|
| Filename | modeM0/AS1T03_279T01_9000004218_29354cztM0_level2.evt | modeM0/AS1T03_279T01_9000004218_29354cztM0_level2_quad_clean.evt |
| Size (bytes) | 649,661,760 | 103,420,800 |
| Size | 619.6 MB | 98.6 MB |
| Events in quadrant A | 3,336,112 | 701,060 |
| Events in quadrant B | 3,391,612 | 708,718 |
| Events in quadrant C | 5,209,232 | 671,790 |
| Events in quadrant D | 7,322,849 | 621,356 |
| Mode SS | |||
|---|---|---|---|
| Quadrant | BADHDUFLAG | Total packets | Discarded packets |
| A | 0 | 126 | 0 |
| B | 0 | 126 | 0 |
| C | 0 | 126 | 0 |
| D | 0 | 126 | 0 |
| Mode M9 | |||
|---|---|---|---|
| Quadrant | BADHDUFLAG | Total packets | Discarded packets |
| A | 0 | 12 | 0 |
| B | 0 | 12 | 0 |
| C | 0 | 12 | 0 |
| D | 0 | 12 | 0 |
| Mode M0 | |||
|---|---|---|---|
| Quadrant | BADHDUFLAG | Total packets | Discarded packets |
| A | 0 | 13488 | 1 |
| B | 0 | 13718 | 1 |
| C | 0 | 19979 | 2 |
| D | 0 | 26110 | 1 |
| Quadrant | Total seconds | Saturated seconds | Saturation percentage |
|---|---|---|---|
| A | 6143 | 36 | 0.586033% |
| B | 6144 | 54 | 0.878906% |
| C | 6143 | 193 | 3.141787% |
| D | 6143 | 1361 | 22.155299% |
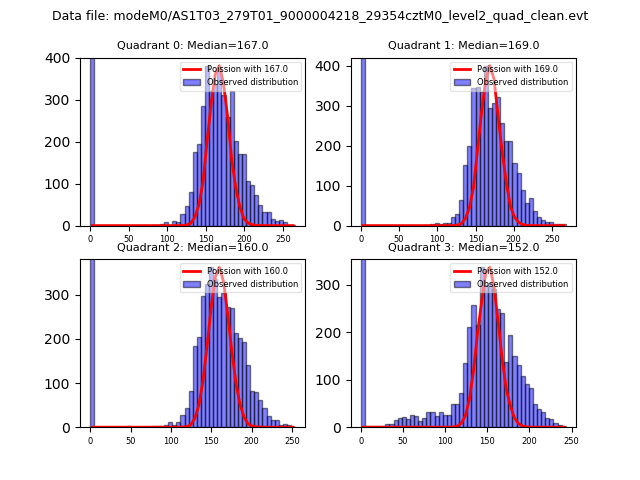
Noise dominated data is calculated using 1-second bins in cleaned event files. If a bin has >2000 counts, and if more than 50% of those come from <1% of pixels, then it is considered to be noise-dominated and hence unusable.
| Quadrant | # 1 sec bins | Bins with >0 counts | Bins with >2000 counts | High rate bins dominated by noise | Noise dominated (total time) | Noise dominated (detector-on time) | Marked lightcurve |
|---|---|---|---|---|---|---|---|
| A | 7388 | 6144 | 3 | 3 | 0.04% | 0.05% | 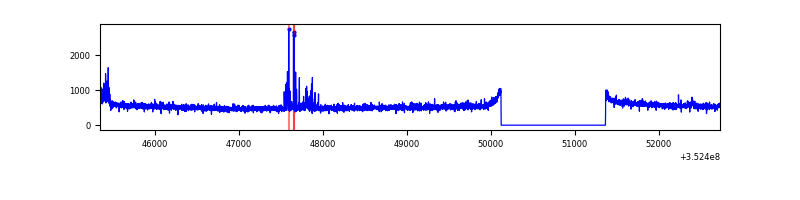 |
| B | 7389 | 6145 | 4 | 4 | 0.05% | 0.07% | 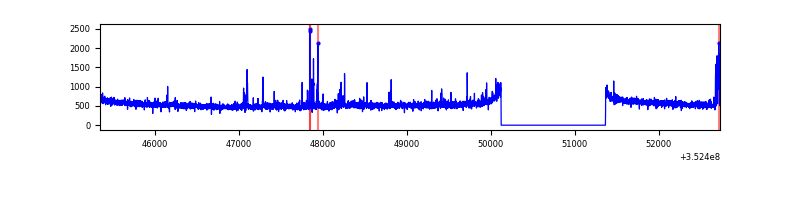 |
| C | 7388 | 6144 | 4 | 4 | 0.05% | 0.07% | 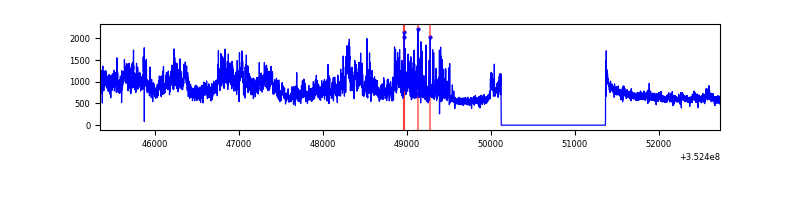 |
| D | 7388 | 6144 | 841 | 841 | 11.38% | 13.69% | 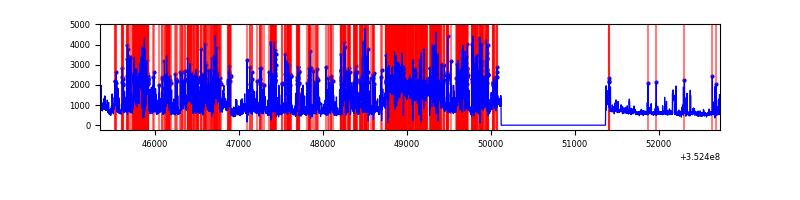 |
Top three noisy pixels from each quadrant. If the there are fewer than three noisy pixels in the level2.evt file, extra rows are filled as -1
| Pixel properties | Quadrant properties | ||||||
|---|---|---|---|---|---|---|---|
| Quadrant | DetID | PixID | Counts | Sigma | Mean | Median | Sigma |
| A | 0 | 13 | 68515 | 407.71 | 839 | 823 | 166.0 |
| A | 1 | 113 | 31362 | 183.94 | 839 | 823 | 166.0 |
| A | 13 | 254 | 12972 | 73.17 | 839 | 823 | 166.0 |
| B | 10 | 245 | 71284 | 462.11 | 827 | 810 | 152.5 |
| B | 0 | 189 | 42731 | 274.89 | 827 | 810 | 152.5 |
| B | 12 | 111 | 17384 | 108.68 | 827 | 810 | 152.5 |
| C | 3 | 233 | 1351093 | 7096.39 | 815 | 821 | 190.3 |
| C | 10 | 9 | 497963 | 2612.74 | 815 | 821 | 190.3 |
| C | 14 | 238 | 133297 | 696.23 | 815 | 821 | 190.3 |
| D | 1 | 52 | 2056544 | 11818.13 | 732 | 714 | 174.0 |
| D | 7 | 80 | 1292722 | 7427.23 | 732 | 714 | 174.0 |
| D | 13 | 104 | 788121 | 4526.48 | 732 | 714 | 174.0 |
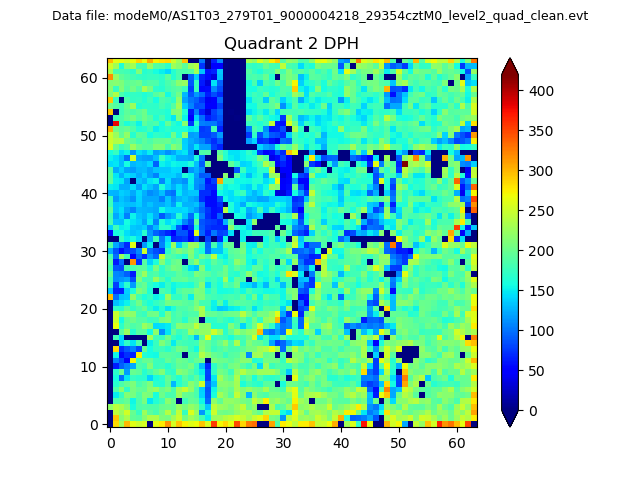
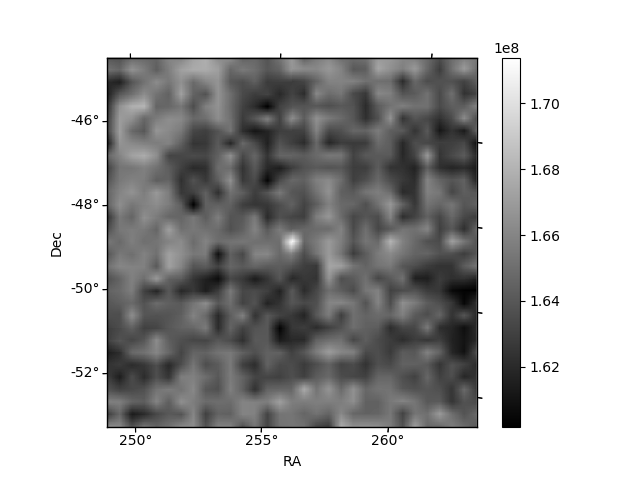
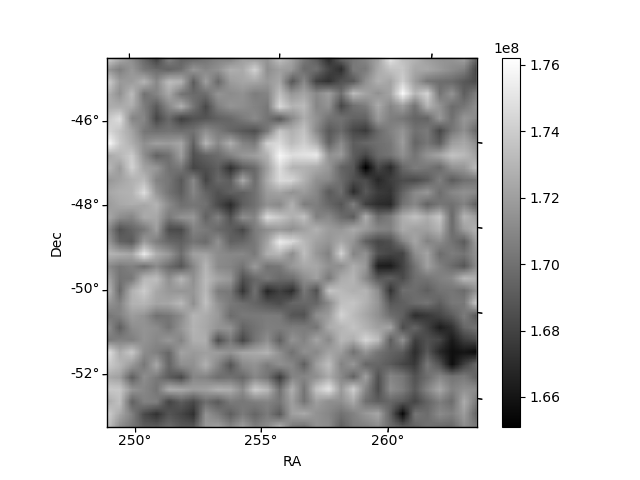
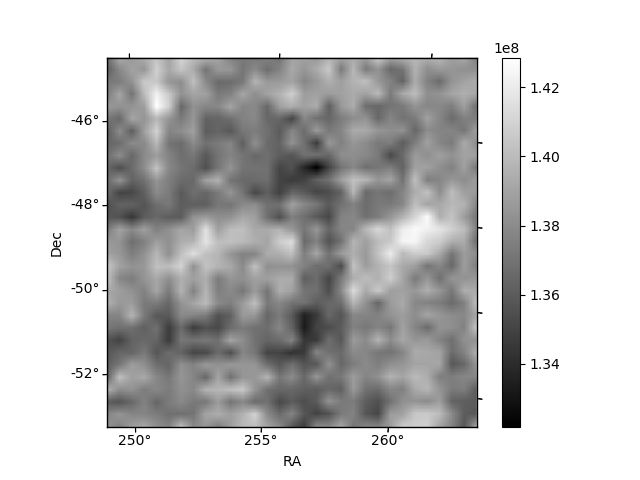
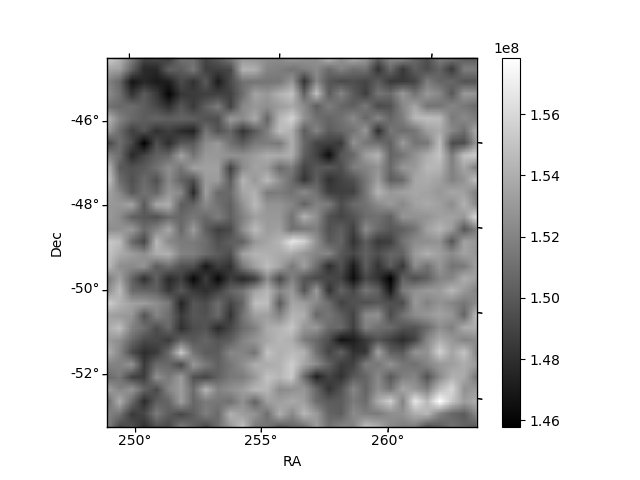
Histogram calculated using DETX and DETY for each event in the final _common_clean file
| Quadrant A | 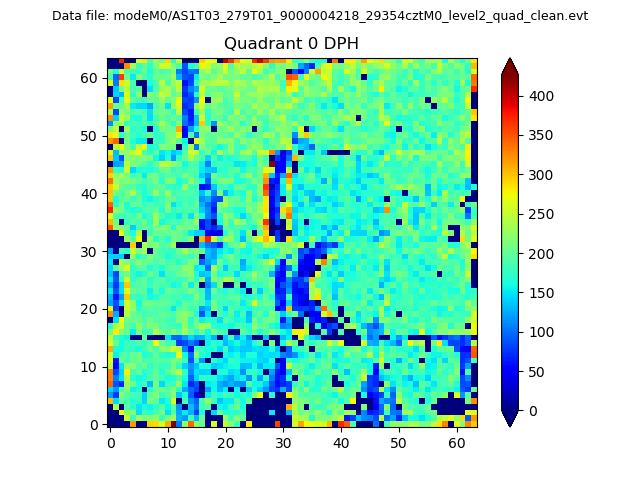 |
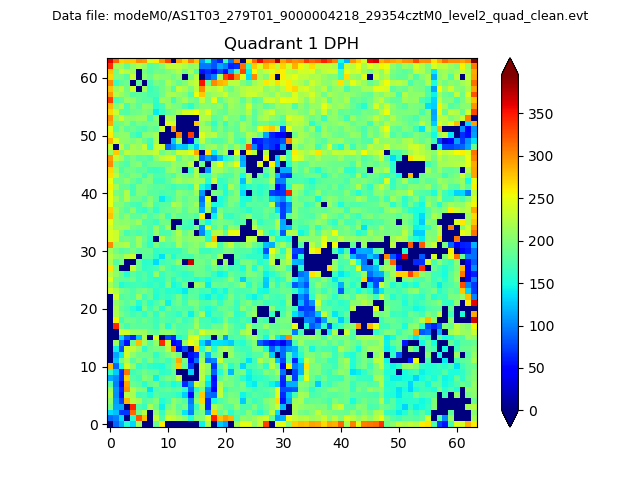 |
Quadrant B |
|---|---|---|---|
| Quadrant D | 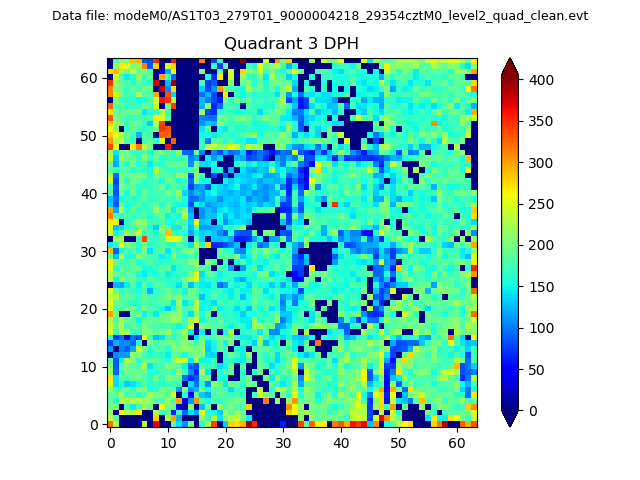 |
 |
Quadrant C |
| Plot type | Count rate plots | Images |
|---|---|---|
| Comparison with Poisson distribution Blue bars denote a histogram of data divided into 1 sec bins. Red curve is a Poisson curve with rate = median count rate of data. |
 |
 |
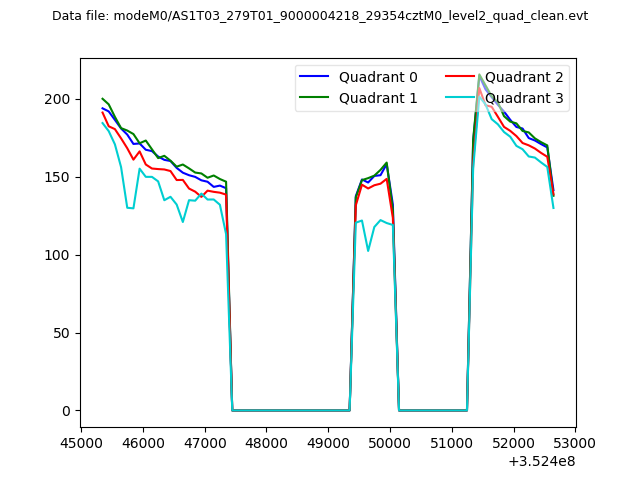
| Quadrant-wise count rates Data is divided into 100 sec bins |
 |
|
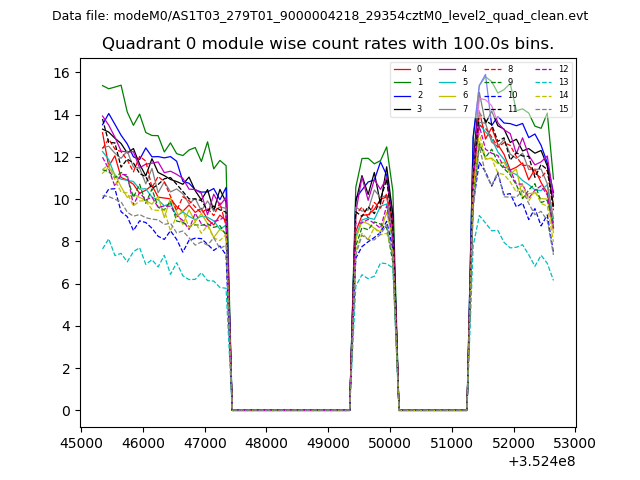
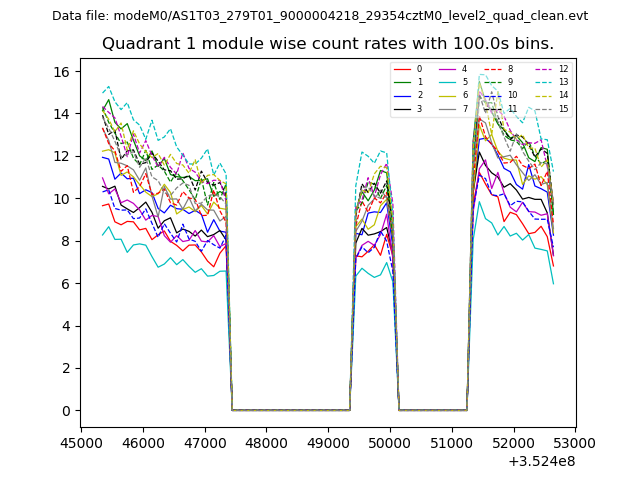
| Module-wise count rates for Quadrant A Data is divided into 100 sec bins |
 |
 |
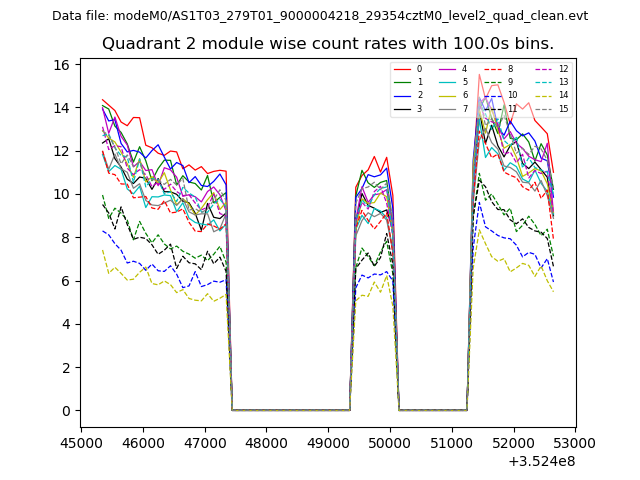
| Module-wise count rates for Quadrant B Data is divided into 100 sec bins |
 |
 |
| Module-wise count rates for Quadrant C Data is divided into 100 sec bins |
 |
 |
| Module-wise count rates for Quadrant D Data is divided into 100 sec bins |
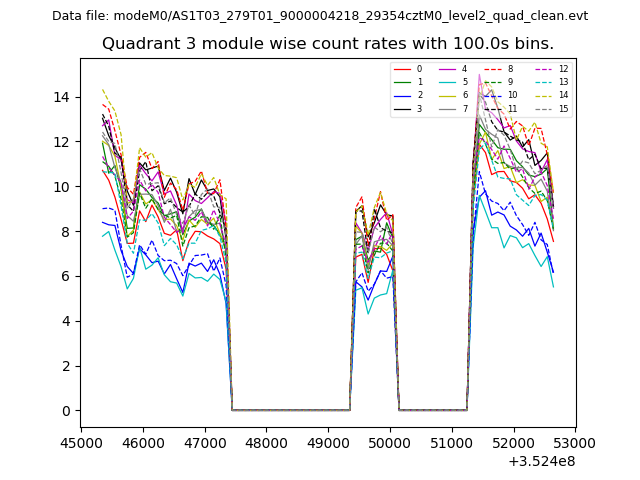 |
 |
| Parameter | Plot |
|---|---|
| CZT HV Monitor | 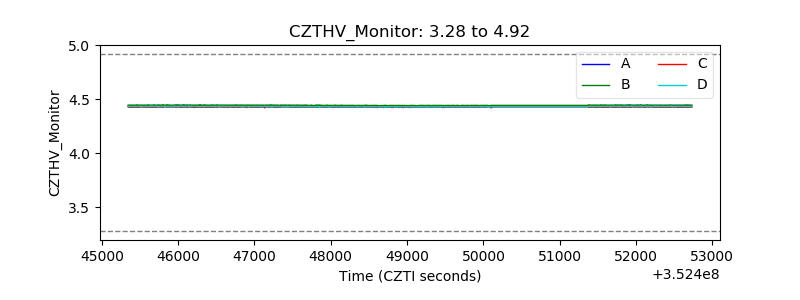 |
| D_VDD | 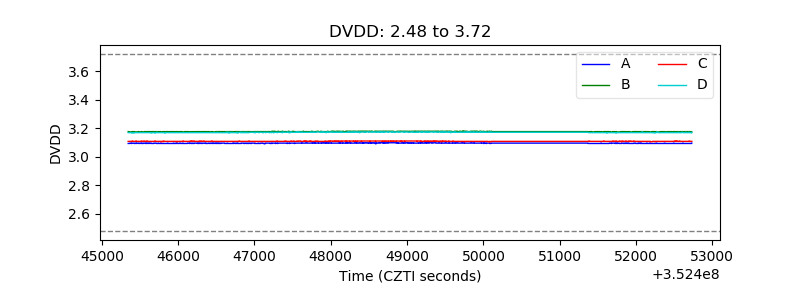 |
| Temperature 1 | 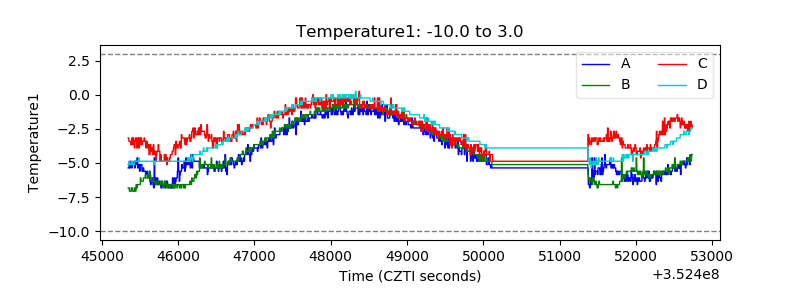 |
| Veto HV Monitor | 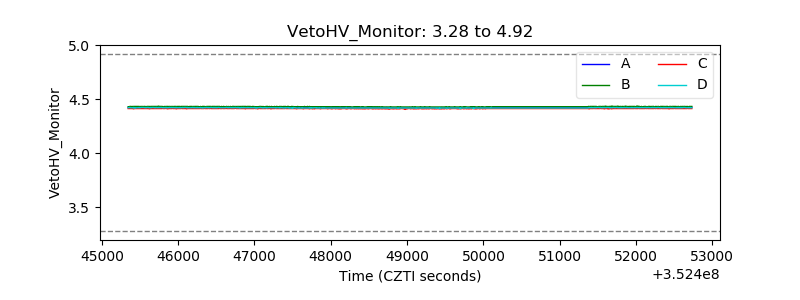 |
| Veto LLD | 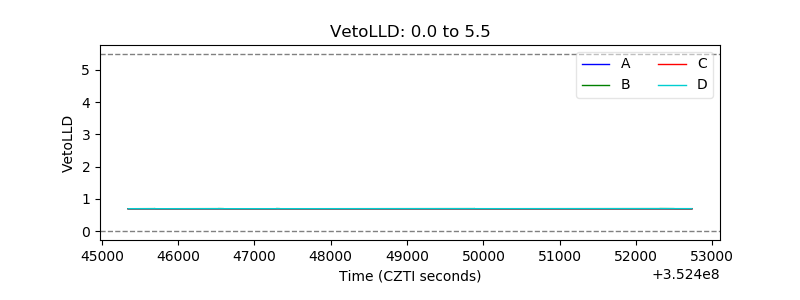 |
| Alpha Counter | 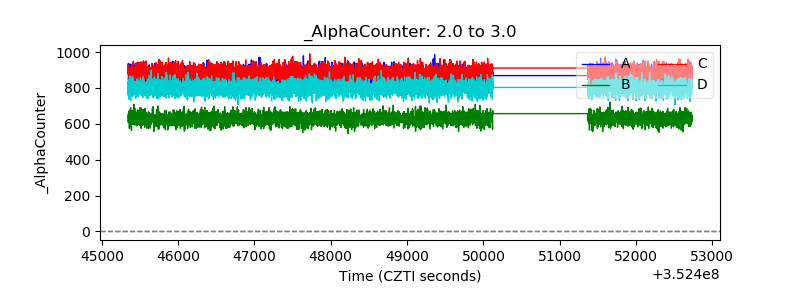 |
| _CPM_Rate | 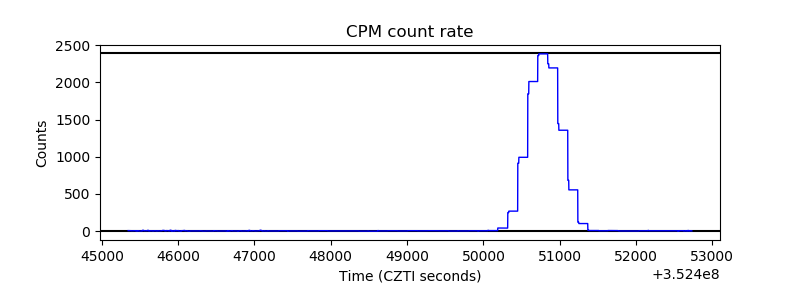 |
| CZT Counter | 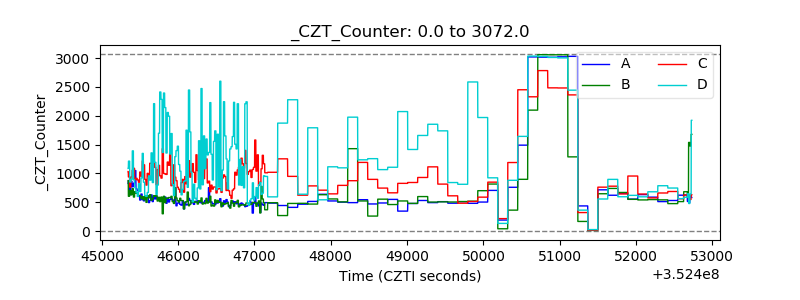 |
| +2.5 Volts monitor | 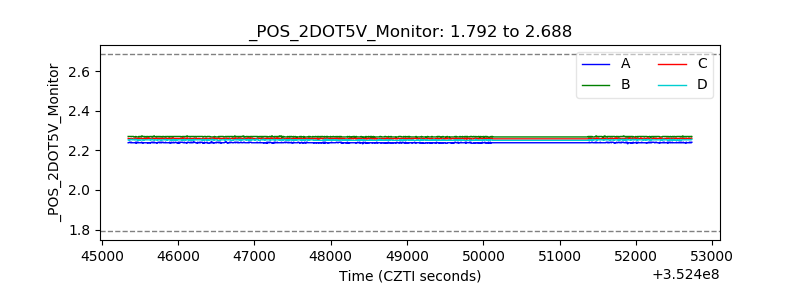 |
| +5 Volts monitor |  |
| _ROLL_ROT | 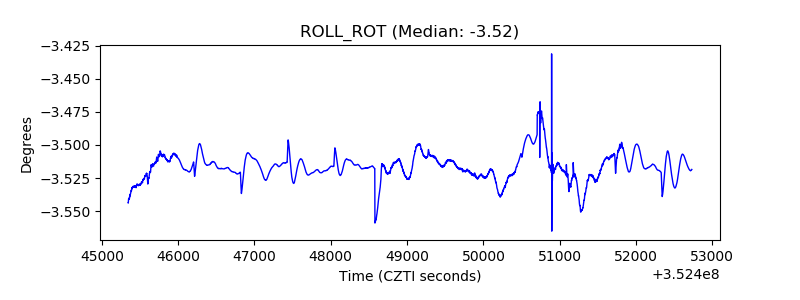 |
| _Roll_DEC | 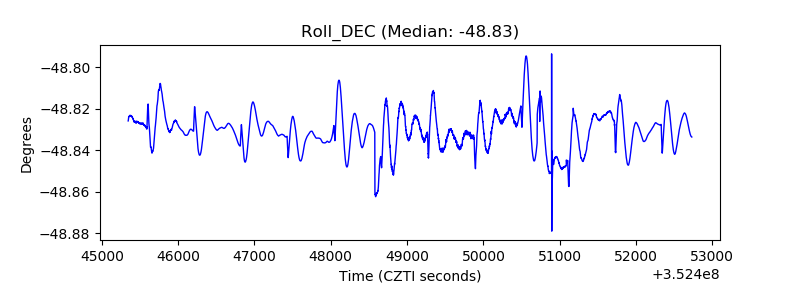 |
| _Roll_RA | 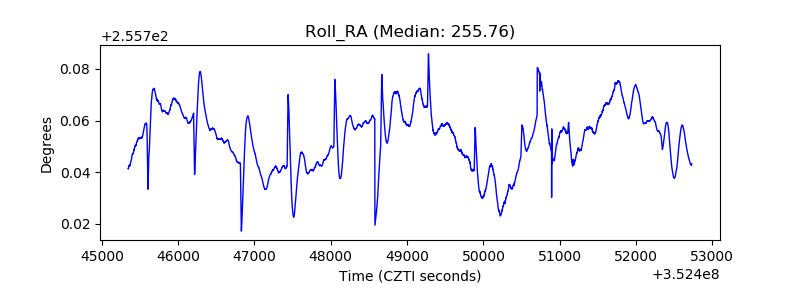 |
| Veto Counter | 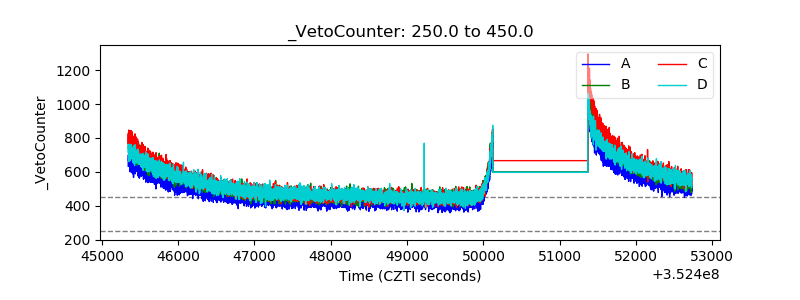 |