| Param | Original file | Final file |
|---|---|---|
| Filename | modeM0/AS1T03_279T01_9000004218_29355cztM0_level2.evt | modeM0/AS1T03_279T01_9000004218_29355cztM0_level2_quad_clean.evt |
| Size (bytes) | 644,866,560 | 105,834,240 |
| Size | 615.0 MB | 100.9 MB |
| Events in quadrant A | 3,391,691 | 723,035 |
| Events in quadrant B | 3,522,441 | 723,563 |
| Events in quadrant C | 4,229,019 | 677,542 |
| Events in quadrant D | 7,969,466 | 650,573 |
| Mode SS | |||
|---|---|---|---|
| Quadrant | BADHDUFLAG | Total packets | Discarded packets |
| A | 0 | 124 | 0 |
| B | 0 | 124 | 0 |
| C | 0 | 124 | 0 |
| D | 0 | 124 | 0 |
| Mode M9 | |||
|---|---|---|---|
| Quadrant | BADHDUFLAG | Total packets | Discarded packets |
| A | 0 | 13 | 0 |
| B | 0 | 13 | 0 |
| C | 0 | 13 | 0 |
| D | 0 | 13 | 0 |
| Mode M0 | |||
|---|---|---|---|
| Quadrant | BADHDUFLAG | Total packets | Discarded packets |
| A | 0 | 13738 | 1 |
| B | 0 | 14116 | 1 |
| C | 0 | 16951 | 1 |
| D | 0 | 28040 | 1 |
| Quadrant | Total seconds | Saturated seconds | Saturation percentage |
|---|---|---|---|
| A | 6169 | 56 | 0.907765% |
| B | 6170 | 84 | 1.361426% |
| C | 6170 | 345 | 5.591572% |
| D | 6170 | 1834 | 29.724473% |
Noise dominated data is calculated using 1-second bins in cleaned event files. If a bin has >2000 counts, and if more than 50% of those come from <1% of pixels, then it is considered to be noise-dominated and hence unusable.
| Quadrant | # 1 sec bins | Bins with >0 counts | Bins with >2000 counts | High rate bins dominated by noise | Noise dominated (total time) | Noise dominated (detector-on time) | Marked lightcurve |
|---|---|---|---|---|---|---|---|
| A | 7449 | 6170 | 0 | 0 | 0.00% | 0.00% | 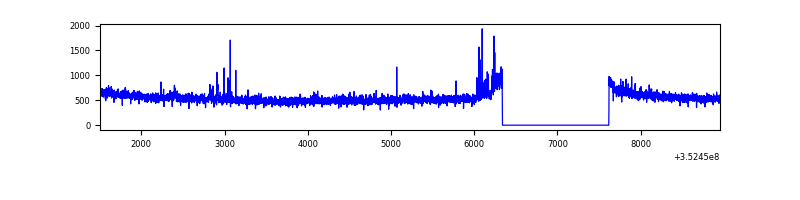 |
| B | 7450 | 6171 | 2 | 2 | 0.03% | 0.03% | 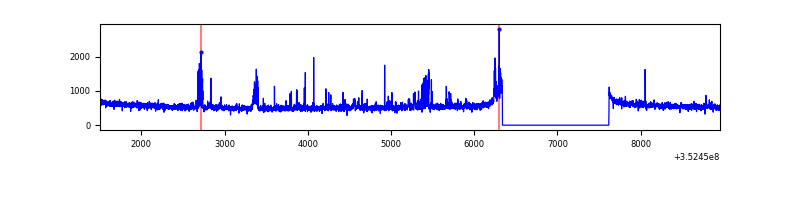 |
| C | 7450 | 6171 | 21 | 21 | 0.28% | 0.34% | 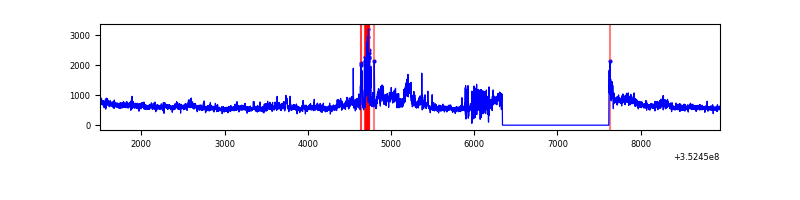 |
| D | 7450 | 6171 | 1433 | 1433 | 19.23% | 23.22% | 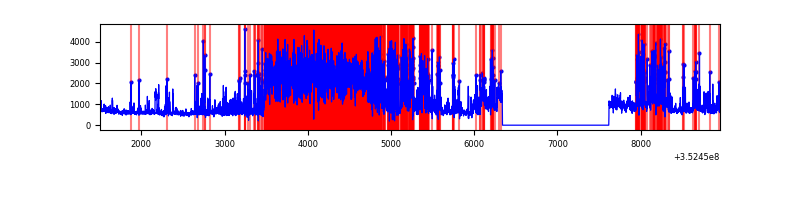 |
Top three noisy pixels from each quadrant. If the there are fewer than three noisy pixels in the level2.evt file, extra rows are filled as -1
| Pixel properties | Quadrant properties | ||||||
|---|---|---|---|---|---|---|---|
| Quadrant | DetID | PixID | Counts | Sigma | Mean | Median | Sigma |
| A | 0 | 13 | 64962 | 381.96 | 860 | 846 | 167.9 |
| A | 13 | 254 | 12035 | 66.66 | 860 | 846 | 167.9 |
| A | 0 | 226 | 7452 | 39.35 | 860 | 846 | 167.9 |
| B | 10 | 245 | 98222 | 630.19 | 841 | 824 | 154.6 |
| B | 0 | 189 | 49509 | 315.0 | 841 | 824 | 154.6 |
| B | 15 | 33 | 32306 | 203.7 | 841 | 824 | 154.6 |
| C | 3 | 233 | 640549 | 3364.71 | 815 | 822 | 190.1 |
| C | 14 | 238 | 173216 | 906.72 | 815 | 822 | 190.1 |
| C | 10 | 9 | 157790 | 825.59 | 815 | 822 | 190.1 |
| D | 12 | 33 | 1899461 | 10702.79 | 751 | 735 | 177.4 |
| D | 1 | 52 | 1810689 | 10202.4 | 751 | 735 | 177.4 |
| D | 7 | 80 | 491080 | 2763.99 | 751 | 735 | 177.4 |
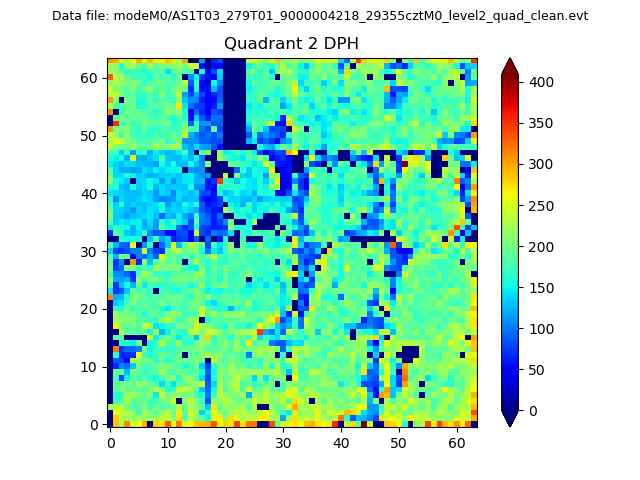
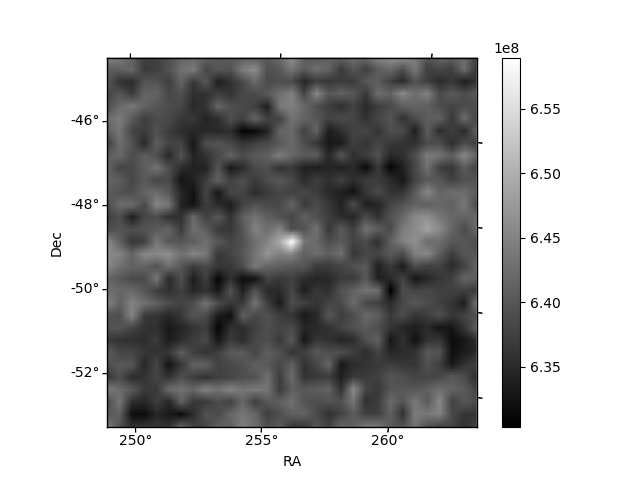
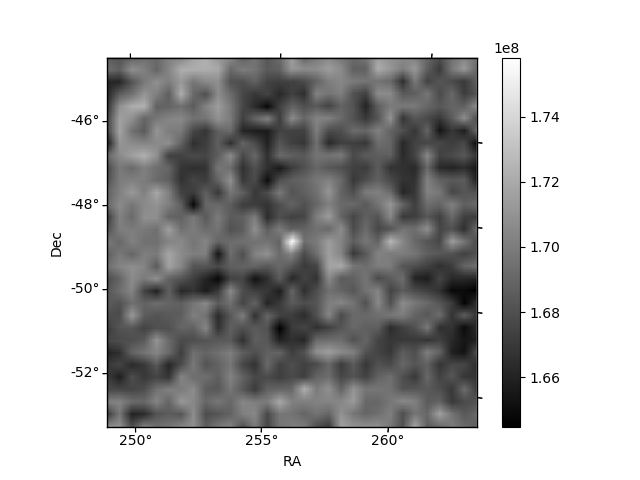
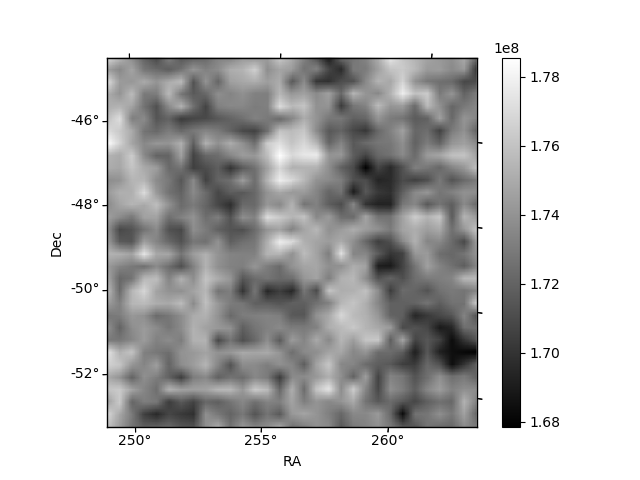
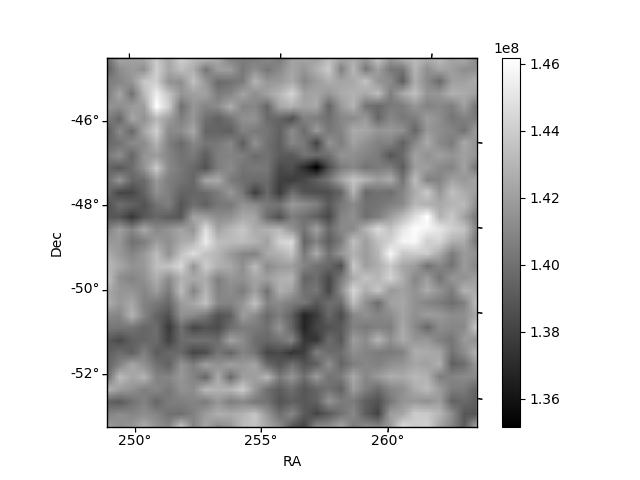
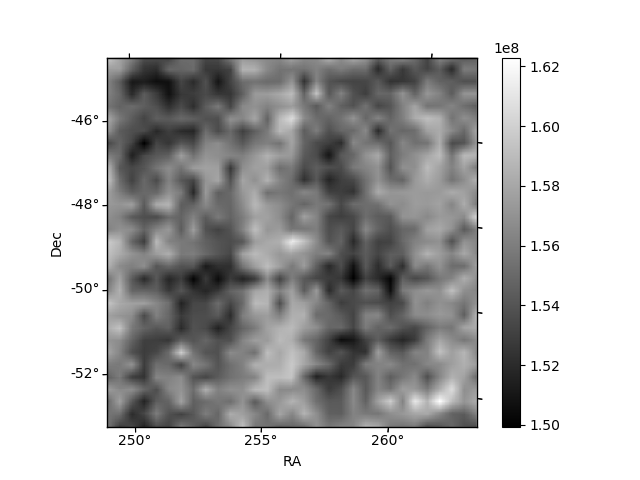
Histogram calculated using DETX and DETY for each event in the final _common_clean file
| Quadrant A | 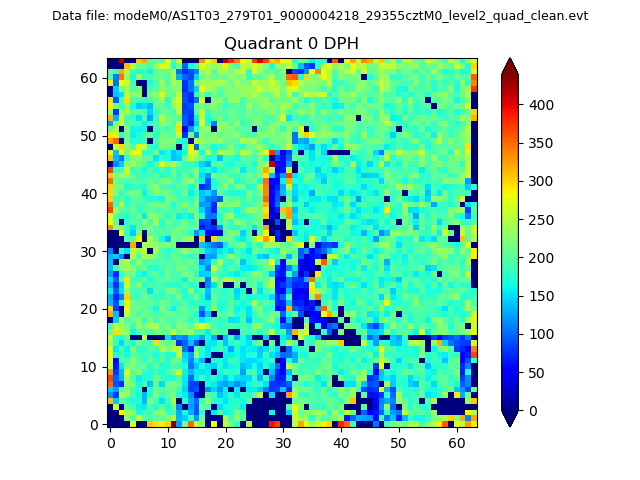 |
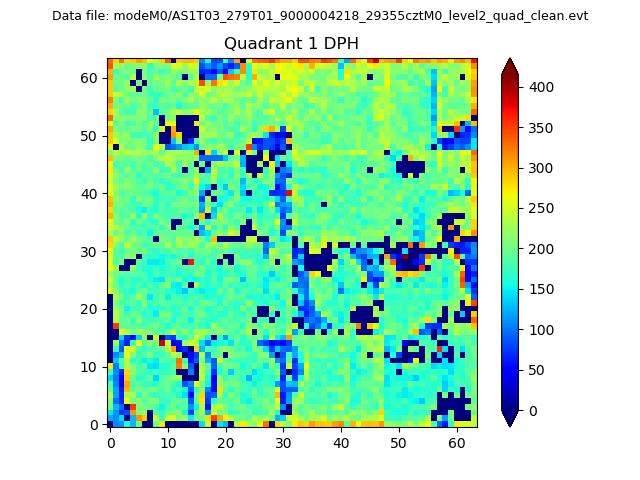 |
Quadrant B |
|---|---|---|---|
| Quadrant D | 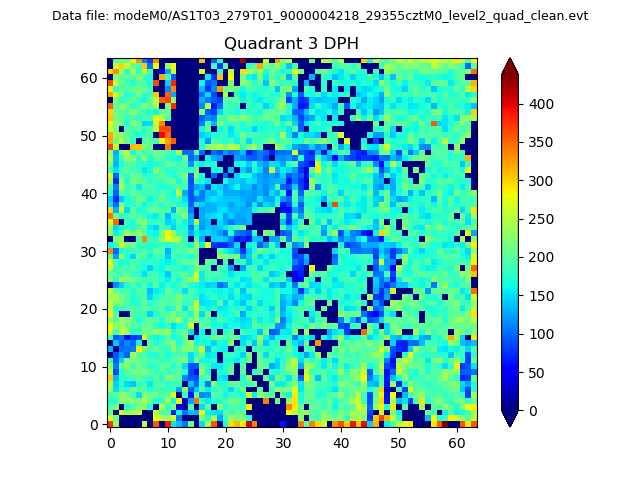 |
 |
Quadrant C |
| Plot type | Count rate plots | Images |
|---|---|---|
| Comparison with Poisson distribution Blue bars denote a histogram of data divided into 1 sec bins. Red curve is a Poisson curve with rate = median count rate of data. |
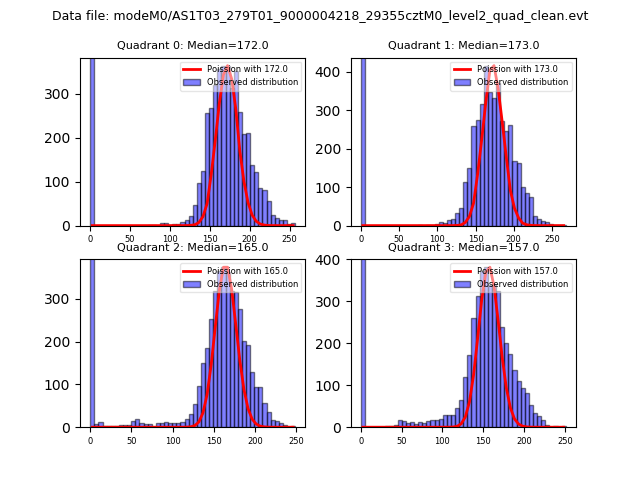 |
 |
| Quadrant-wise count rates Data is divided into 100 sec bins |
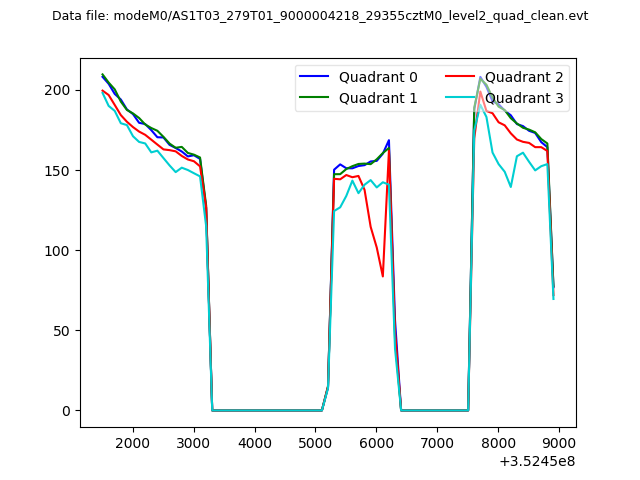 |
|
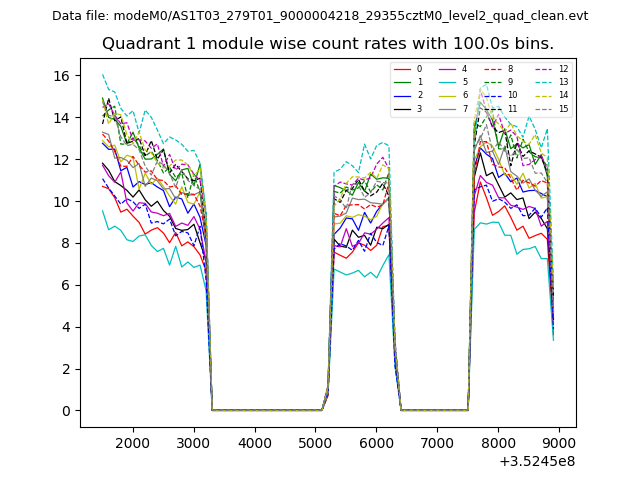
| Module-wise count rates for Quadrant A Data is divided into 100 sec bins |
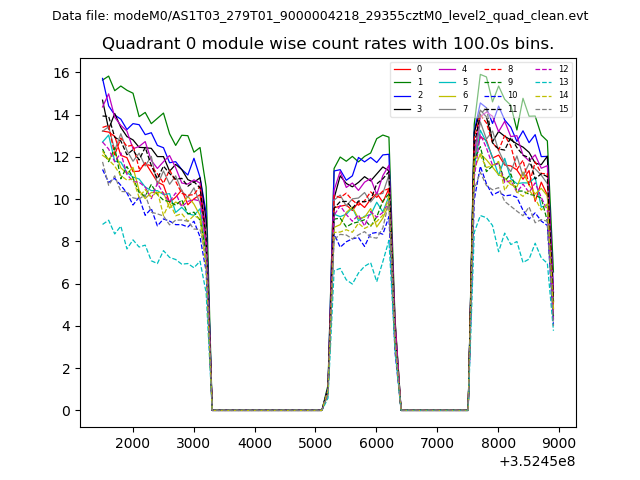 |
 |
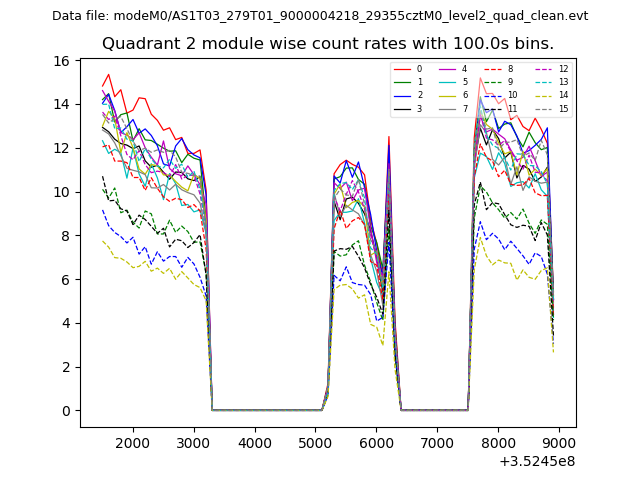
| Module-wise count rates for Quadrant B Data is divided into 100 sec bins |
 |
 |
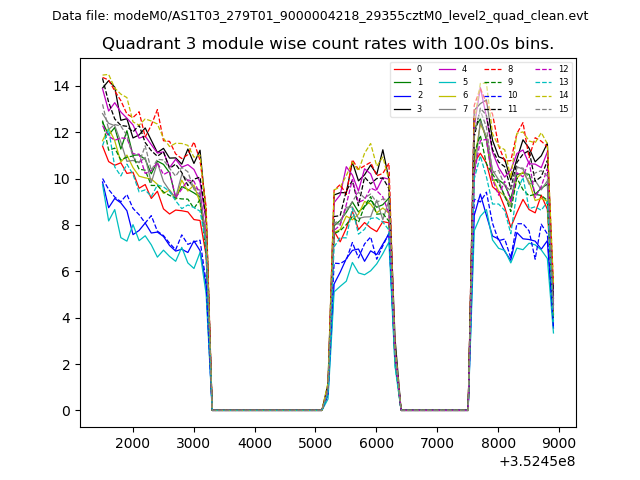
| Module-wise count rates for Quadrant C Data is divided into 100 sec bins |
 |
 |
| Module-wise count rates for Quadrant D Data is divided into 100 sec bins |
 |
 |
| Parameter | Plot |
|---|---|
| CZT HV Monitor | 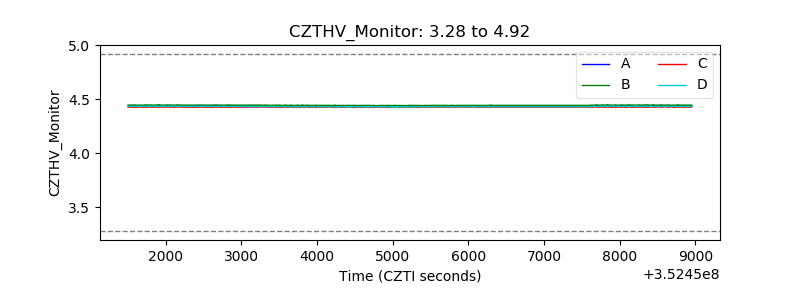 |
| D_VDD | 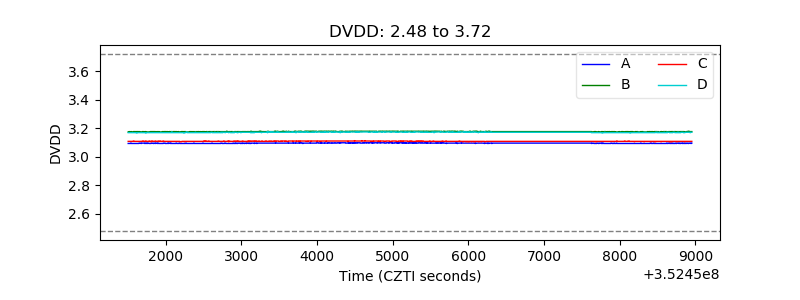 |
| Temperature 1 | 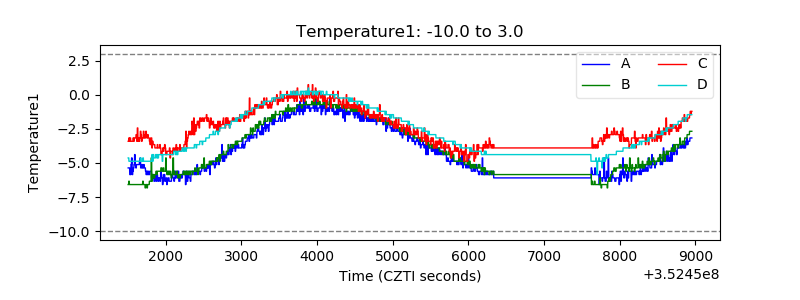 |
| Veto HV Monitor | 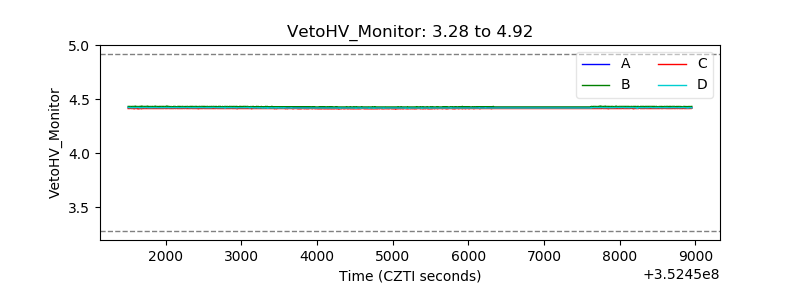 |
| Veto LLD | 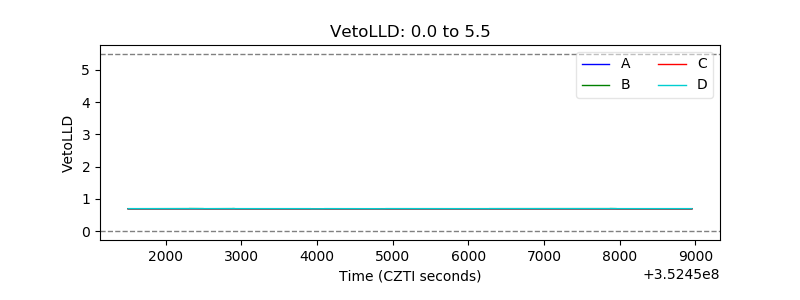 |
| Alpha Counter | 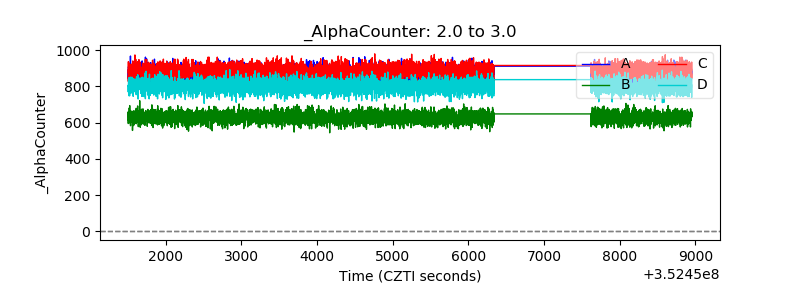 |
| _CPM_Rate | 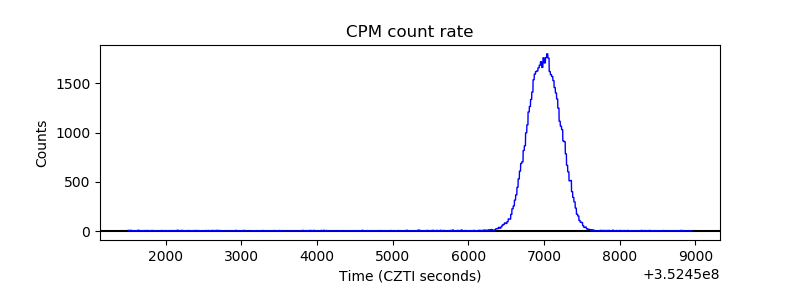 |
| CZT Counter | 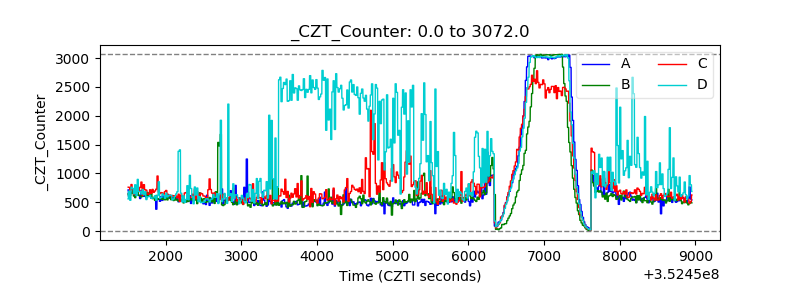 |
| +2.5 Volts monitor |  |
| +5 Volts monitor |  |
| _ROLL_ROT |  |
| _Roll_DEC |  |
| _Roll_RA | 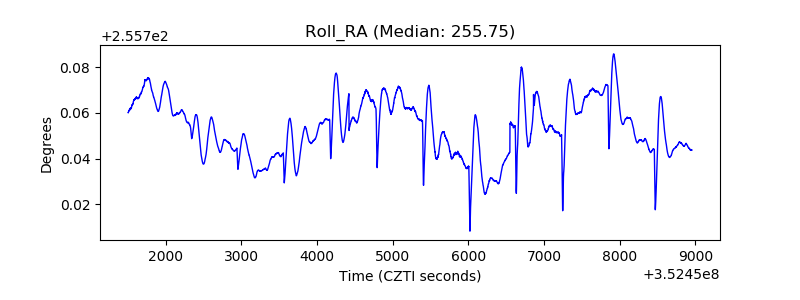 |
| Veto Counter |  |