| Param | Original file | Final file |
|---|---|---|
| Filename | modeM0/AS1T03_279T01_9000004218_29356cztM0_level2.evt | modeM0/AS1T03_279T01_9000004218_29356cztM0_level2_quad_clean.evt |
| Size (bytes) | 616,564,800 | 91,958,400 |
| Size | 588.0 MB | 87.7 MB |
| Events in quadrant A | 3,137,381 | 626,199 |
| Events in quadrant B | 3,523,565 | 624,337 |
| Events in quadrant C | 3,447,148 | 594,862 |
| Events in quadrant D | 8,162,614 | 524,210 |
| Mode SS | |||
|---|---|---|---|
| Quadrant | BADHDUFLAG | Total packets | Discarded packets |
| A | 0 | 122 | 0 |
| B | 0 | 122 | 0 |
| C | 0 | 122 | 0 |
| D | 0 | 122 | 0 |
| Mode M9 | |||
|---|---|---|---|
| Quadrant | BADHDUFLAG | Total packets | Discarded packets |
| A | 0 | 12 | 0 |
| B | 0 | 12 | 0 |
| C | 0 | 12 | 0 |
| D | 0 | 12 | 0 |
| Mode M0 | |||
|---|---|---|---|
| Quadrant | BADHDUFLAG | Total packets | Discarded packets |
| A | 0 | 12626 | 1 |
| B | 0 | 13917 | 1 |
| C | 0 | 13928 | 1 |
| D | 0 | 28439 | 1 |
| Quadrant | Total seconds | Saturated seconds | Saturation percentage |
|---|---|---|---|
| A | 5934 | 52 | 0.876306% |
| B | 5935 | 156 | 2.628475% |
| C | 5935 | 126 | 2.122999% |
| D | 5934 | 1603 | 27.013819% |
Noise dominated data is calculated using 1-second bins in cleaned event files. If a bin has >2000 counts, and if more than 50% of those come from <1% of pixels, then it is considered to be noise-dominated and hence unusable.
| Quadrant | # 1 sec bins | Bins with >0 counts | Bins with >2000 counts | High rate bins dominated by noise | Noise dominated (total time) | Noise dominated (detector-on time) | Marked lightcurve |
|---|---|---|---|---|---|---|---|
| A | 7179 | 5935 | 0 | 0 | 0.00% | 0.00% | 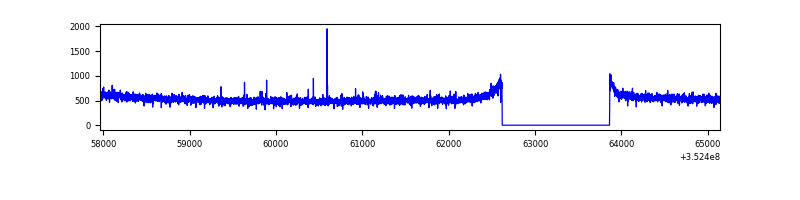 |
| B | 7180 | 5936 | 65 | 65 | 0.91% | 1.10% | 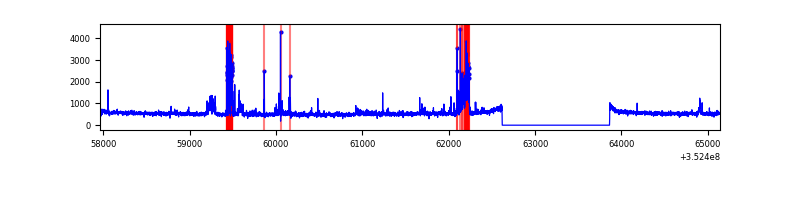 |
| C | 7180 | 5936 | 0 | 0 | 0.00% | 0.00% | 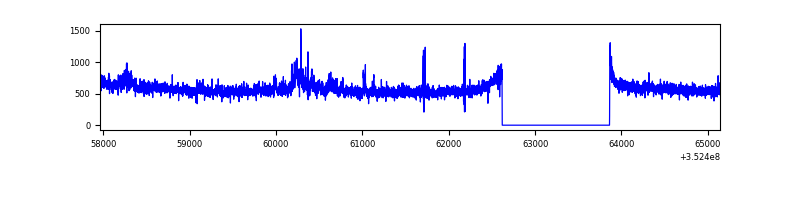 |
| D | 7179 | 5935 | 1365 | 1365 | 19.01% | 23.00% | 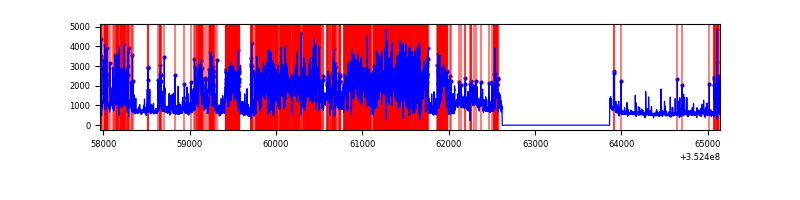 |
Top three noisy pixels from each quadrant. If the there are fewer than three noisy pixels in the level2.evt file, extra rows are filled as -1
| Pixel properties | Quadrant properties | ||||||
|---|---|---|---|---|---|---|---|
| Quadrant | DetID | PixID | Counts | Sigma | Mean | Median | Sigma |
| A | 13 | 254 | 11366 | 65.67 | 810 | 795 | 161.0 |
| A | 0 | 13 | 7195 | 39.76 | 810 | 795 | 161.0 |
| A | 0 | 226 | 7070 | 38.98 | 810 | 795 | 161.0 |
| B | 10 | 245 | 217001 | 1471.29 | 788 | 772 | 147.0 |
| B | 5 | 172 | 128485 | 869.0 | 788 | 772 | 147.0 |
| B | 15 | 33 | 41390 | 276.38 | 788 | 772 | 147.0 |
| C | 3 | 233 | 252114 | 1401.96 | 773 | 780 | 179.3 |
| C | 14 | 238 | 132232 | 733.25 | 773 | 780 | 179.3 |
| C | 10 | 9 | 20879 | 112.11 | 773 | 780 | 179.3 |
| D | 1 | 52 | 3877975 | 22667.88 | 720 | 703 | 171.0 |
| D | 13 | 104 | 451157 | 2633.51 | 720 | 703 | 171.0 |
| D | 7 | 80 | 426058 | 2486.77 | 720 | 703 | 171.0 |
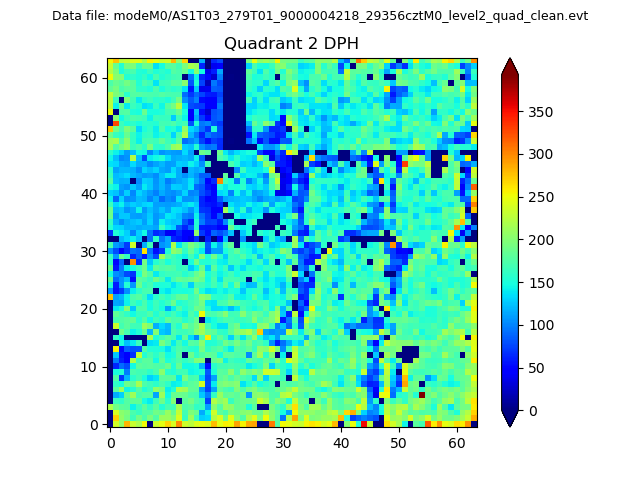
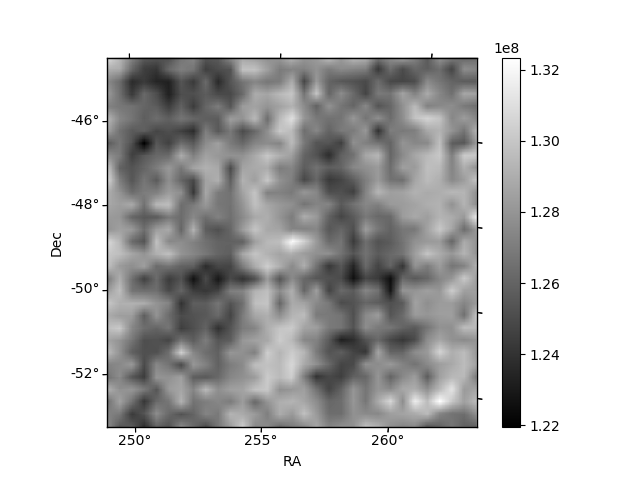
Histogram calculated using DETX and DETY for each event in the final _common_clean file
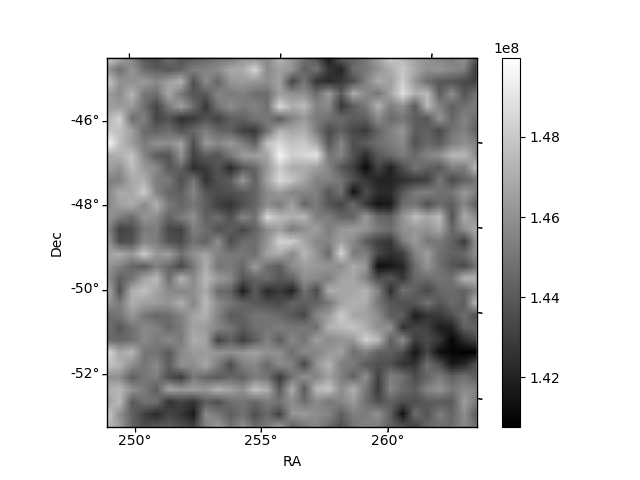
| Quadrant A | 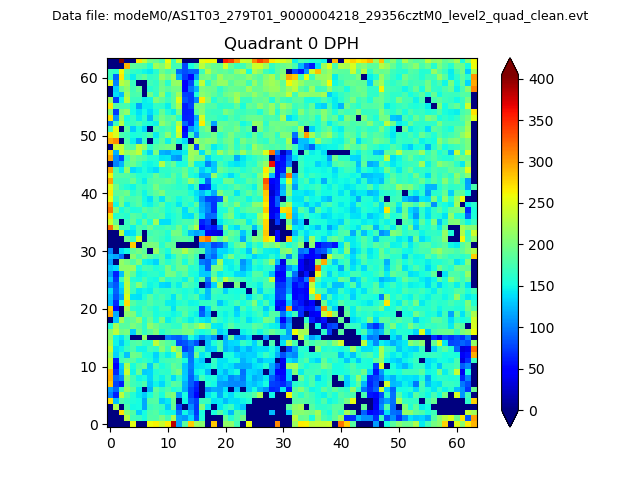 |
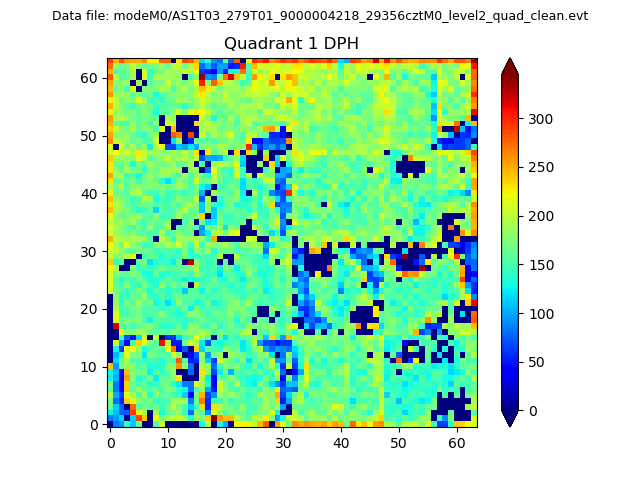 |
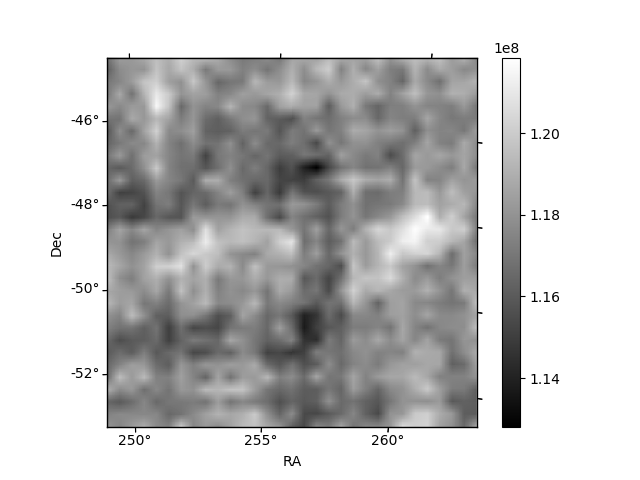
Quadrant B |
|---|---|---|---|
| Quadrant D | 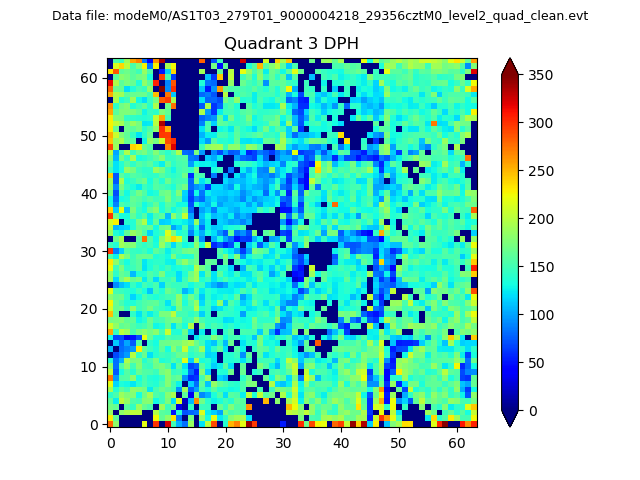 |
 |
Quadrant C |
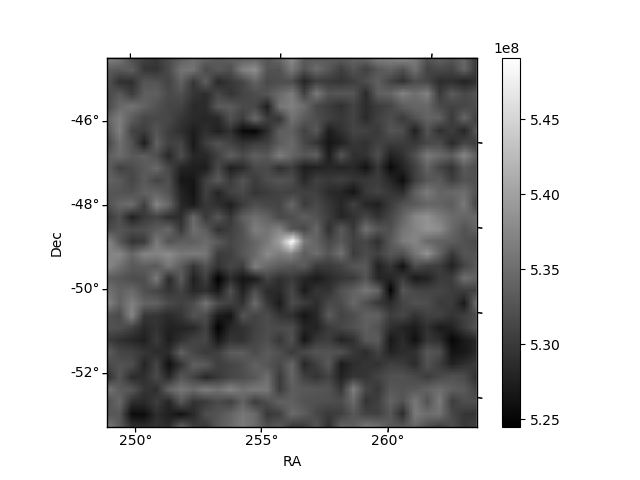
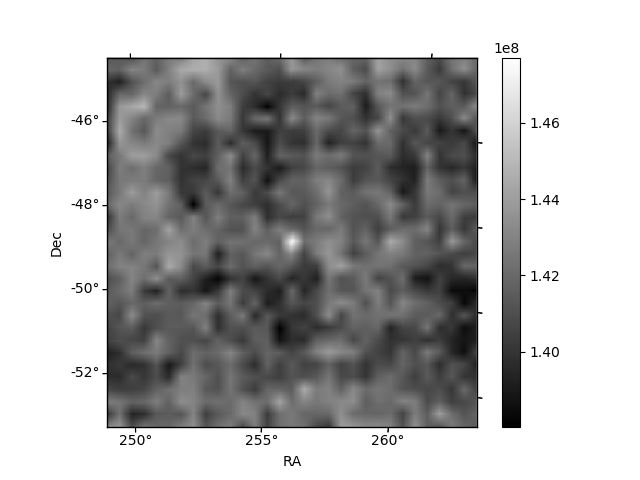
| Plot type | Count rate plots | Images |
|---|---|---|
| Comparison with Poisson distribution Blue bars denote a histogram of data divided into 1 sec bins. Red curve is a Poisson curve with rate = median count rate of data. |
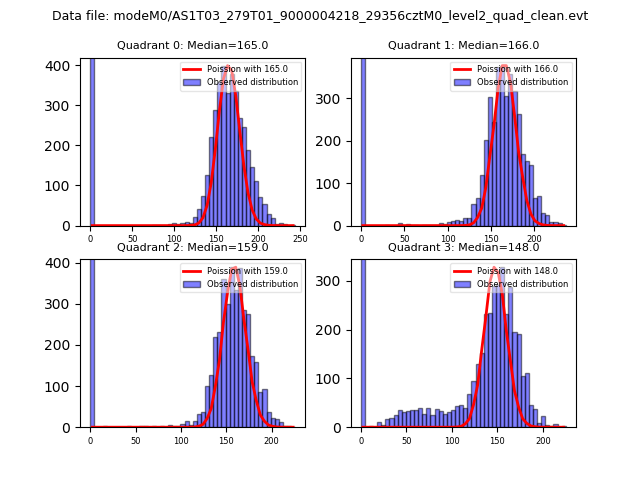 |
 |
| Quadrant-wise count rates Data is divided into 100 sec bins |
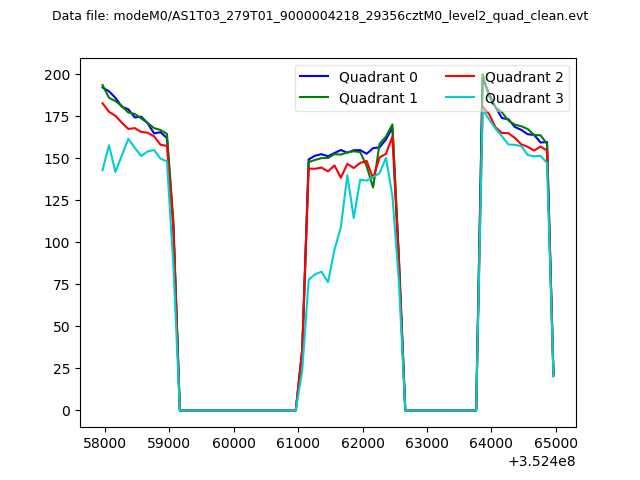 |
|
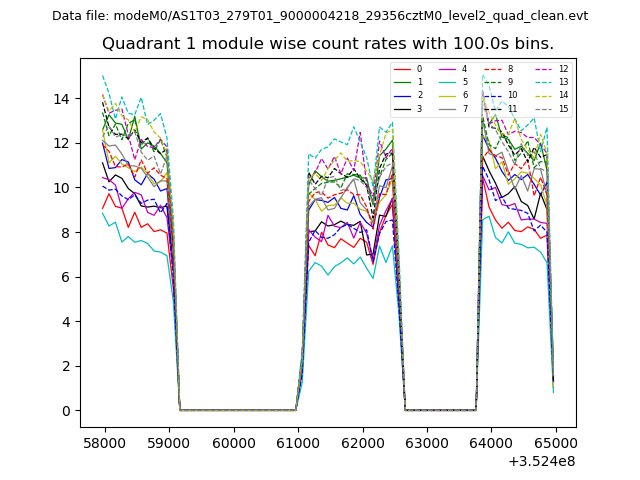
| Module-wise count rates for Quadrant A Data is divided into 100 sec bins |
 |
 |
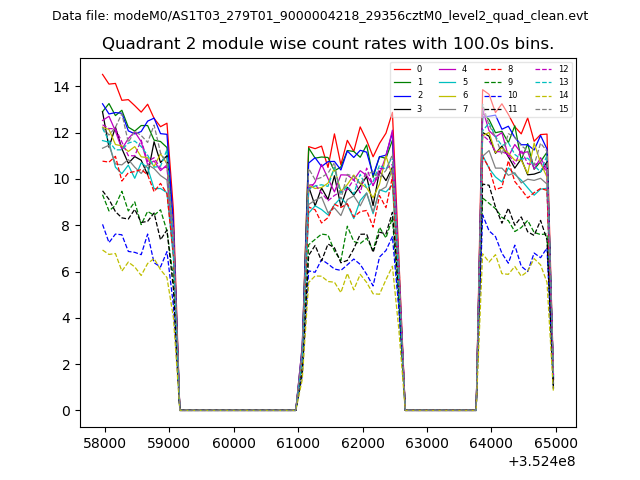
| Module-wise count rates for Quadrant B Data is divided into 100 sec bins |
 |
 |
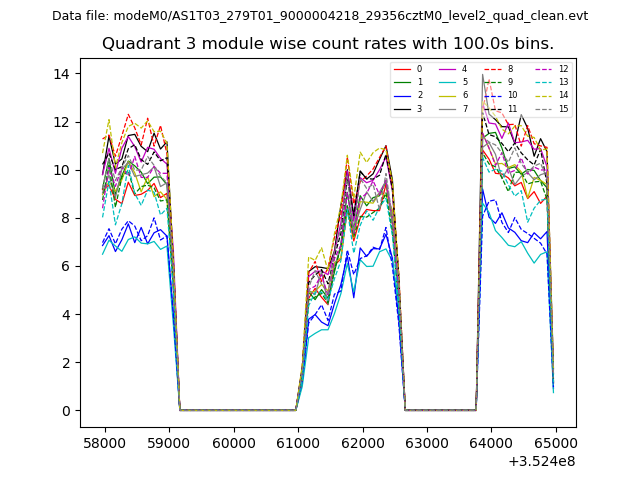
| Module-wise count rates for Quadrant C Data is divided into 100 sec bins |
 |
 |
| Module-wise count rates for Quadrant D Data is divided into 100 sec bins |
 |
 |
| Parameter | Plot |
|---|---|
| CZT HV Monitor | 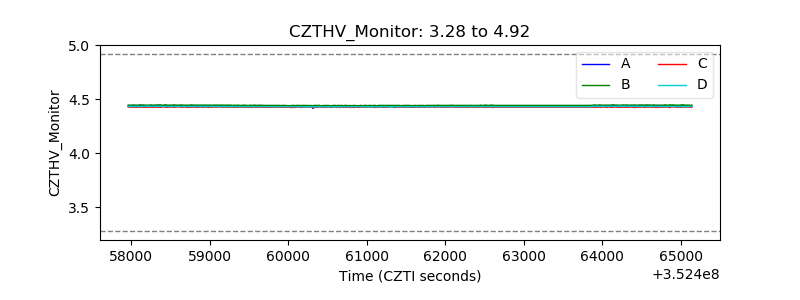 |
| D_VDD | 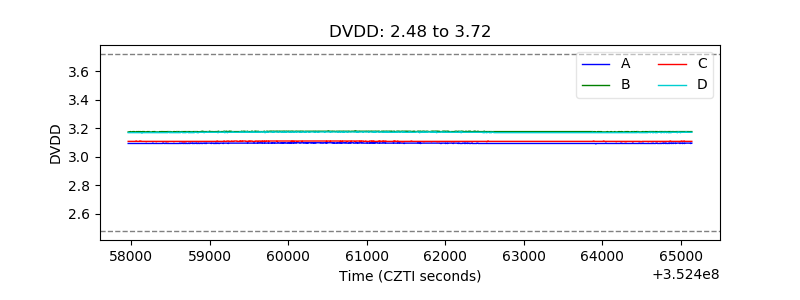 |
| Temperature 1 | 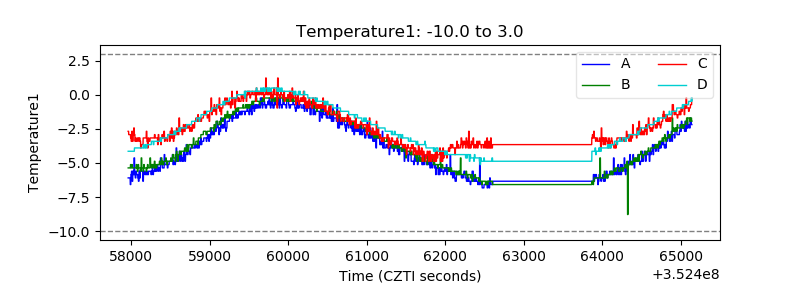 |
| Veto HV Monitor | 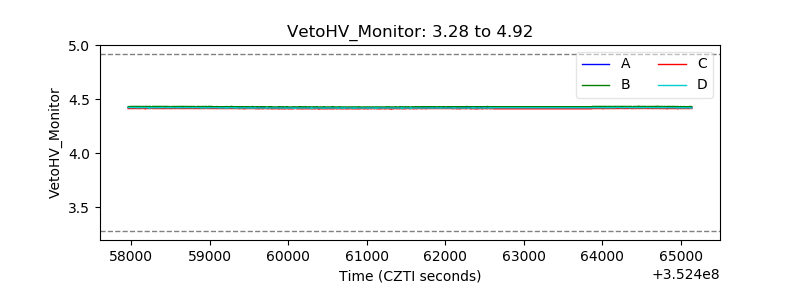 |
| Veto LLD | 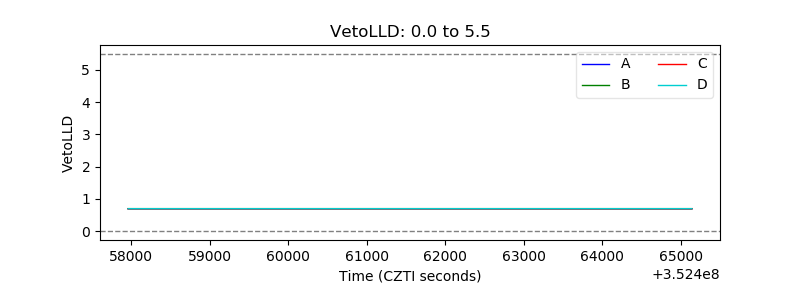 |
| Alpha Counter |  |
| _CPM_Rate | 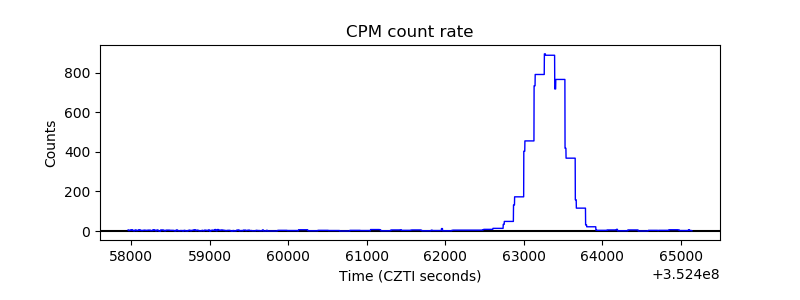 |
| CZT Counter | 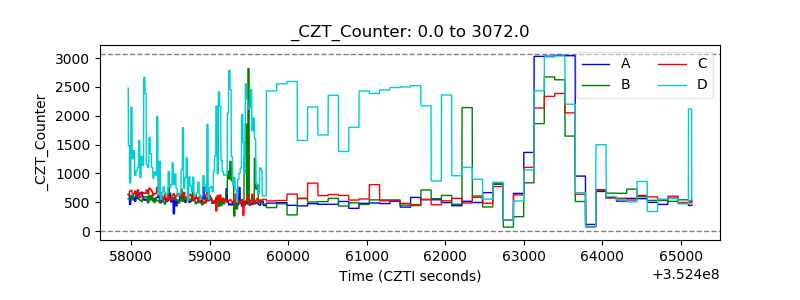 |
| +2.5 Volts monitor |  |
| +5 Volts monitor | 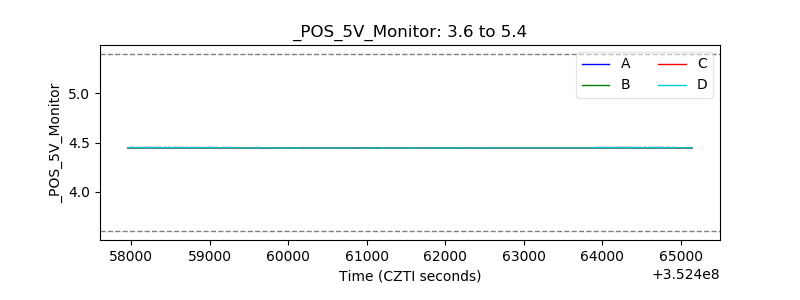 |
| _ROLL_ROT | 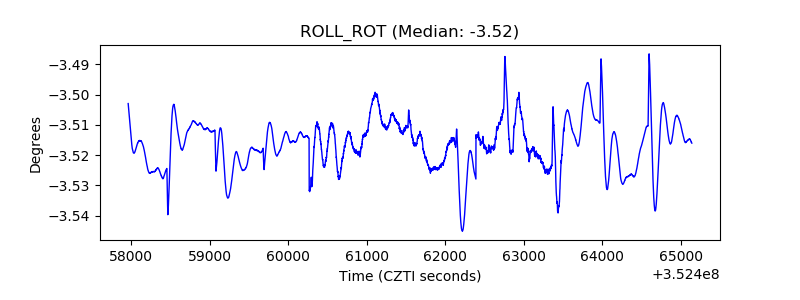 |
| _Roll_DEC | 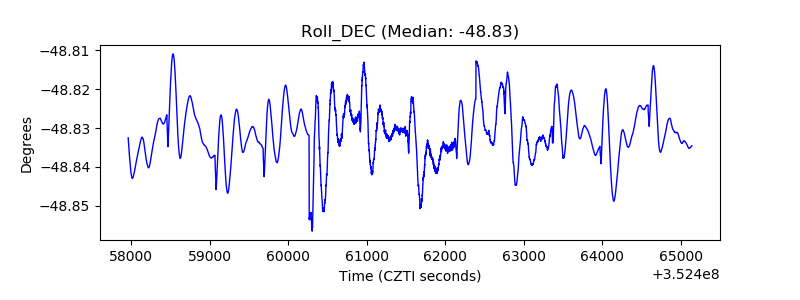 |
| _Roll_RA | 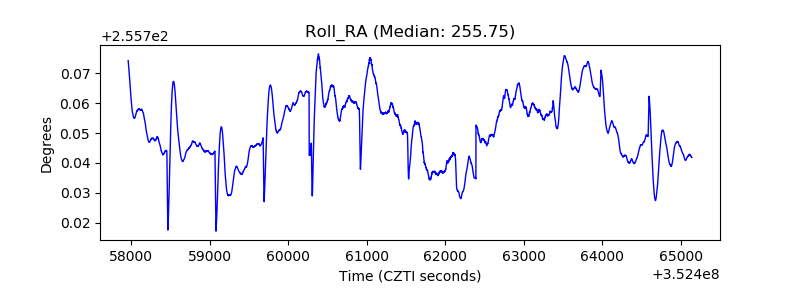 |
| Veto Counter | 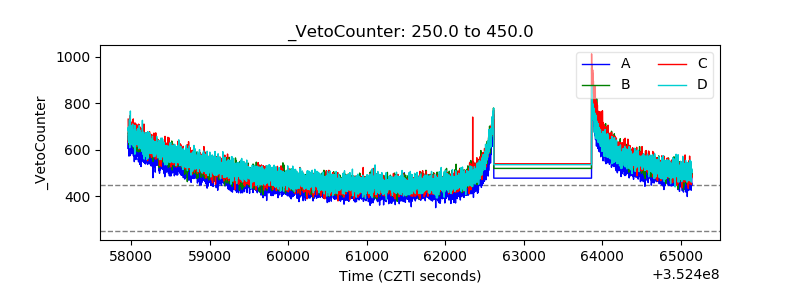 |