| Param | Original file | Final file |
|---|---|---|
| Filename | modeM0/AS1T03_279T01_9000004218_29357cztM0_level2.evt | modeM0/AS1T03_279T01_9000004218_29357cztM0_level2_quad_clean.evt |
| Size (bytes) | 675,434,880 | 93,093,120 |
| Size | 644.1 MB | 88.8 MB |
| Events in quadrant A | 3,512,535 | 609,209 |
| Events in quadrant B | 3,950,776 | 612,032 |
| Events in quadrant C | 4,899,125 | 577,328 |
| Events in quadrant D | 7,628,734 | 541,497 |
| Mode SS | |||
|---|---|---|---|
| Quadrant | BADHDUFLAG | Total packets | Discarded packets |
| A | 0 | 138 | 0 |
| B | 0 | 138 | 0 |
| C | 0 | 138 | 0 |
| D | 0 | 138 | 0 |
| Mode M9 | |||
|---|---|---|---|
| Quadrant | BADHDUFLAG | Total packets | Discarded packets |
| A | 0 | 11 | 0 |
| B | 0 | 11 | 0 |
| C | 0 | 11 | 0 |
| D | 0 | 11 | 0 |
| Mode M0 | |||
|---|---|---|---|
| Quadrant | BADHDUFLAG | Total packets | Discarded packets |
| A | 0 | 14414 | 1 |
| B | 0 | 15784 | 1 |
| C | 0 | 19590 | 1 |
| D | 0 | 27440 | 1 |
| Quadrant | Total seconds | Saturated seconds | Saturation percentage |
|---|---|---|---|
| A | 6878 | 97 | 1.410294% |
| B | 6879 | 171 | 2.485826% |
| C | 6879 | 180 | 2.616659% |
| D | 6879 | 1074 | 15.612734% |
Noise dominated data is calculated using 1-second bins in cleaned event files. If a bin has >2000 counts, and if more than 50% of those come from <1% of pixels, then it is considered to be noise-dominated and hence unusable.
| Quadrant | # 1 sec bins | Bins with >0 counts | Bins with >2000 counts | High rate bins dominated by noise | Noise dominated (total time) | Noise dominated (detector-on time) | Marked lightcurve |
|---|---|---|---|---|---|---|---|
| A | 7923 | 6879 | 0 | 0 | 0.00% | 0.00% | 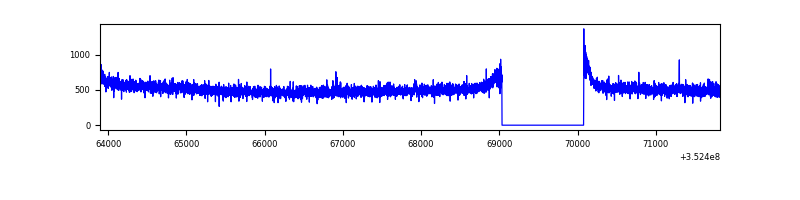 |
| B | 7924 | 6880 | 44 | 44 | 0.56% | 0.64% | 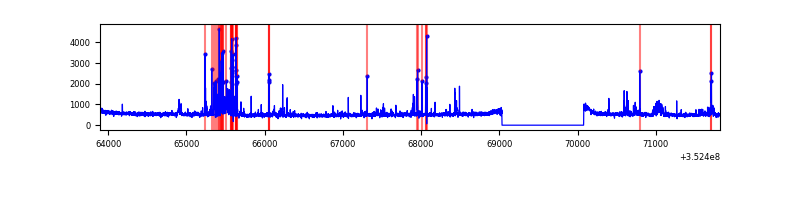 |
| C | 7924 | 6880 | 0 | 0 | 0.00% | 0.00% | 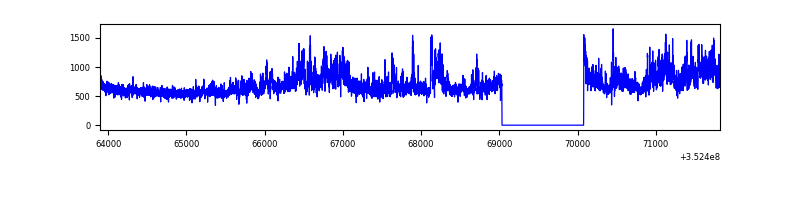 |
| D | 7924 | 6880 | 829 | 829 | 10.46% | 12.05% | 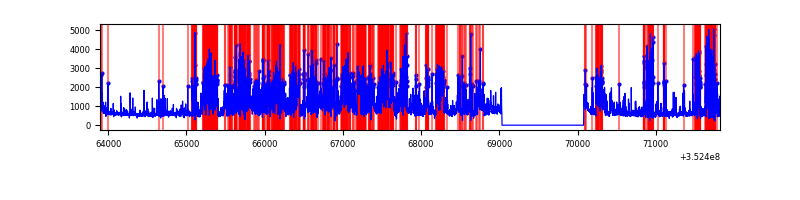 |
Top three noisy pixels from each quadrant. If the there are fewer than three noisy pixels in the level2.evt file, extra rows are filled as -1
| Pixel properties | Quadrant properties | ||||||
|---|---|---|---|---|---|---|---|
| Quadrant | DetID | PixID | Counts | Sigma | Mean | Median | Sigma |
| A | 13 | 254 | 13365 | 69.41 | 907 | 890 | 179.7 |
| A | 1 | 113 | 10103 | 51.26 | 907 | 890 | 179.7 |
| A | 3 | 137 | 7939 | 39.22 | 907 | 890 | 179.7 |
| B | 5 | 172 | 210683 | 1270.34 | 888 | 870 | 165.2 |
| B | 15 | 33 | 59756 | 356.53 | 888 | 870 | 165.2 |
| B | 0 | 229 | 45507 | 270.26 | 888 | 870 | 165.2 |
| C | 3 | 233 | 1360735 | 6806.08 | 865 | 872 | 199.8 |
| C | 14 | 238 | 137599 | 684.32 | 865 | 872 | 199.8 |
| C | 2 | 114 | 16699 | 79.21 | 865 | 872 | 199.8 |
| D | 1 | 52 | 3026256 | 15259.96 | 837 | 817 | 198.3 |
| D | 7 | 80 | 547145 | 2755.62 | 837 | 817 | 198.3 |
| D | 13 | 153 | 417207 | 2100.22 | 837 | 817 | 198.3 |
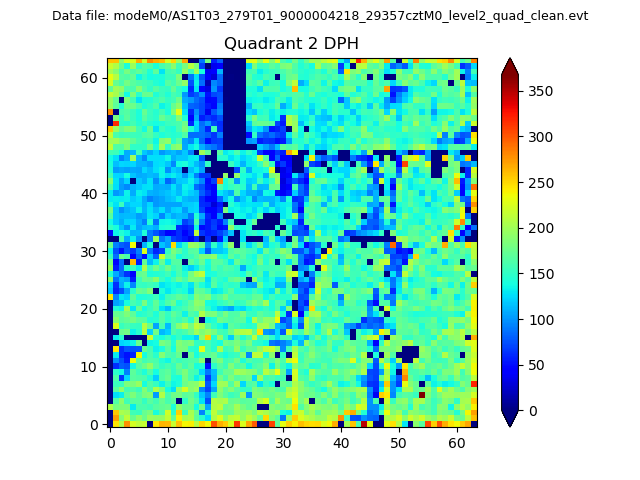
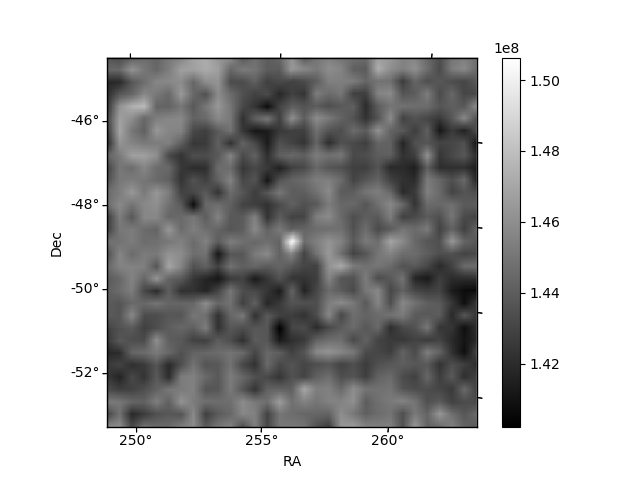
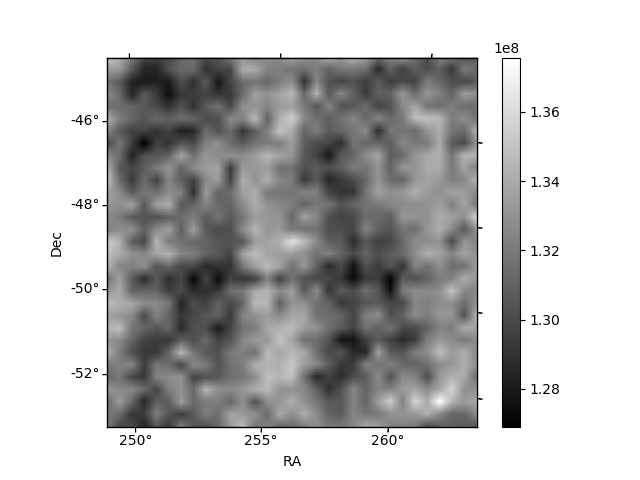
Histogram calculated using DETX and DETY for each event in the final _common_clean file
| Quadrant A |  |
 |
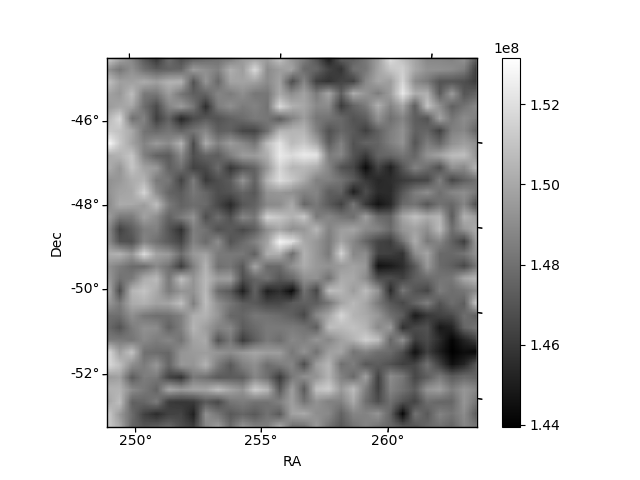
Quadrant B |
|---|---|---|---|
| Quadrant D | 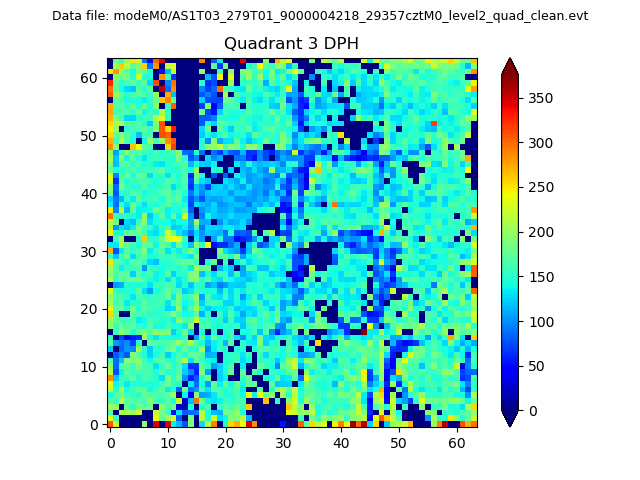 |
 |
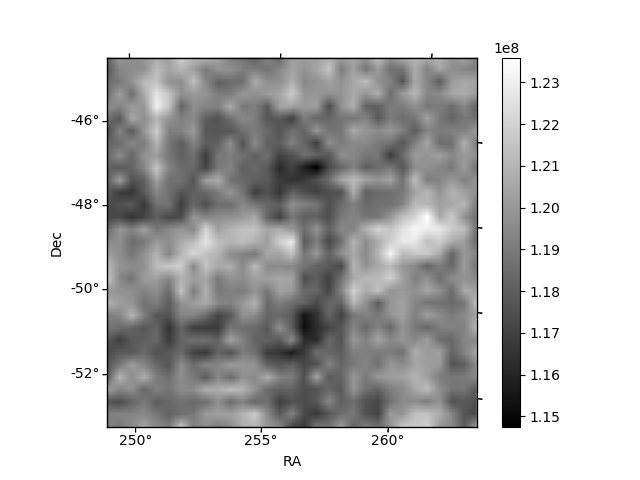
Quadrant C |
| Plot type | Count rate plots | Images |
|---|---|---|
| Comparison with Poisson distribution Blue bars denote a histogram of data divided into 1 sec bins. Red curve is a Poisson curve with rate = median count rate of data. |
 |
 |
| Quadrant-wise count rates Data is divided into 100 sec bins |
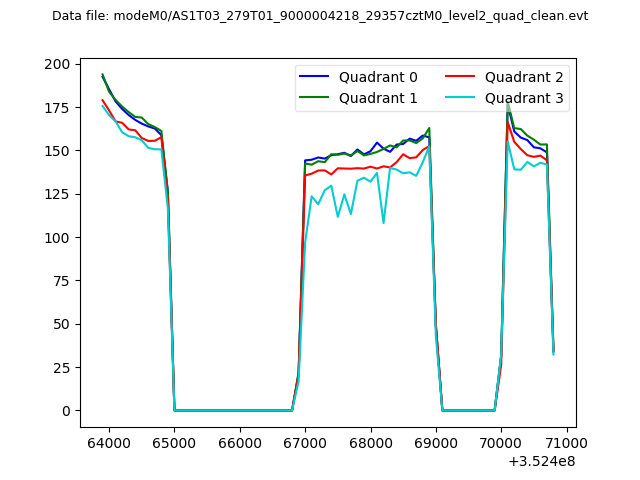 |
|
| Module-wise count rates for Quadrant A Data is divided into 100 sec bins |
 |
 |
| Module-wise count rates for Quadrant B Data is divided into 100 sec bins |
 |
 |
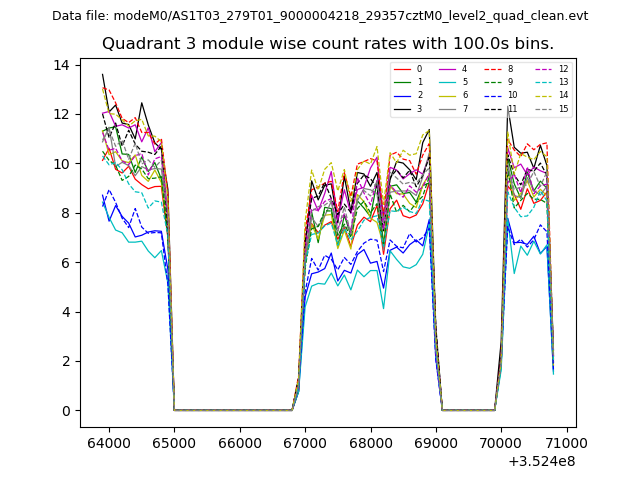
| Module-wise count rates for Quadrant C Data is divided into 100 sec bins |
 |
 |
| Module-wise count rates for Quadrant D Data is divided into 100 sec bins |
 |
 |
| Parameter | Plot |
|---|---|
| CZT HV Monitor |  |
| D_VDD | 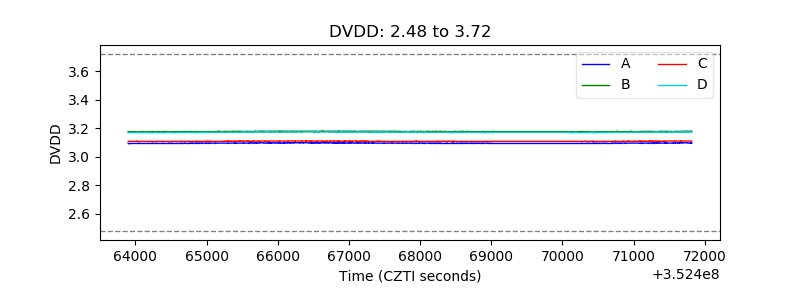 |
| Temperature 1 | 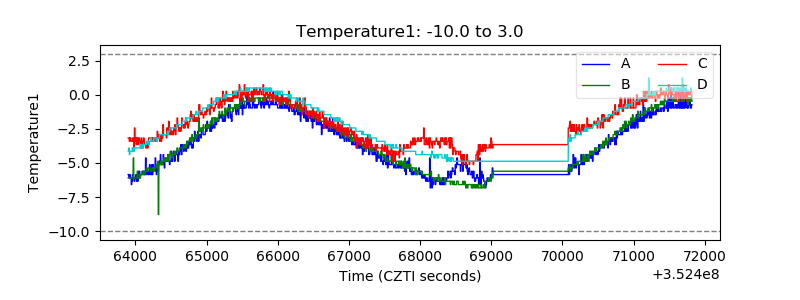 |
| Veto HV Monitor | 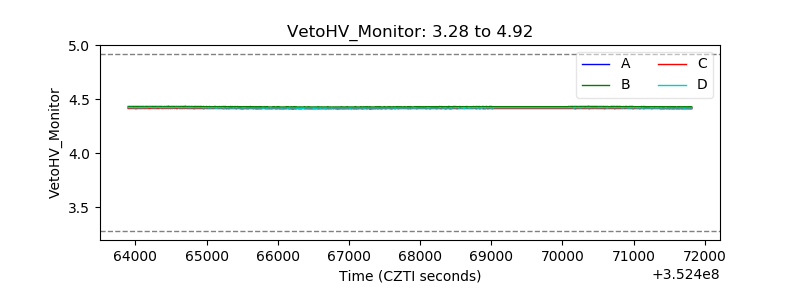 |
| Veto LLD | 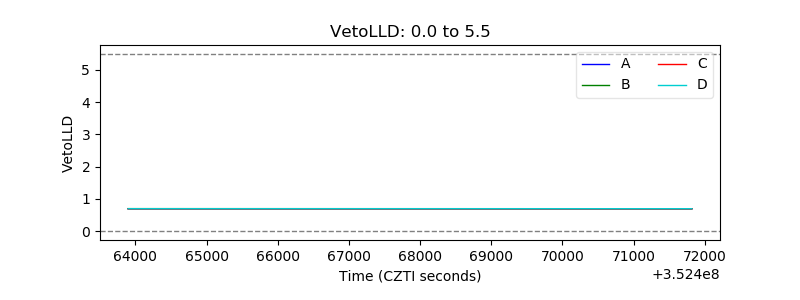 |
| Alpha Counter | 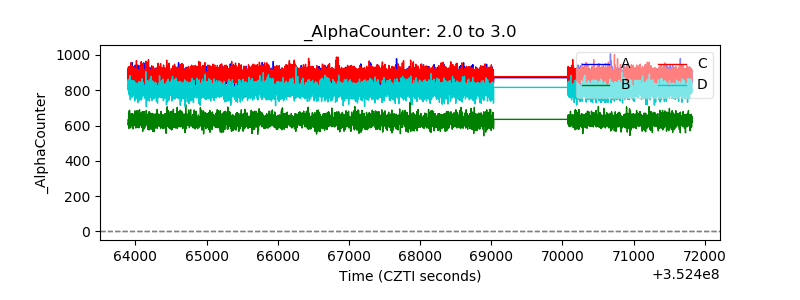 |
| _CPM_Rate | 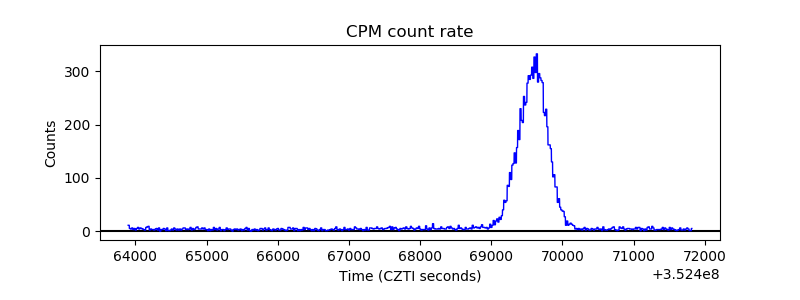 |
| CZT Counter | 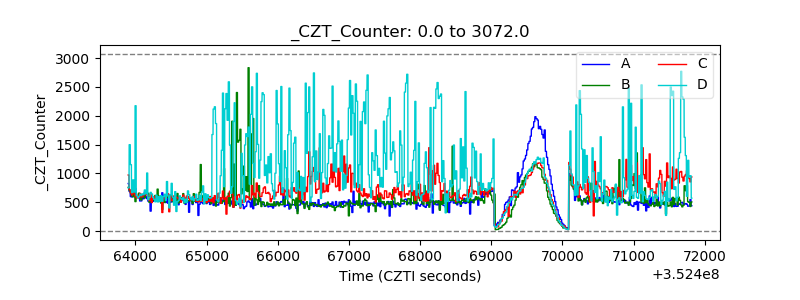 |
| +2.5 Volts monitor |  |
| +5 Volts monitor |  |
| _ROLL_ROT | 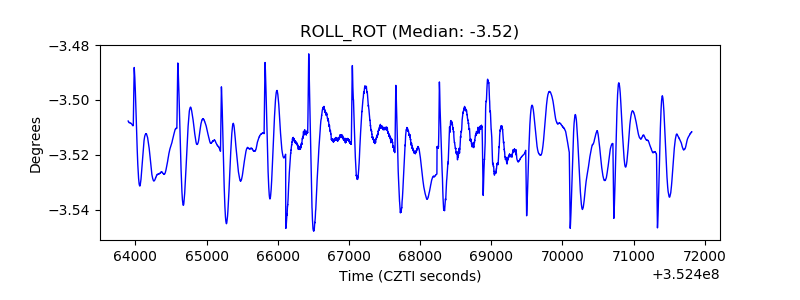 |
| _Roll_DEC | 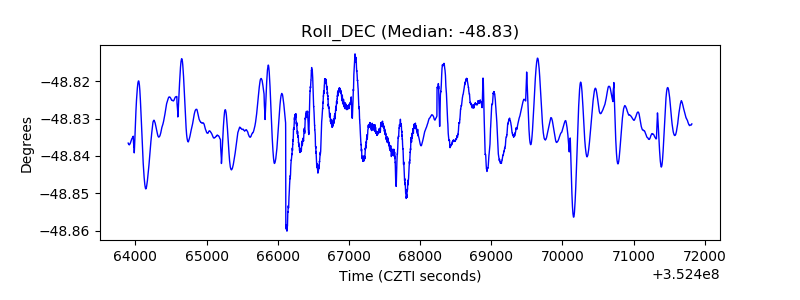 |
| _Roll_RA | 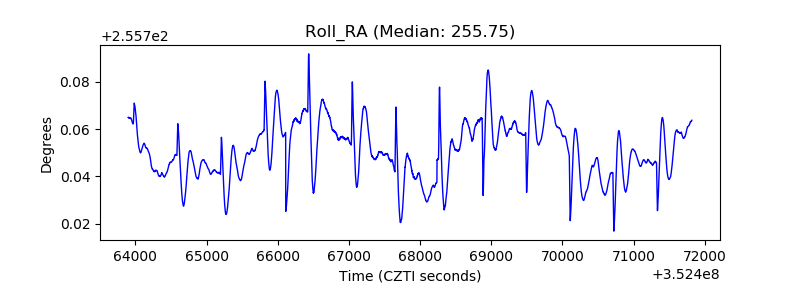 |
| Veto Counter | 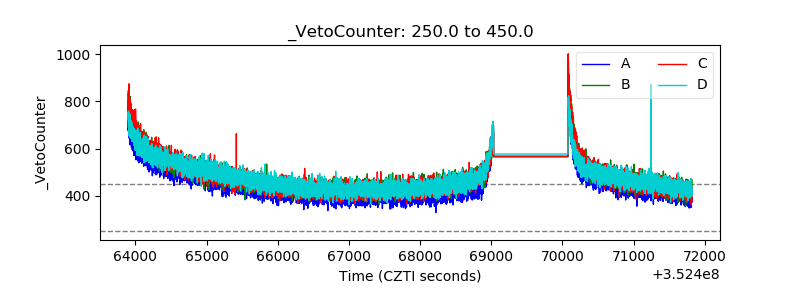 |