| Param | Original file | Final file |
|---|---|---|
| Filename | modeM0/AS1T03_279T01_9000004218_29358cztM0_level2.evt | modeM0/AS1T03_279T01_9000004218_29358cztM0_level2_quad_clean.evt |
| Size (bytes) | 782,259,840 | 87,998,400 |
| Size | 746.0 MB | 83.9 MB |
| Events in quadrant A | 5,429,476 | 541,850 |
| Events in quadrant B | 3,976,129 | 574,202 |
| Events in quadrant C | 5,100,925 | 546,664 |
| Events in quadrant D | 8,695,659 | 497,644 |
| Mode SS | |||
|---|---|---|---|
| Quadrant | BADHDUFLAG | Total packets | Discarded packets |
| A | 0 | 146 | 0 |
| B | 0 | 146 | 0 |
| C | 0 | 146 | 0 |
| D | 0 | 146 | 0 |
| Mode M9 | |||
|---|---|---|---|
| Quadrant | BADHDUFLAG | Total packets | Discarded packets |
| A | 0 | 7 | 0 |
| B | 0 | 8 | 0 |
| C | 0 | 8 | 0 |
| D | 0 | 8 | 0 |
| Mode M0 | |||
|---|---|---|---|
| Quadrant | BADHDUFLAG | Total packets | Discarded packets |
| A | 0 | 20539 | 2 |
| B | 0 | 16173 | 2 |
| C | 0 | 19951 | 2 |
| D | 0 | 30870 | 2 |
| Quadrant | Total seconds | Saturated seconds | Saturation percentage |
|---|---|---|---|
| A | 7237 | 812 | 11.220119% |
| B | 7237 | 265 | 3.661738% |
| C | 7237 | 354 | 4.891530% |
| D | 7237 | 1740 | 24.043112% |
Noise dominated data is calculated using 1-second bins in cleaned event files. If a bin has >2000 counts, and if more than 50% of those come from <1% of pixels, then it is considered to be noise-dominated and hence unusable.
| Quadrant | # 1 sec bins | Bins with >0 counts | Bins with >2000 counts | High rate bins dominated by noise | Noise dominated (total time) | Noise dominated (detector-on time) | Marked lightcurve |
|---|---|---|---|---|---|---|---|
| A | 7912 | 7238 | 487 | 487 | 6.16% | 6.73% | 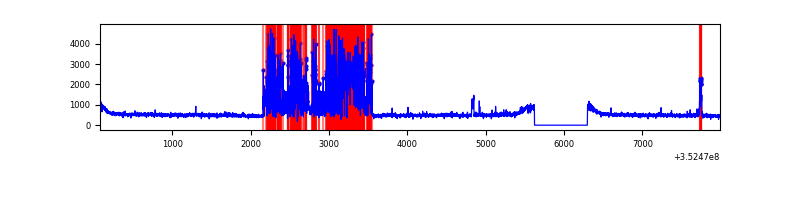 |
| B | 7912 | 7238 | 17 | 17 | 0.21% | 0.23% | 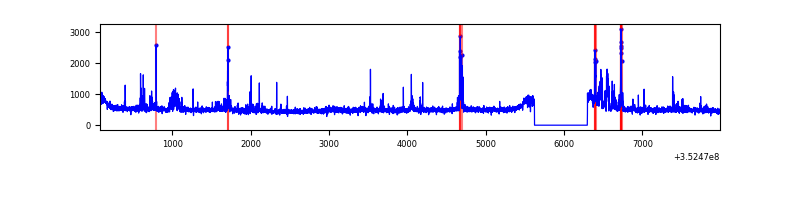 |
| C | 7912 | 7238 | 56 | 56 | 0.71% | 0.77% | 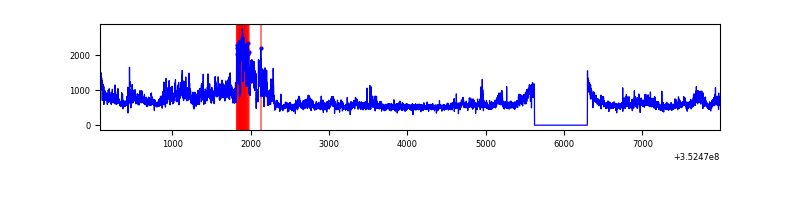 |
| D | 7911 | 7236 | 1312 | 1312 | 16.58% | 18.13% | 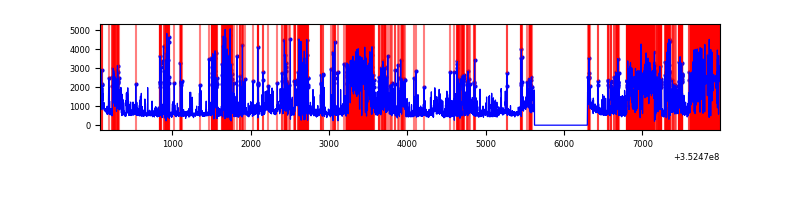 |
Top three noisy pixels from each quadrant. If the there are fewer than three noisy pixels in the level2.evt file, extra rows are filled as -1
| Pixel properties | Quadrant properties | ||||||
|---|---|---|---|---|---|---|---|
| Quadrant | DetID | PixID | Counts | Sigma | Mean | Median | Sigma |
| A | 1 | 113 | 1896498 | 10453.58 | 903 | 885 | 181.3 |
| A | 0 | 13 | 43485 | 234.92 | 903 | 885 | 181.3 |
| A | 13 | 254 | 13753 | 70.96 | 903 | 885 | 181.3 |
| B | 10 | 245 | 147863 | 843.52 | 919 | 896 | 174.2 |
| B | 15 | 33 | 58597 | 331.18 | 919 | 896 | 174.2 |
| B | 0 | 229 | 49431 | 278.57 | 919 | 896 | 174.2 |
| C | 3 | 233 | 1469652 | 7006.83 | 888 | 895 | 209.6 |
| C | 14 | 238 | 141904 | 672.7 | 888 | 895 | 209.6 |
| C | 2 | 114 | 17731 | 80.32 | 888 | 895 | 209.6 |
| D | 1 | 52 | 2647272 | 13776.34 | 812 | 792 | 192.1 |
| D | 7 | 80 | 1179276 | 6134.64 | 812 | 792 | 192.1 |
| D | 12 | 233 | 697679 | 3627.67 | 812 | 792 | 192.1 |
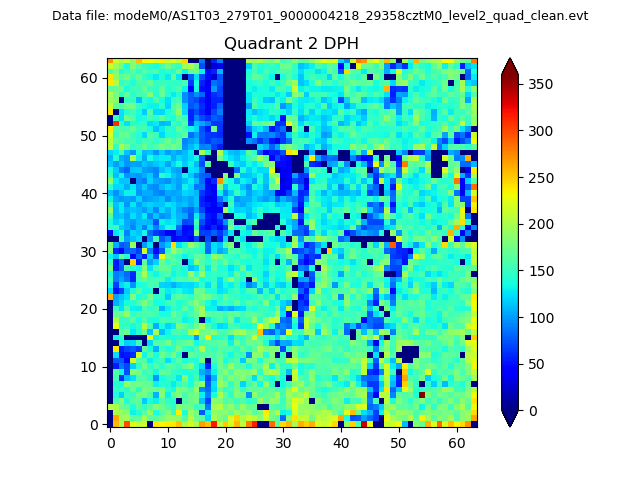
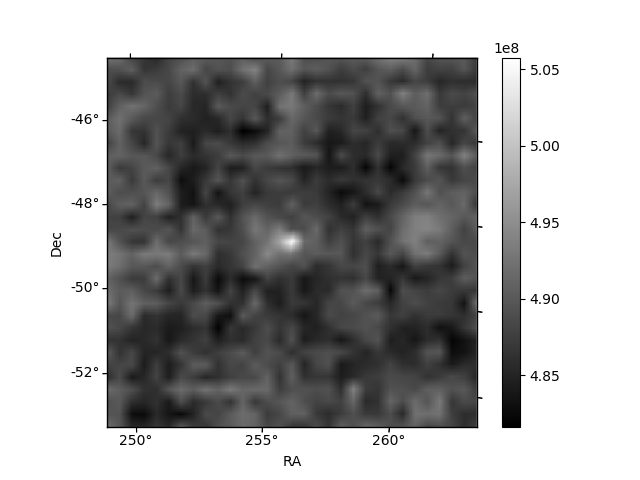
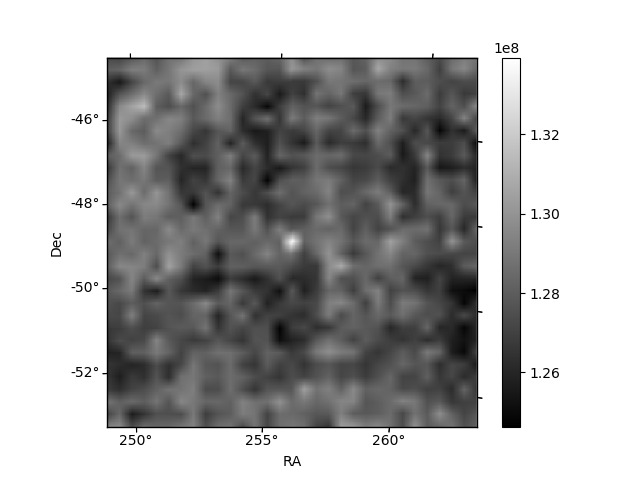
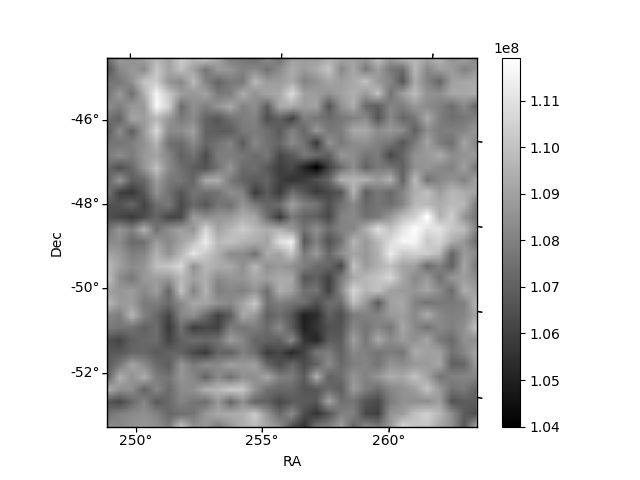
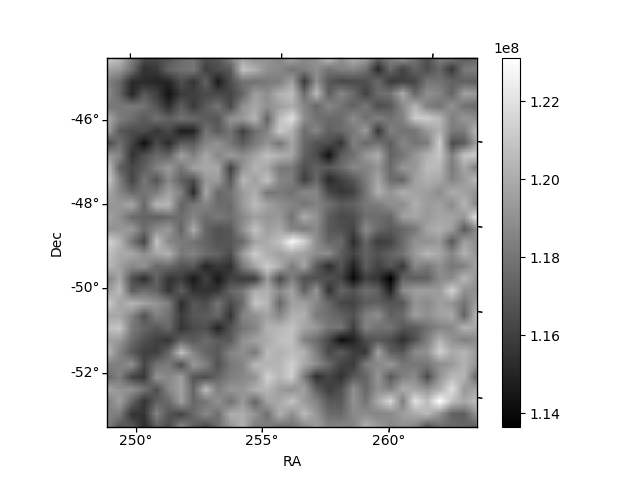
Histogram calculated using DETX and DETY for each event in the final _common_clean file
| Quadrant A | 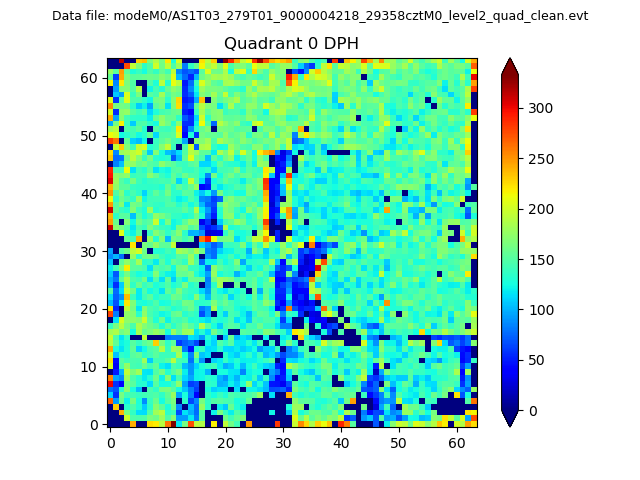 |
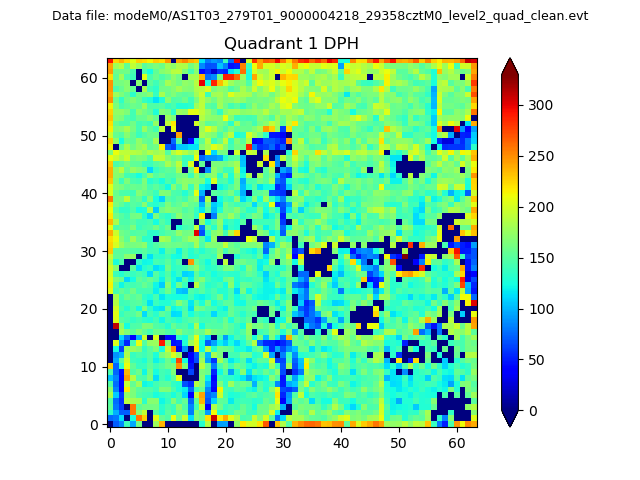 |
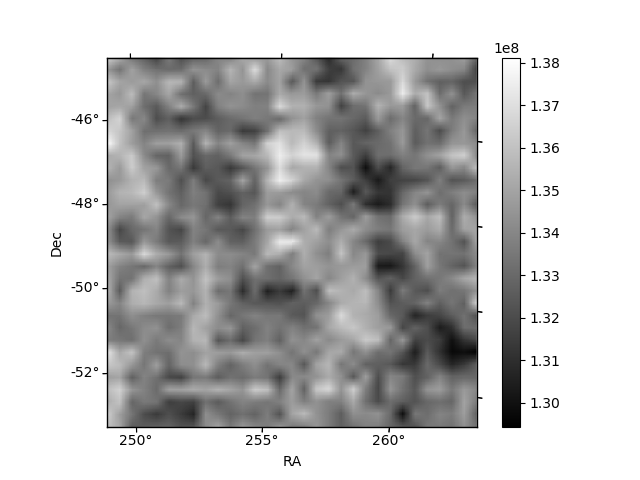
Quadrant B |
|---|---|---|---|
| Quadrant D | 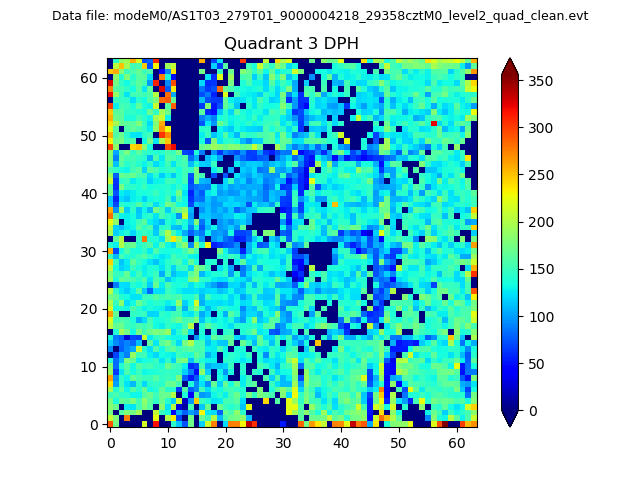 |
 |
Quadrant C |
| Plot type | Count rate plots | Images |
|---|---|---|
| Comparison with Poisson distribution Blue bars denote a histogram of data divided into 1 sec bins. Red curve is a Poisson curve with rate = median count rate of data. |
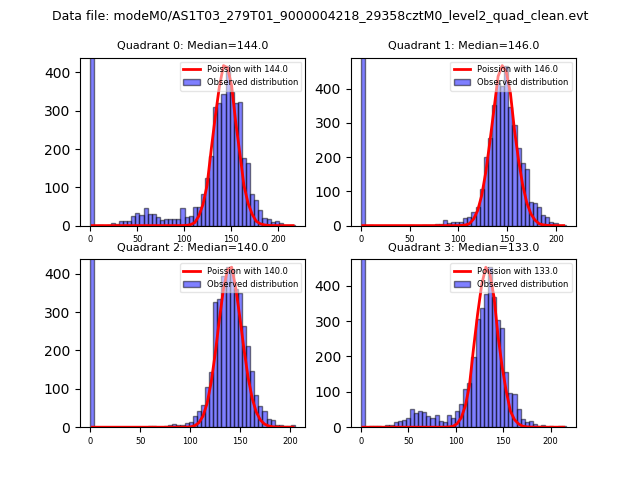 |
 |
| Quadrant-wise count rates Data is divided into 100 sec bins |
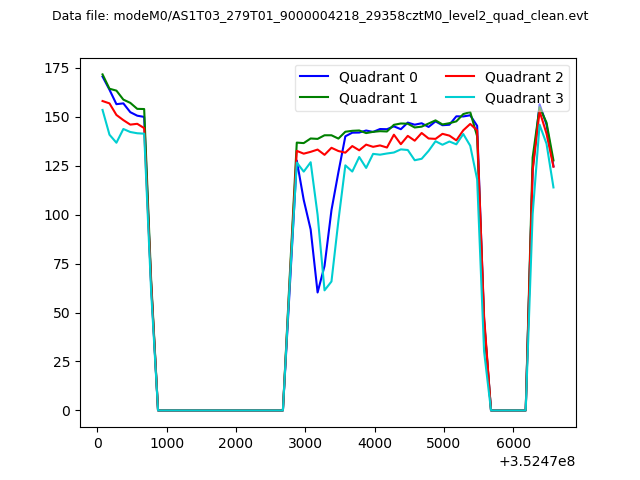 |
|
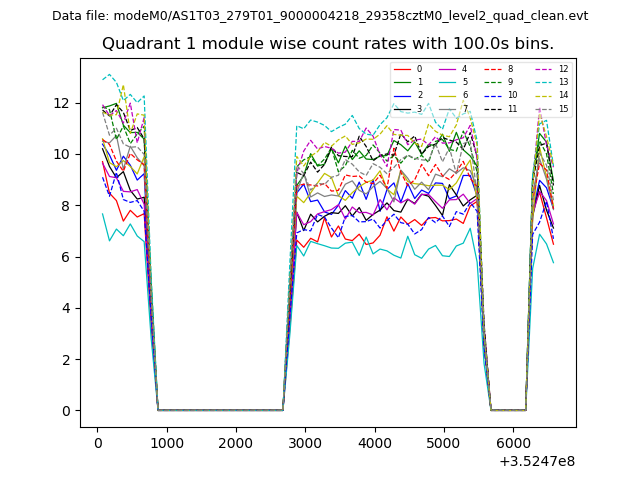
| Module-wise count rates for Quadrant A Data is divided into 100 sec bins |
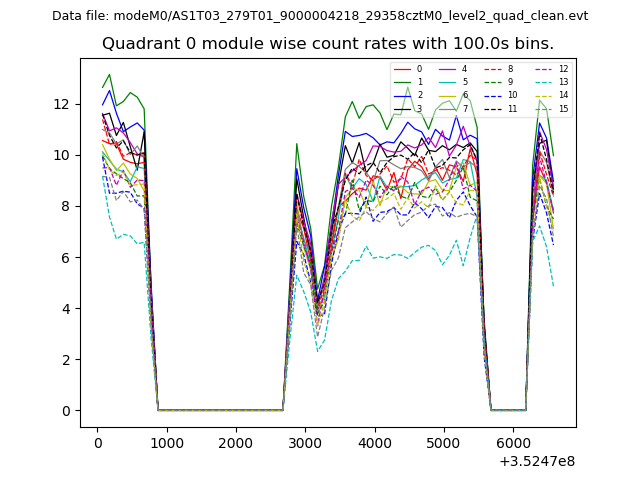 |
 |
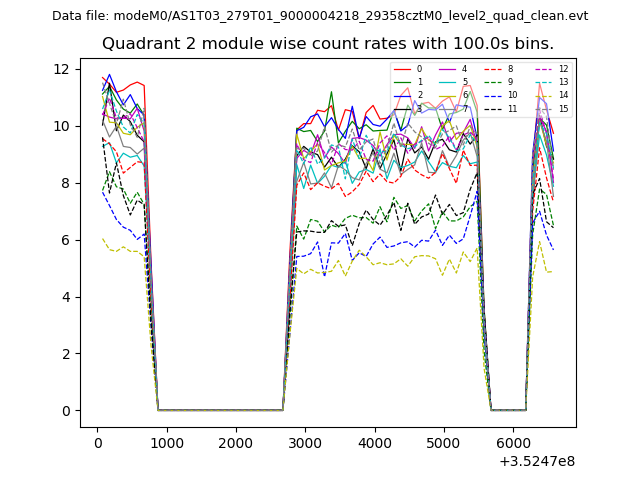
| Module-wise count rates for Quadrant B Data is divided into 100 sec bins |
 |
 |
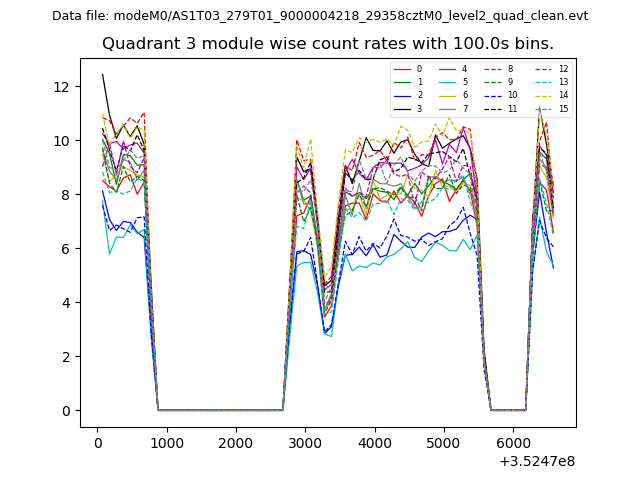
| Module-wise count rates for Quadrant C Data is divided into 100 sec bins |
 |
 |
| Module-wise count rates for Quadrant D Data is divided into 100 sec bins |
 |
 |
| Parameter | Plot |
|---|---|
| CZT HV Monitor | 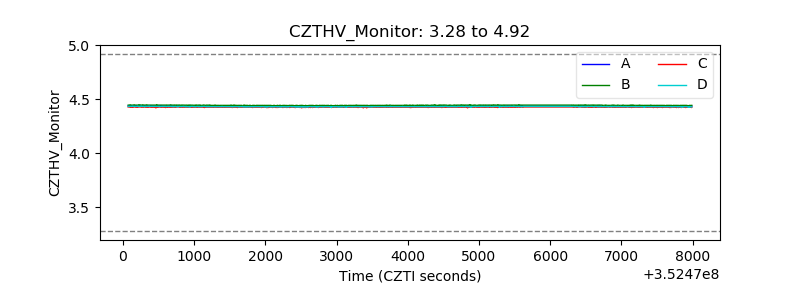 |
| D_VDD | 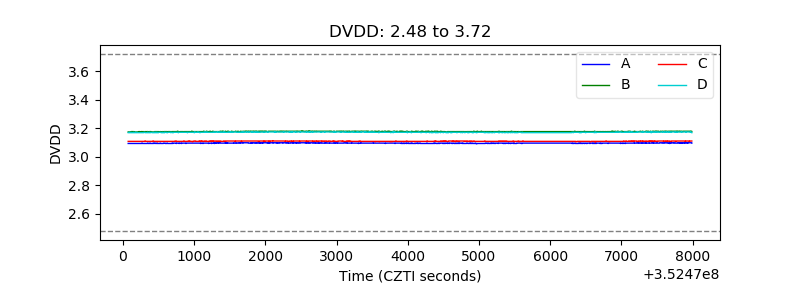 |
| Temperature 1 | 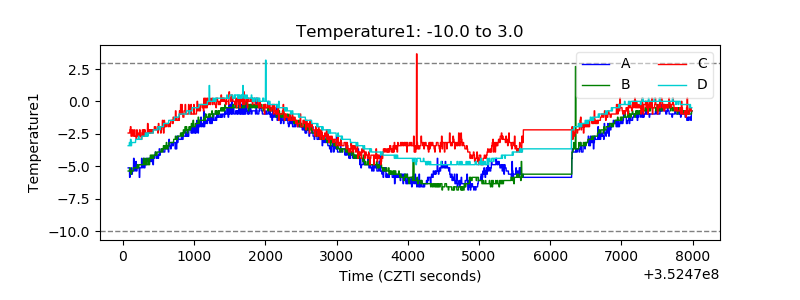 |
| Veto HV Monitor | 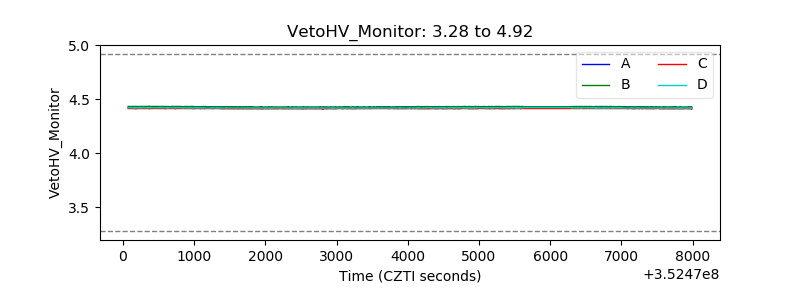 |
| Veto LLD | 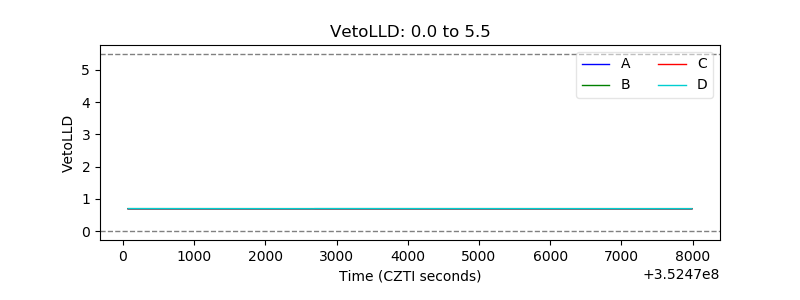 |
| Alpha Counter | 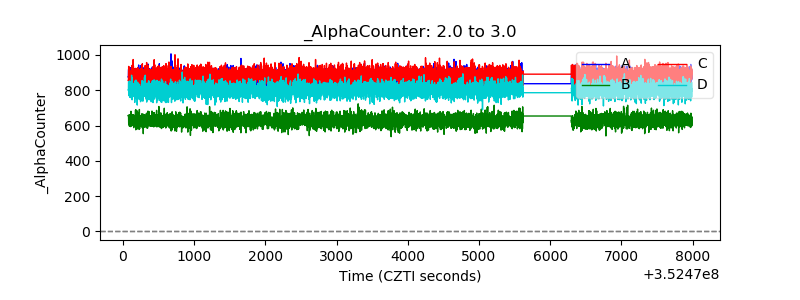 |
| _CPM_Rate | 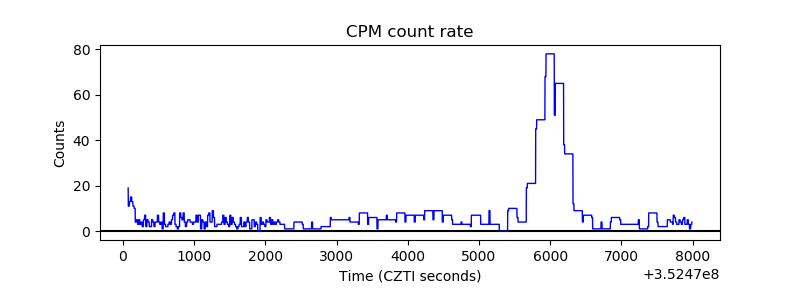 |
| CZT Counter |  |
| +2.5 Volts monitor |  |
| +5 Volts monitor |  |
| _ROLL_ROT | 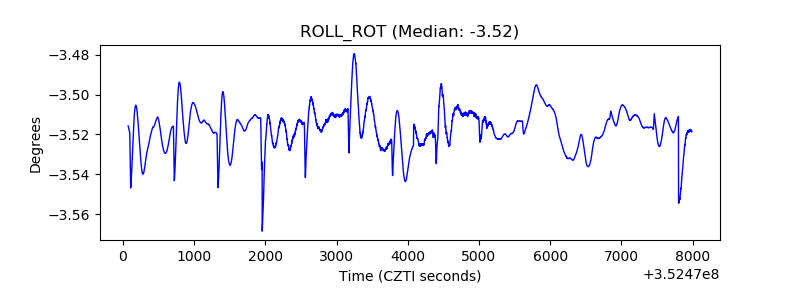 |
| _Roll_DEC | 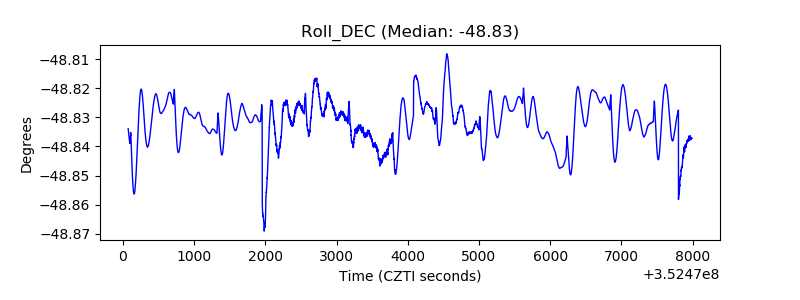 |
| _Roll_RA | 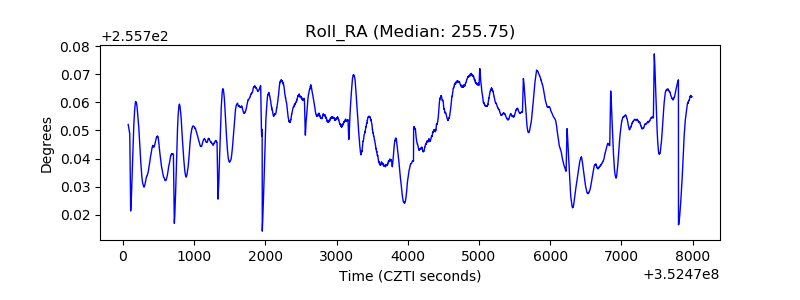 |
| Veto Counter | 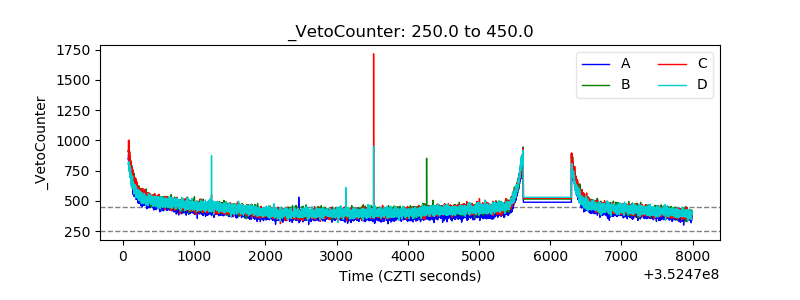 |