| Param | Original file | Final file |
|---|---|---|
| Filename | modeM0/AS1T03_279T01_9000004218_29359cztM0_level2.evt | modeM0/AS1T03_279T01_9000004218_29359cztM0_level2_quad_clean.evt |
| Size (bytes) | 907,796,160 | 74,485,440 |
| Size | 865.7 MB | 71.0 MB |
| Events in quadrant A | 3,540,240 | 493,979 |
| Events in quadrant B | 3,799,437 | 491,947 |
| Events in quadrant C | 4,889,166 | 470,746 |
| Events in quadrant D | 14,775,598 | 294,636 |
| Mode SS | |||
|---|---|---|---|
| Quadrant | BADHDUFLAG | Total packets | Discarded packets |
| A | 0 | 146 | 0 |
| B | 0 | 146 | 0 |
| C | 0 | 146 | 0 |
| D | 0 | 146 | 0 |
| Mode M9 | |||
|---|---|---|---|
| Quadrant | BADHDUFLAG | Total packets | Discarded packets |
| A | 0 | 3 | 0 |
| B | 0 | 3 | 0 |
| C | 0 | 3 | 0 |
| D | 0 | 3 | 0 |
| Mode M0 | |||
|---|---|---|---|
| Quadrant | BADHDUFLAG | Total packets | Discarded packets |
| A | 0 | 15105 | 1 |
| B | 0 | 15712 | 1 |
| C | 0 | 19125 | 1 |
| D | 0 | 48783 | 1 |
| Quadrant | Total seconds | Saturated seconds | Saturation percentage |
|---|---|---|---|
| A | 7222 | 163 | 2.256993% |
| B | 7223 | 189 | 2.616641% |
| C | 7223 | 433 | 5.994739% |
| D | 7223 | 5091 | 70.483179% |
Noise dominated data is calculated using 1-second bins in cleaned event files. If a bin has >2000 counts, and if more than 50% of those come from <1% of pixels, then it is considered to be noise-dominated and hence unusable.
| Quadrant | # 1 sec bins | Bins with >0 counts | Bins with >2000 counts | High rate bins dominated by noise | Noise dominated (total time) | Noise dominated (detector-on time) | Marked lightcurve |
|---|---|---|---|---|---|---|---|
| A | 7537 | 7224 | 9 | 9 | 0.12% | 0.12% | 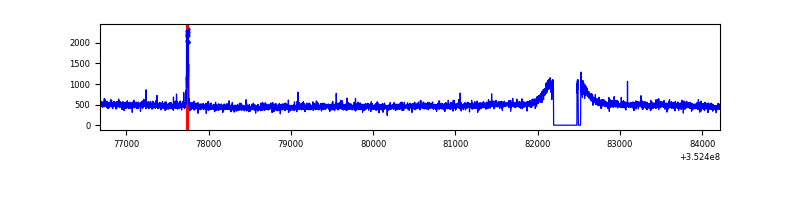 |
| B | 7538 | 7225 | 11 | 11 | 0.15% | 0.15% | 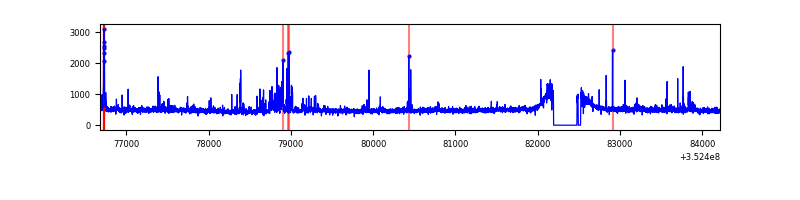 |
| C | 7538 | 7225 | 96 | 96 | 1.27% | 1.33% | 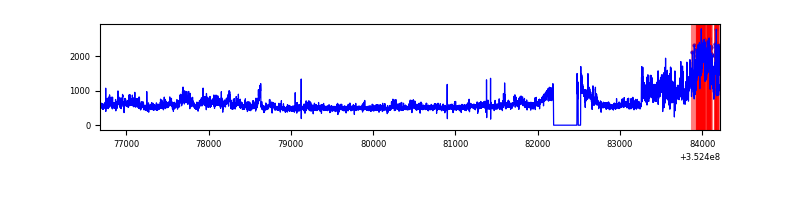 |
| D | 7538 | 7225 | 4617 | 4617 | 61.25% | 63.90% | 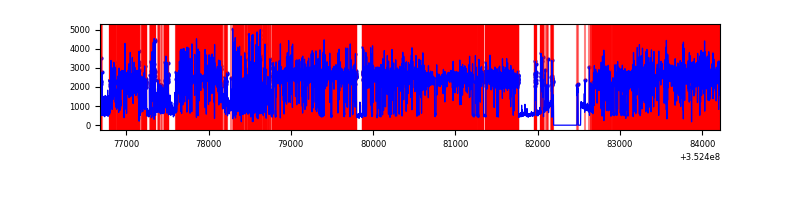 |
Top three noisy pixels from each quadrant. If the there are fewer than three noisy pixels in the level2.evt file, extra rows are filled as -1
| Pixel properties | Quadrant properties | ||||||
|---|---|---|---|---|---|---|---|
| Quadrant | DetID | PixID | Counts | Sigma | Mean | Median | Sigma |
| A | 0 | 13 | 42107 | 225.57 | 904 | 884 | 182.8 |
| A | 13 | 254 | 14486 | 74.43 | 904 | 884 | 182.8 |
| A | 3 | 137 | 8532 | 41.85 | 904 | 884 | 182.8 |
| B | 5 | 255 | 118614 | 698.25 | 890 | 868 | 168.6 |
| B | 10 | 245 | 58065 | 339.19 | 890 | 868 | 168.6 |
| B | 0 | 244 | 24908 | 142.56 | 890 | 868 | 168.6 |
| C | 3 | 233 | 1335851 | 6691.39 | 854 | 859 | 199.5 |
| C | 14 | 238 | 161327 | 804.31 | 854 | 859 | 199.5 |
| C | 14 | 254 | 40055 | 196.46 | 854 | 859 | 199.5 |
| D | 1 | 52 | 9980572 | 69092.21 | 601 | 584 | 144.4 |
| D | 12 | 233 | 1761132 | 12188.41 | 601 | 584 | 144.4 |
| D | 13 | 153 | 222573 | 1536.85 | 601 | 584 | 144.4 |
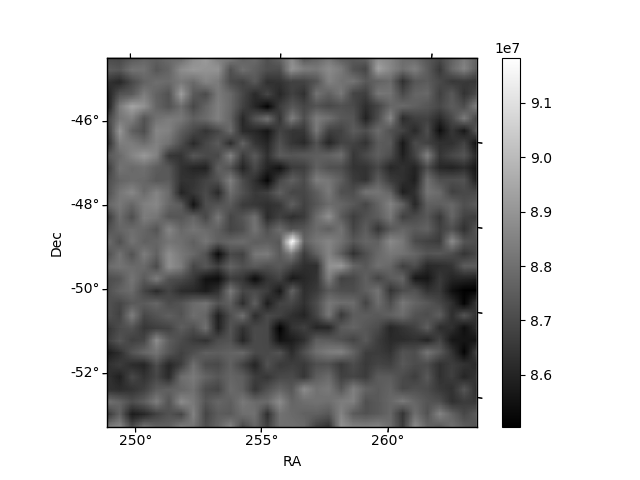
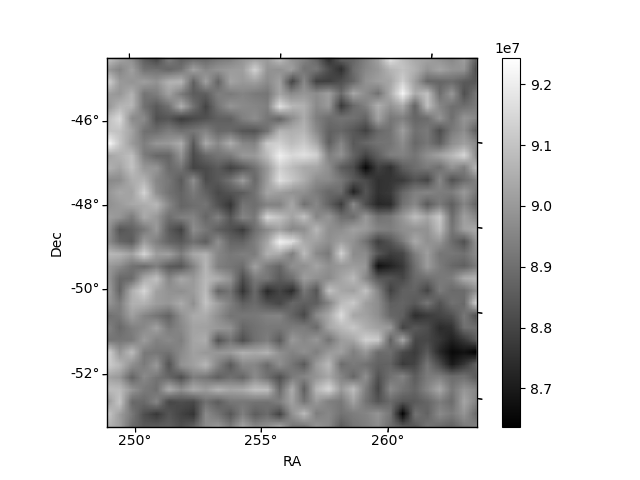
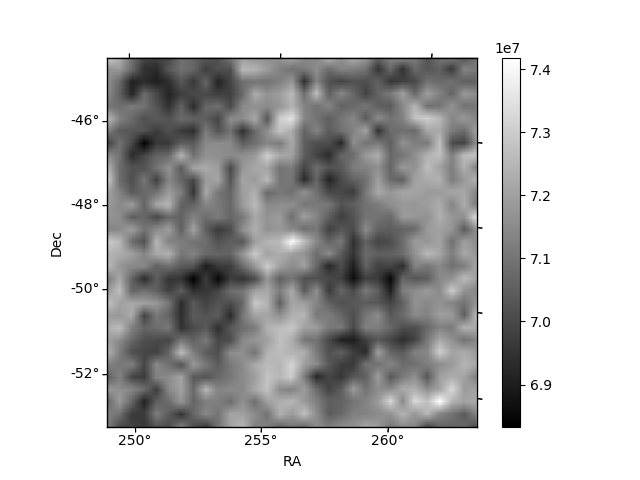
Histogram calculated using DETX and DETY for each event in the final _common_clean file
| Quadrant A | 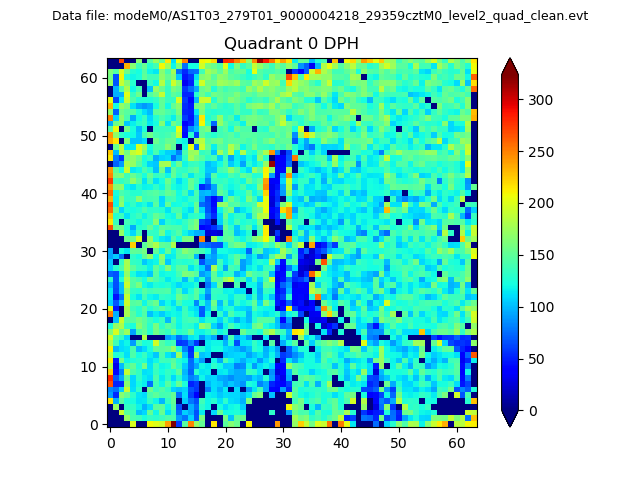 |
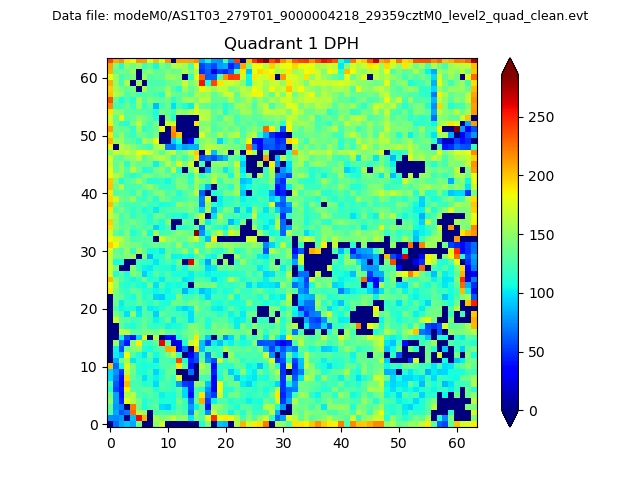 |
Quadrant B |
|---|---|---|---|
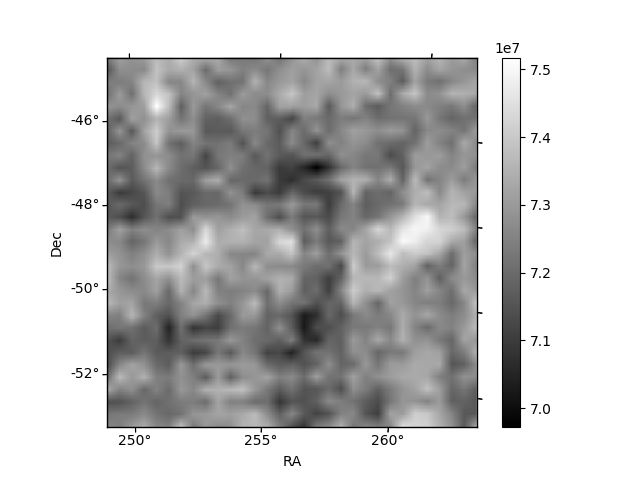
| Quadrant D |  |
 |
Quadrant C |
| Plot type | Count rate plots | Images |
|---|---|---|
| Comparison with Poisson distribution Blue bars denote a histogram of data divided into 1 sec bins. Red curve is a Poisson curve with rate = median count rate of data. |
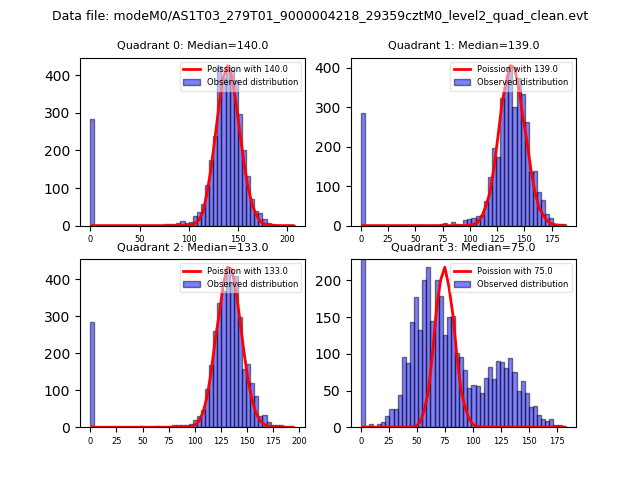 |
 |
| Quadrant-wise count rates Data is divided into 100 sec bins |
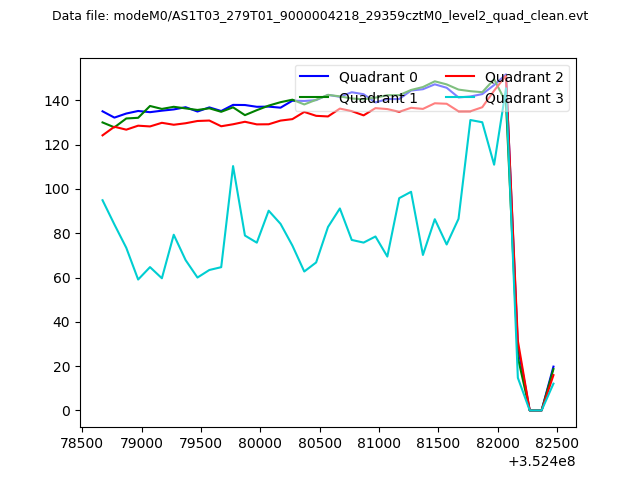 |
|
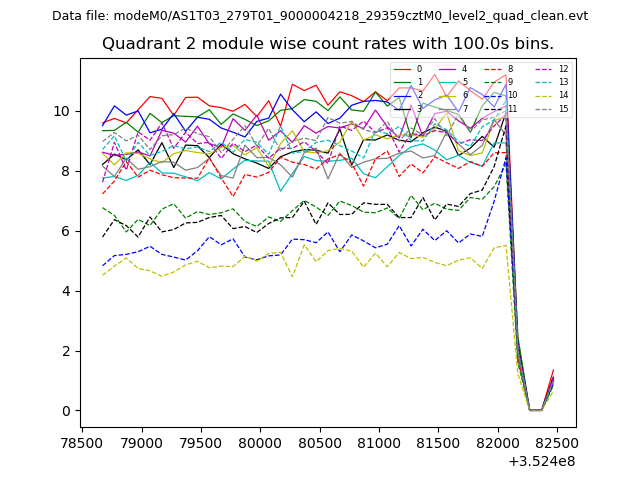
| Module-wise count rates for Quadrant A Data is divided into 100 sec bins |
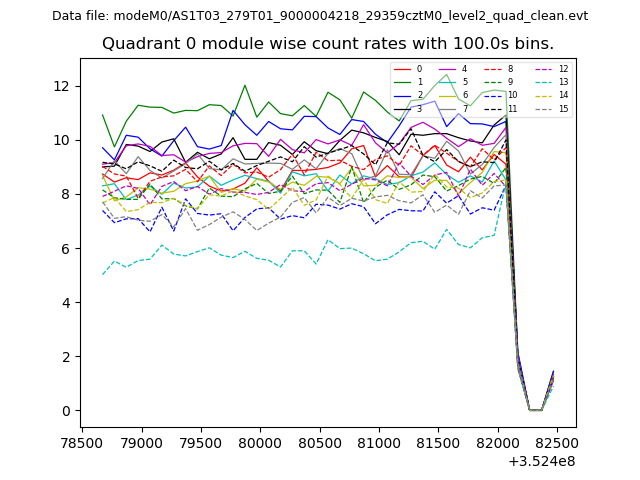 |
 |
| Module-wise count rates for Quadrant B Data is divided into 100 sec bins |
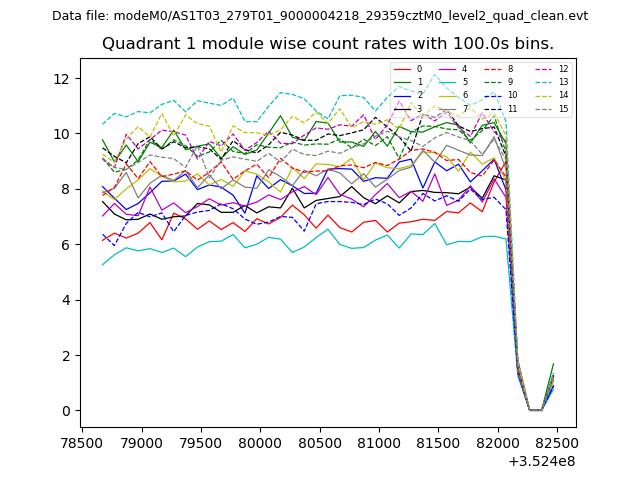 |
 |
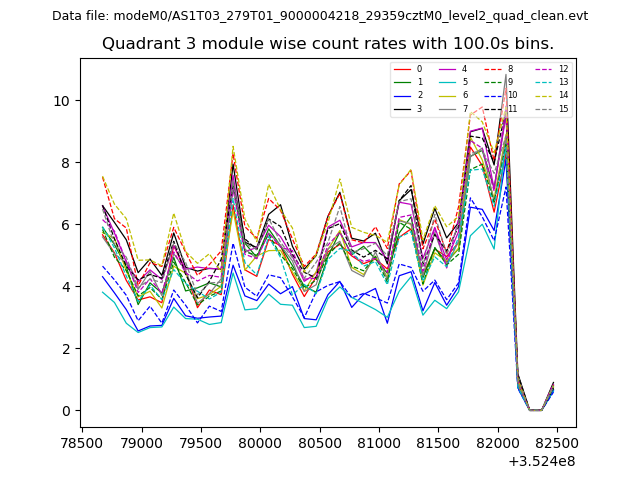
| Module-wise count rates for Quadrant C Data is divided into 100 sec bins |
 |
 |
| Module-wise count rates for Quadrant D Data is divided into 100 sec bins |
 |
 |
| Parameter | Plot |
|---|---|
| CZT HV Monitor | 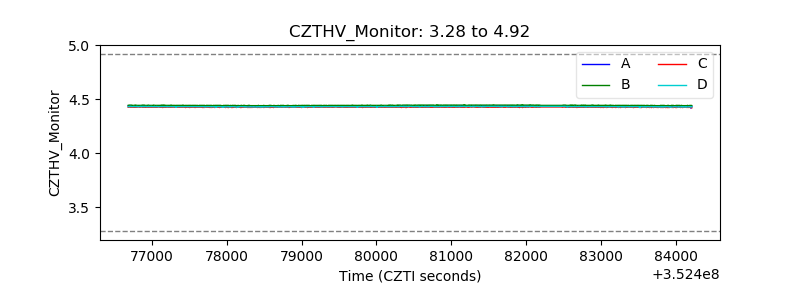 |
| D_VDD | 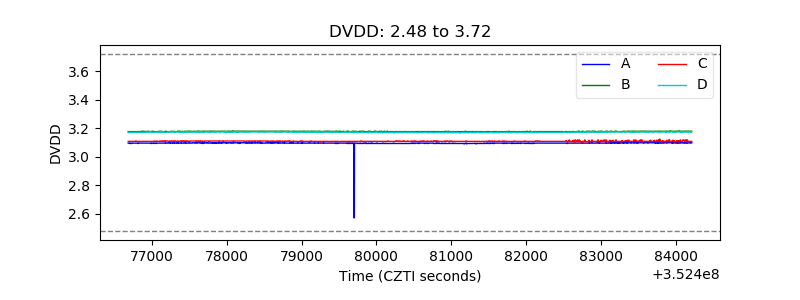 |
| Temperature 1 | 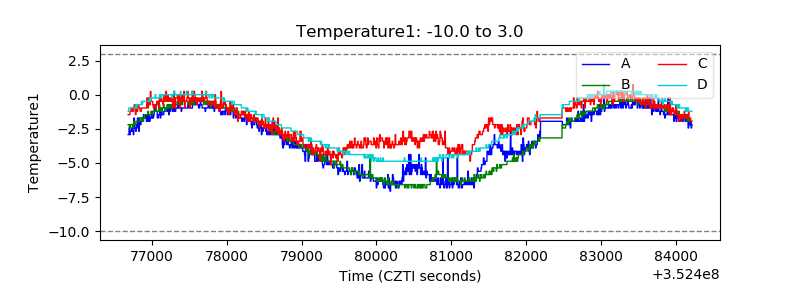 |
| Veto HV Monitor |  |
| Veto LLD | 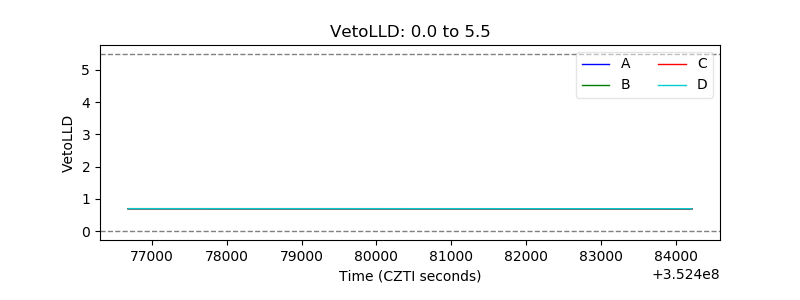 |
| Alpha Counter | 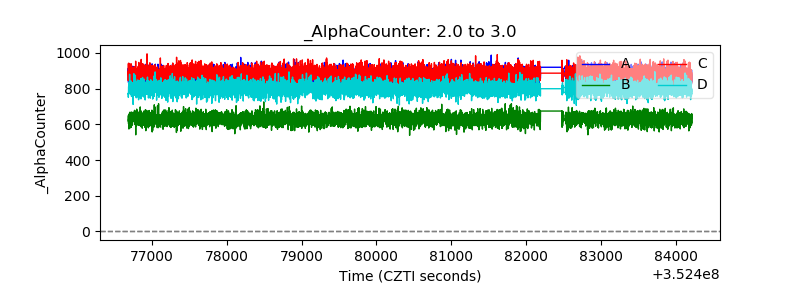 |
| _CPM_Rate | 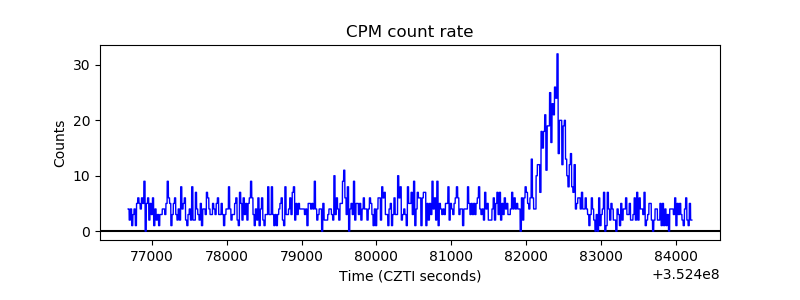 |
| CZT Counter |  |
| +2.5 Volts monitor | 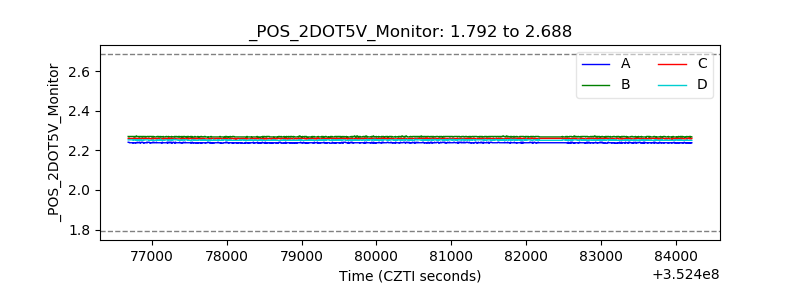 |
| +5 Volts monitor |  |
| _ROLL_ROT | 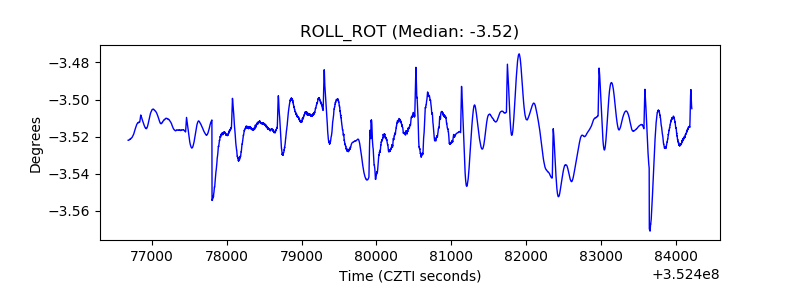 |
| _Roll_DEC | 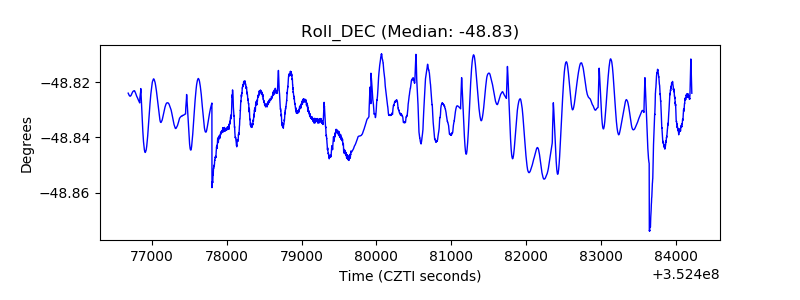 |
| _Roll_RA | 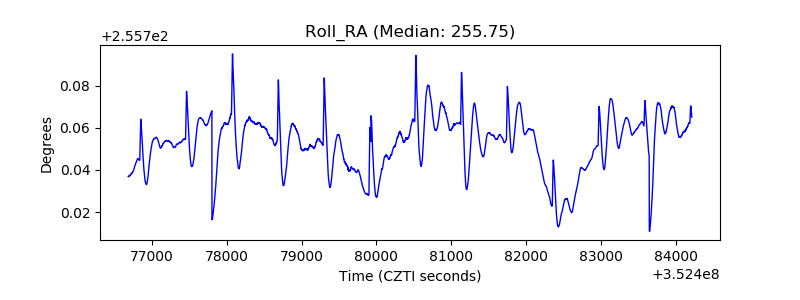 |
| Veto Counter | 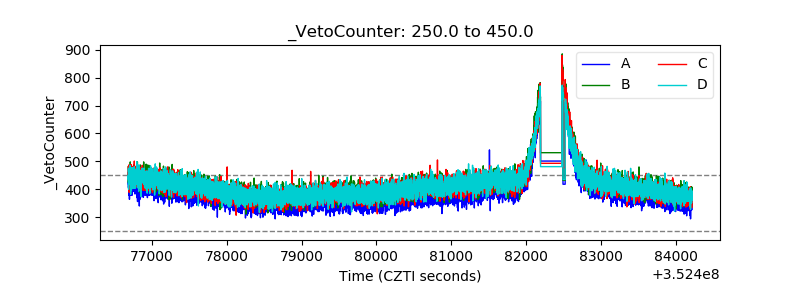 |