| Param | Original file | Final file |
|---|---|---|
| Filename | modeM0/AS1T03_279T01_9000004218_29361cztM0_level2.evt | modeM0/AS1T03_279T01_9000004218_29361cztM0_level2_quad_clean.evt |
| Size (bytes) | 719,916,480 | 91,175,040 |
| Size | 686.6 MB | 87.0 MB |
| Events in quadrant A | 3,462,319 | 592,422 |
| Events in quadrant B | 3,429,954 | 596,405 |
| Events in quadrant C | 6,663,581 | 556,656 |
| Events in quadrant D | 7,778,471 | 532,623 |
| Mode SS | |||
|---|---|---|---|
| Quadrant | BADHDUFLAG | Total packets | Discarded packets |
| A | 0 | 140 | 0 |
| B | 0 | 140 | 0 |
| C | 0 | 140 | 0 |
| D | 0 | 140 | 0 |
| Mode M9 | |||
|---|---|---|---|
| Quadrant | BADHDUFLAG | Total packets | Discarded packets |
| A | 0 | 4 | 0 |
| B | 0 | 4 | 0 |
| C | 0 | 4 | 0 |
| D | 0 | 4 | 0 |
| Mode M0 | |||
|---|---|---|---|
| Quadrant | BADHDUFLAG | Total packets | Discarded packets |
| A | 0 | 14685 | 1 |
| B | 0 | 14524 | 1 |
| C | 0 | 24601 | 1 |
| D | 0 | 27828 | 1 |
| Quadrant | Total seconds | Saturated seconds | Saturation percentage |
|---|---|---|---|
| A | 6931 | 86 | 1.240802% |
| B | 6931 | 94 | 1.356226% |
| C | 6931 | 1198 | 17.284663% |
| D | 6931 | 1249 | 18.020488% |
Noise dominated data is calculated using 1-second bins in cleaned event files. If a bin has >2000 counts, and if more than 50% of those come from <1% of pixels, then it is considered to be noise-dominated and hence unusable.
| Quadrant | # 1 sec bins | Bins with >0 counts | Bins with >2000 counts | High rate bins dominated by noise | Noise dominated (total time) | Noise dominated (detector-on time) | Marked lightcurve |
|---|---|---|---|---|---|---|---|
| A | 7326 | 6932 | 16 | 16 | 0.22% | 0.23% | 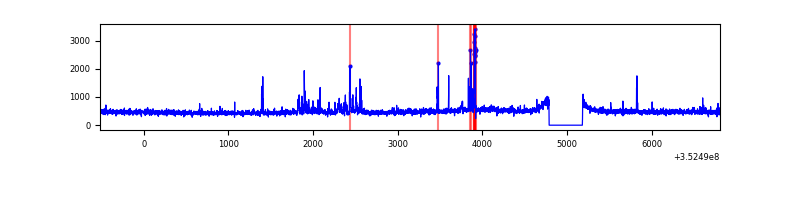 |
| B | 7326 | 6932 | 5 | 5 | 0.07% | 0.07% | 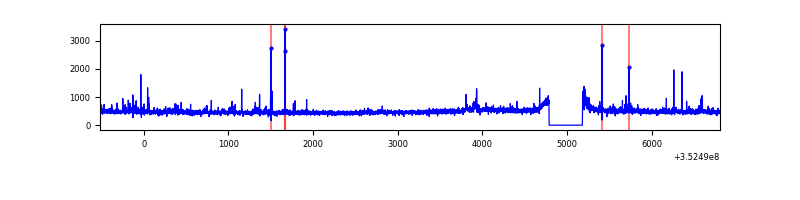 |
| C | 7326 | 6932 | 426 | 426 | 5.81% | 6.15% | 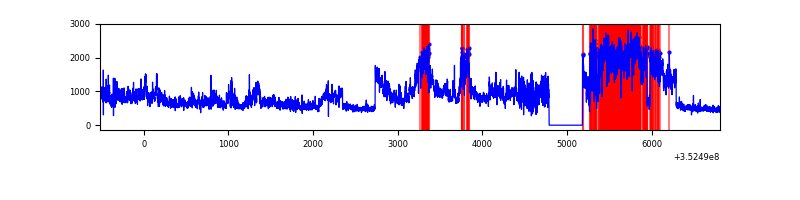 |
| D | 7326 | 6932 | 950 | 950 | 12.97% | 13.70% | 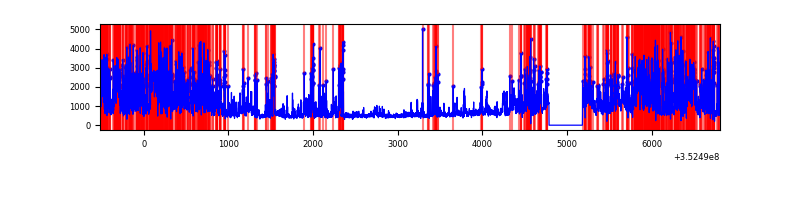 |
Top three noisy pixels from each quadrant. If the there are fewer than three noisy pixels in the level2.evt file, extra rows are filled as -1
| Pixel properties | Quadrant properties | ||||||
|---|---|---|---|---|---|---|---|
| Quadrant | DetID | PixID | Counts | Sigma | Mean | Median | Sigma |
| A | 14 | 235 | 139702 | 812.26 | 838 | 821 | 171.0 |
| A | 15 | 174 | 67539 | 390.21 | 838 | 821 | 171.0 |
| A | 13 | 254 | 13977 | 76.94 | 838 | 821 | 171.0 |
| B | 0 | 229 | 34329 | 211.78 | 832 | 811 | 158.3 |
| B | 0 | 230 | 22954 | 139.91 | 832 | 811 | 158.3 |
| B | 0 | 244 | 19733 | 119.55 | 832 | 811 | 158.3 |
| C | 3 | 233 | 3324062 | 18972.64 | 749 | 755 | 175.2 |
| C | 14 | 238 | 216384 | 1231.02 | 749 | 755 | 175.2 |
| C | 14 | 254 | 144335 | 819.69 | 749 | 755 | 175.2 |
| D | 1 | 52 | 2176997 | 11969.49 | 751 | 730 | 181.8 |
| D | 7 | 80 | 1261094 | 6932.02 | 751 | 730 | 181.8 |
| D | 13 | 153 | 555405 | 3050.72 | 751 | 730 | 181.8 |
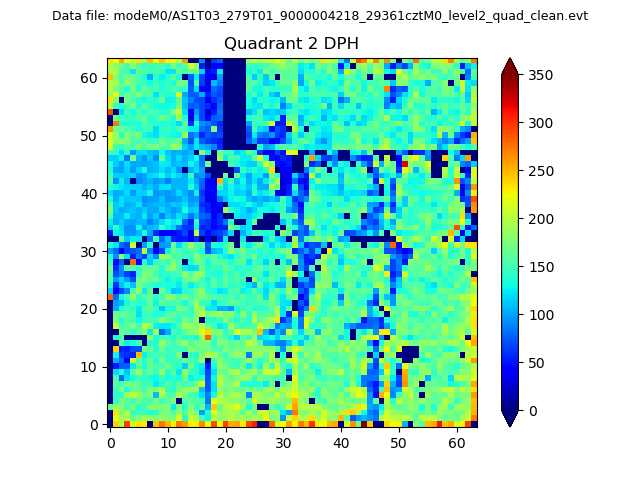
Histogram calculated using DETX and DETY for each event in the final _common_clean file
| Quadrant A | 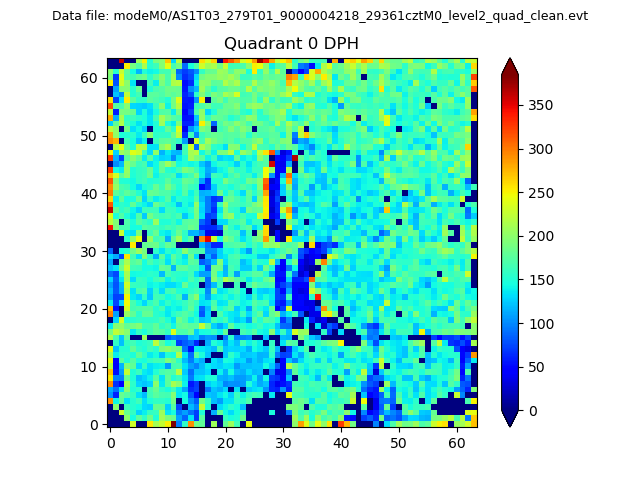 |
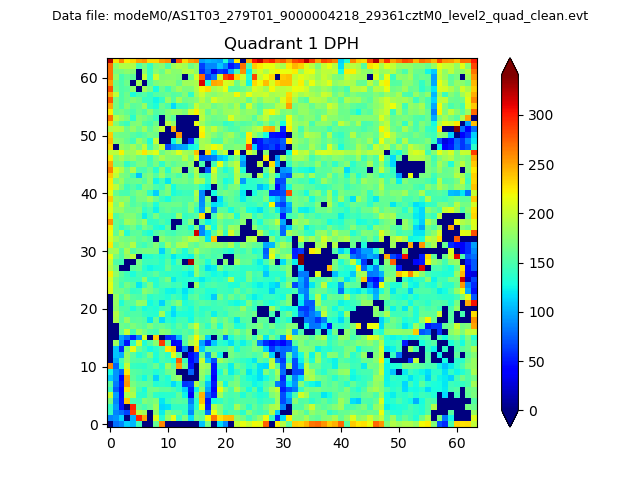 |
Quadrant B |
|---|---|---|---|
| Quadrant D | 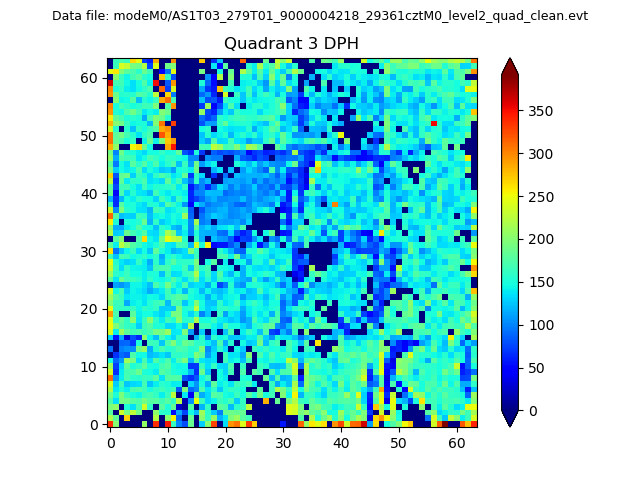 |
 |
Quadrant C |
| Plot type | Count rate plots | Images |
|---|---|---|
| Comparison with Poisson distribution Blue bars denote a histogram of data divided into 1 sec bins. Red curve is a Poisson curve with rate = median count rate of data. |
 |
 |
| Quadrant-wise count rates Data is divided into 100 sec bins |
 |
|
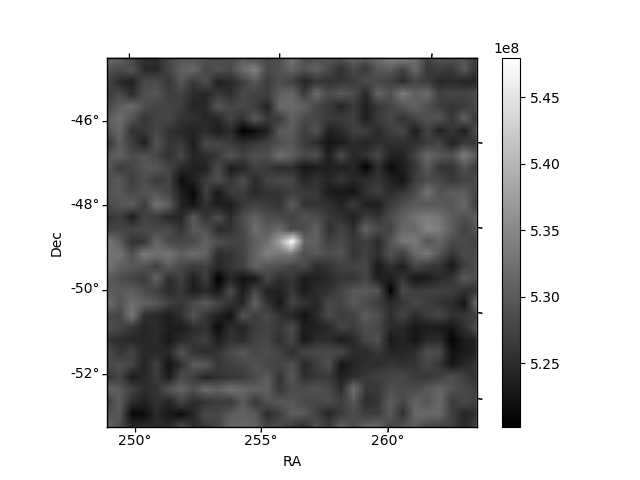
| Module-wise count rates for Quadrant A Data is divided into 100 sec bins |
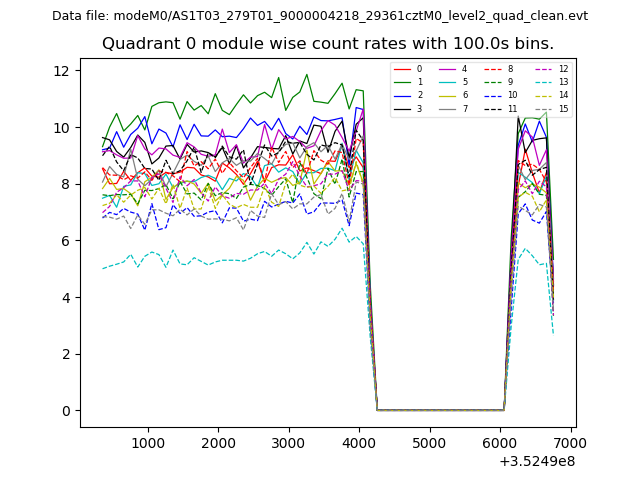 |
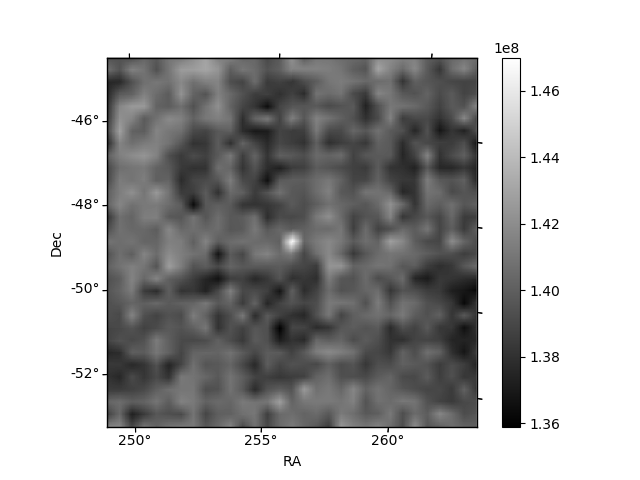 |
| Module-wise count rates for Quadrant B Data is divided into 100 sec bins |
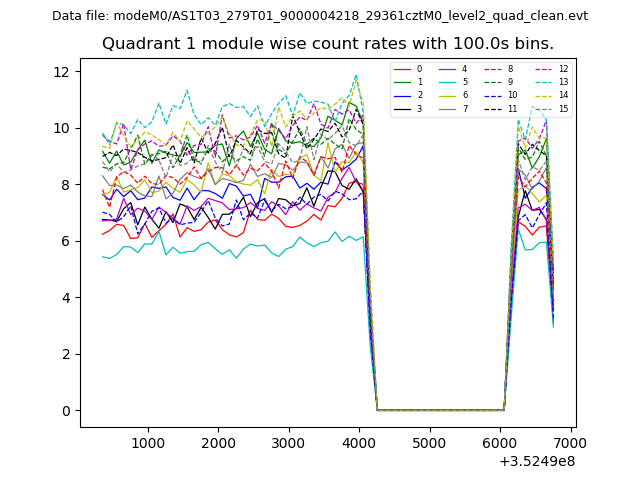 |
 |
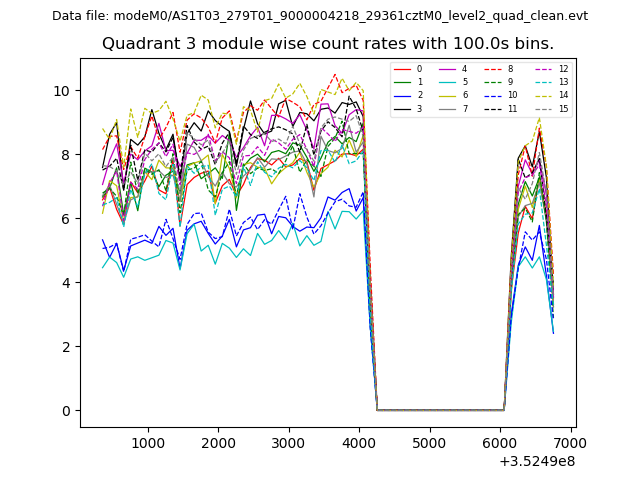
| Module-wise count rates for Quadrant C Data is divided into 100 sec bins |
 |
 |
| Module-wise count rates for Quadrant D Data is divided into 100 sec bins |
 |
 |
| Parameter | Plot |
|---|---|
| CZT HV Monitor |  |
| D_VDD | 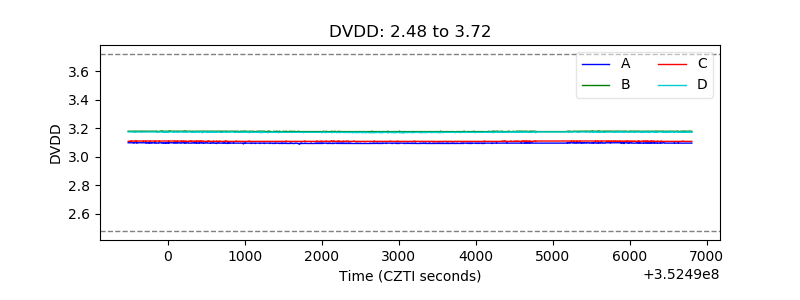 |
| Temperature 1 | 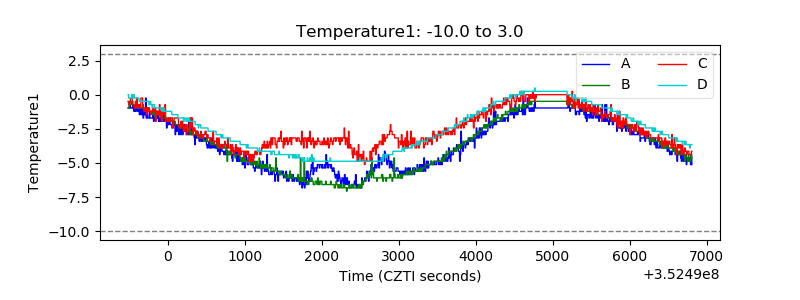 |
| Veto HV Monitor | 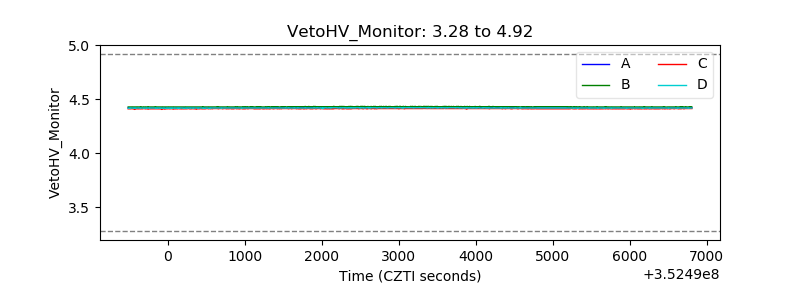 |
| Veto LLD | 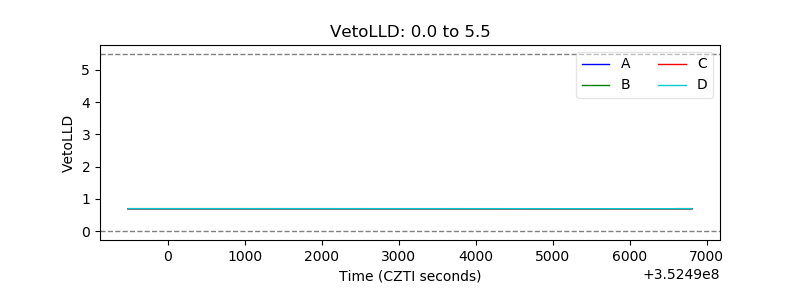 |
| Alpha Counter |  |
| _CPM_Rate | 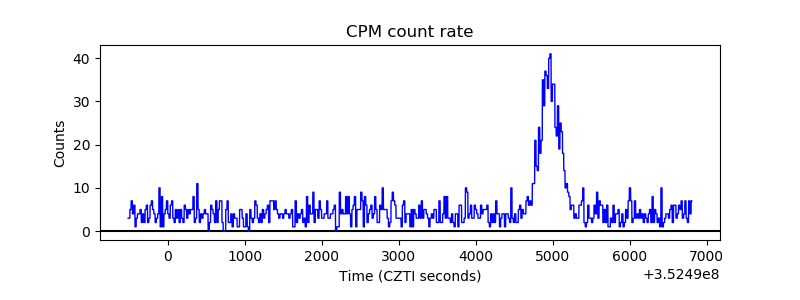 |
| CZT Counter | 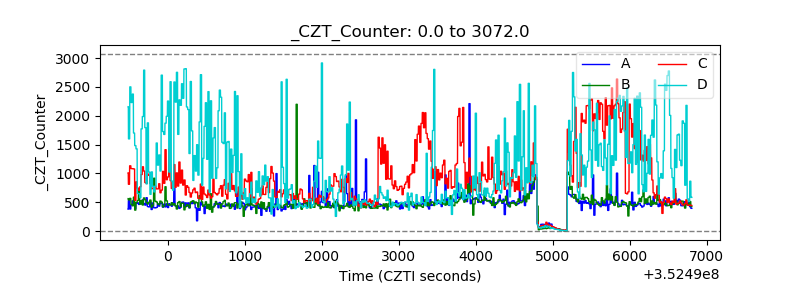 |
| +2.5 Volts monitor |  |
| +5 Volts monitor |  |
| _ROLL_ROT | 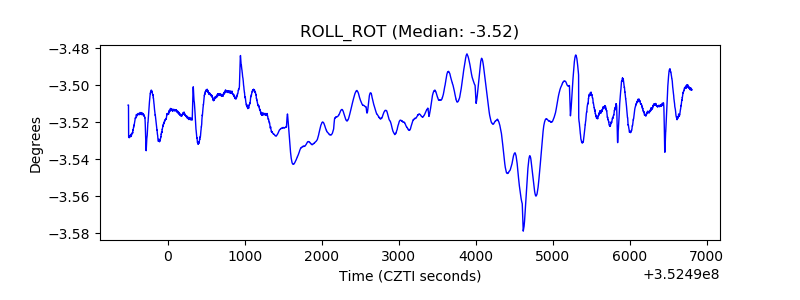 |
| _Roll_DEC | 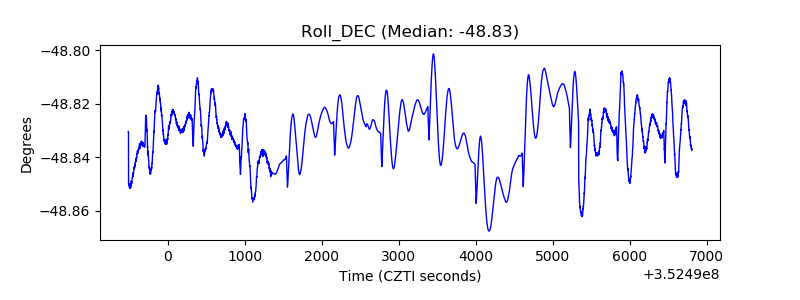 |
| _Roll_RA | 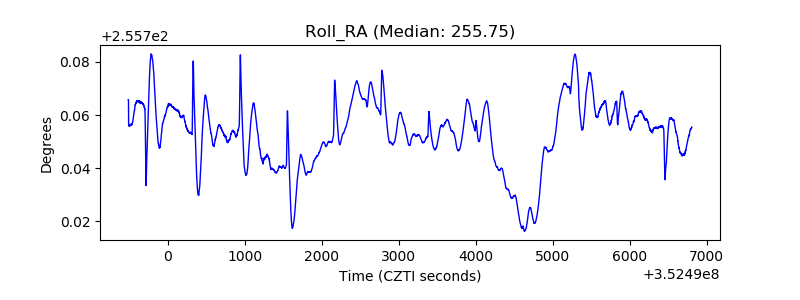 |
| Veto Counter | 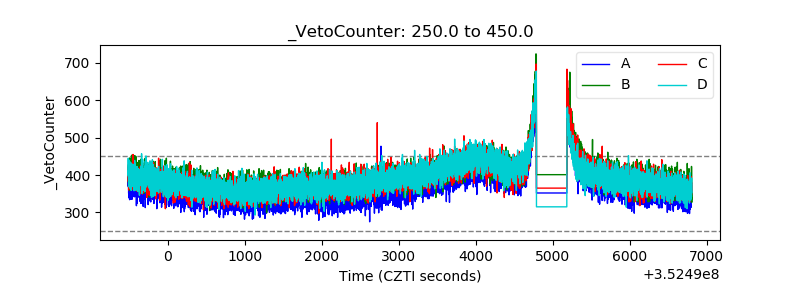 |