| Param | Original file | Final file |
|---|---|---|
| Filename | modeM0/AS1T03_279T01_9000004218_29363cztM0_level2.evt | modeM0/AS1T03_279T01_9000004218_29363cztM0_level2_quad_clean.evt |
| Size (bytes) | 1,205,038,080 | 180,959,040 |
| Size | 1.1 GB | 172.6 MB |
| Events in quadrant A | 7,295,785 | 1,185,189 |
| Events in quadrant B | 6,447,979 | 1,213,058 |
| Events in quadrant C | 10,203,769 | 1,133,069 |
| Events in quadrant D | 11,690,641 | 1,071,097 |
| Mode SS | |||
|---|---|---|---|
| Quadrant | BADHDUFLAG | Total packets | Discarded packets |
| A | 0 | 256 | 0 |
| B | 0 | 256 | 0 |
| C | 0 | 256 | 0 |
| D | 0 | 256 | 0 |
| Mode M9 | |||
|---|---|---|---|
| Quadrant | BADHDUFLAG | Total packets | Discarded packets |
| A | 0 | 14 | 0 |
| B | 0 | 14 | 0 |
| C | 0 | 14 | 0 |
| D | 0 | 14 | 0 |
| Mode M0 | |||
|---|---|---|---|
| Quadrant | BADHDUFLAG | Total packets | Discarded packets |
| A | 0 | 29788 | 3 |
| B | 0 | 27260 | 3 |
| C | 0 | 39185 | 5 |
| D | 0 | 43308 | 3 |
| Quadrant | Total seconds | Saturated seconds | Saturation percentage |
|---|---|---|---|
| A | 12710 | 296 | 2.328875% |
| B | 12711 | 102 | 0.802455% |
| C | 12710 | 1200 | 9.441385% |
| D | 12710 | 1493 | 11.746656% |
Noise dominated data is calculated using 1-second bins in cleaned event files. If a bin has >2000 counts, and if more than 50% of those come from <1% of pixels, then it is considered to be noise-dominated and hence unusable.
| Quadrant | # 1 sec bins | Bins with >0 counts | Bins with >2000 counts | High rate bins dominated by noise | Noise dominated (total time) | Noise dominated (detector-on time) | Marked lightcurve |
|---|---|---|---|---|---|---|---|
| A | 14030 | 12712 | 187 | 187 | 1.33% | 1.47% | 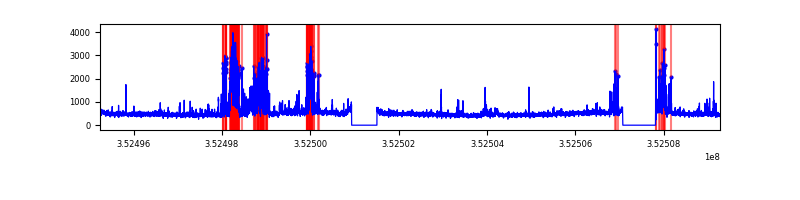 |
| B | 14031 | 12713 | 19 | 19 | 0.14% | 0.15% | 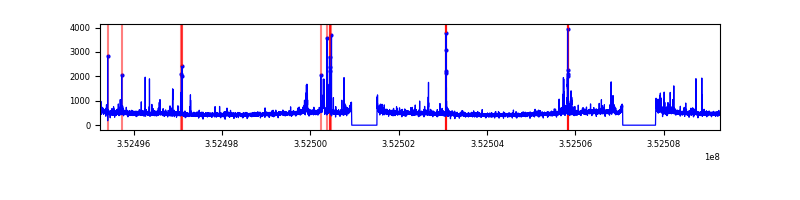 |
| C | 14030 | 12712 | 383 | 383 | 2.73% | 3.01% | 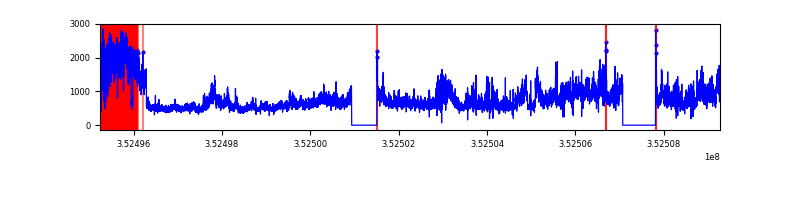 |
| D | 14030 | 12711 | 1154 | 1154 | 8.23% | 9.08% | 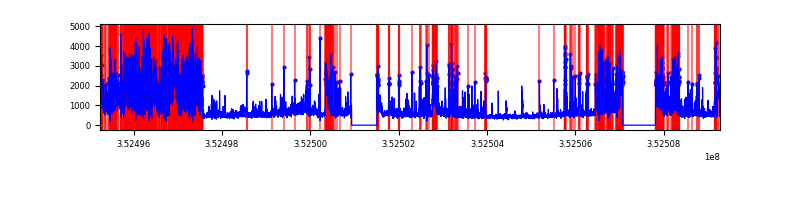 |
Top three noisy pixels from each quadrant. If the there are fewer than three noisy pixels in the level2.evt file, extra rows are filled as -1
| Pixel properties | Quadrant properties | ||||||
|---|---|---|---|---|---|---|---|
| Quadrant | DetID | PixID | Counts | Sigma | Mean | Median | Sigma |
| A | 14 | 235 | 1130706 | 3675.06 | 1532 | 1504 | 307.3 |
| A | 0 | 13 | 230429 | 745.05 | 1532 | 1504 | 307.3 |
| A | 13 | 254 | 25852 | 79.24 | 1532 | 1504 | 307.3 |
| B | 15 | 33 | 85972 | 292.65 | 1533 | 1498 | 288.7 |
| B | 5 | 255 | 73176 | 248.32 | 1533 | 1498 | 288.7 |
| B | 0 | 229 | 62047 | 209.76 | 1533 | 1498 | 288.7 |
| C | 3 | 233 | 4047460 | 12028.61 | 1435 | 1447 | 336.4 |
| C | 14 | 238 | 331372 | 980.85 | 1435 | 1447 | 336.4 |
| C | 14 | 254 | 151073 | 444.83 | 1435 | 1447 | 336.4 |
| D | 7 | 80 | 2742983 | 8050.82 | 1422 | 1383 | 340.5 |
| D | 1 | 52 | 1462227 | 4289.83 | 1422 | 1383 | 340.5 |
| D | 8 | 195 | 390092 | 1141.46 | 1422 | 1383 | 340.5 |
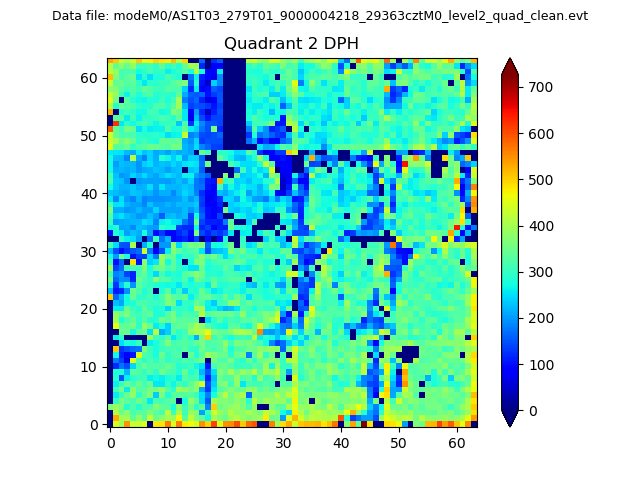
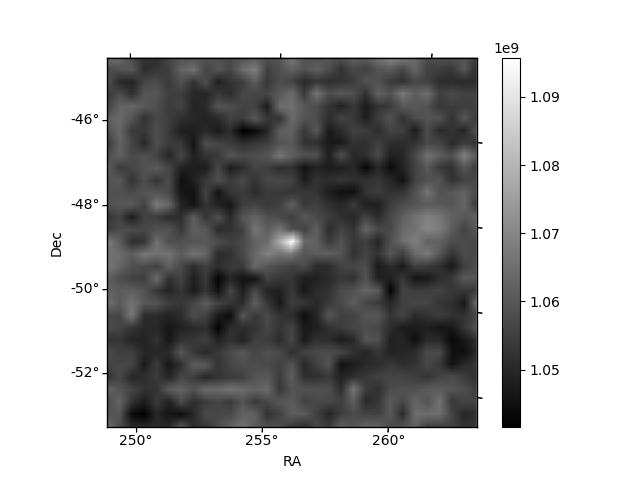
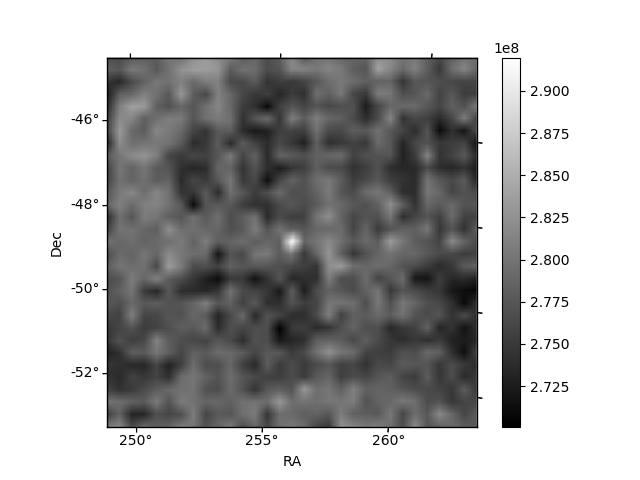
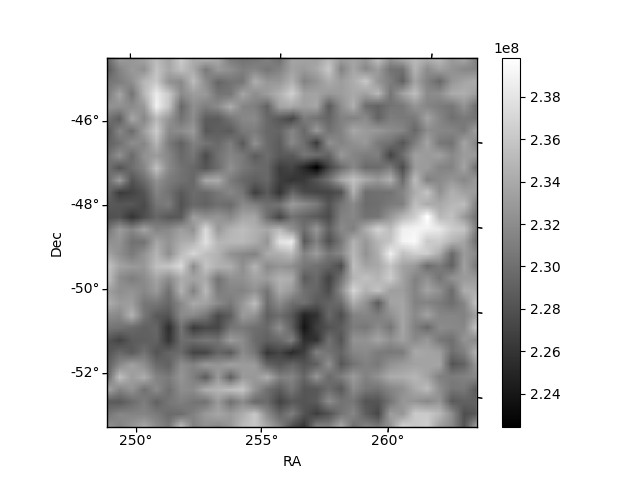
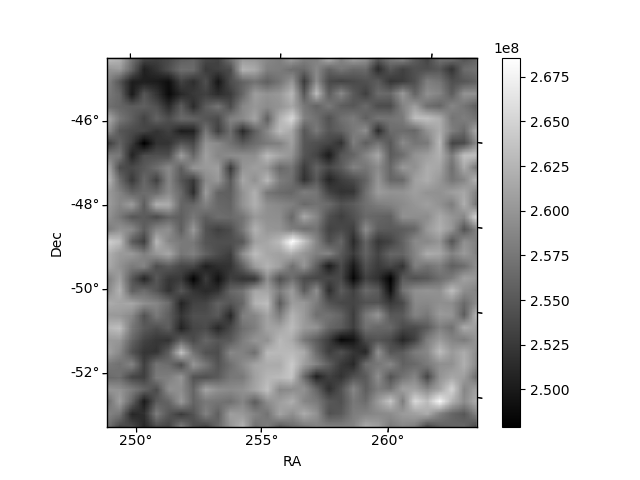
Histogram calculated using DETX and DETY for each event in the final _common_clean file
| Quadrant A | 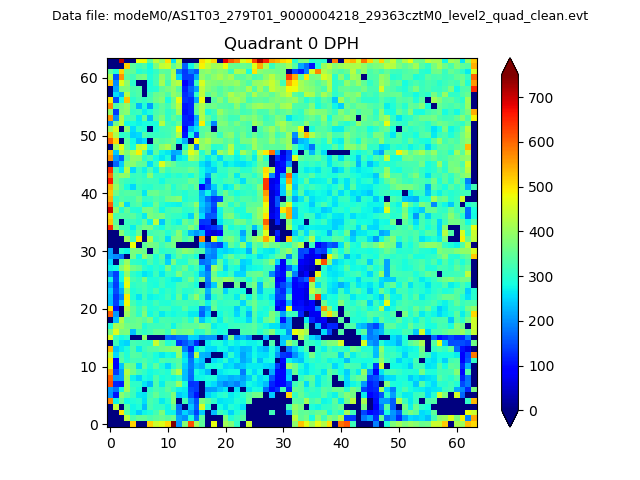 |
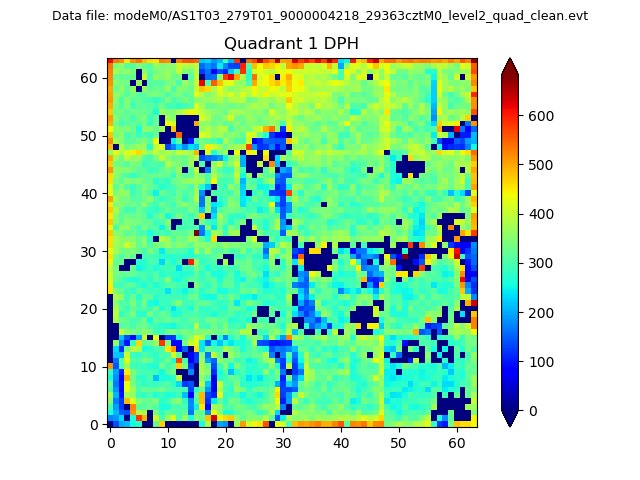 |
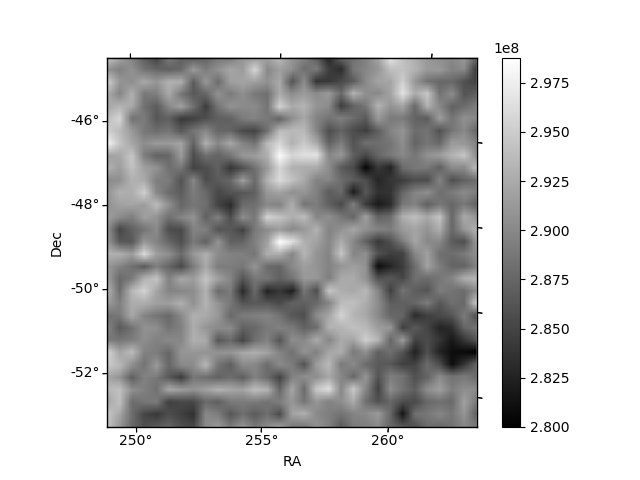
Quadrant B |
|---|---|---|---|
| Quadrant D | 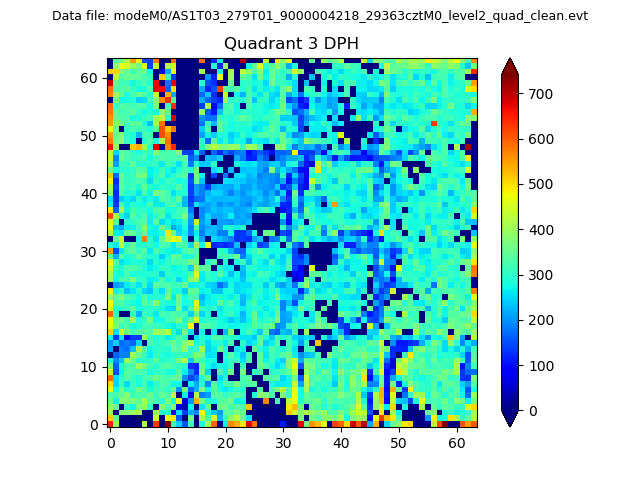 |
 |
Quadrant C |
| Plot type | Count rate plots | Images |
|---|---|---|
| Comparison with Poisson distribution Blue bars denote a histogram of data divided into 1 sec bins. Red curve is a Poisson curve with rate = median count rate of data. |
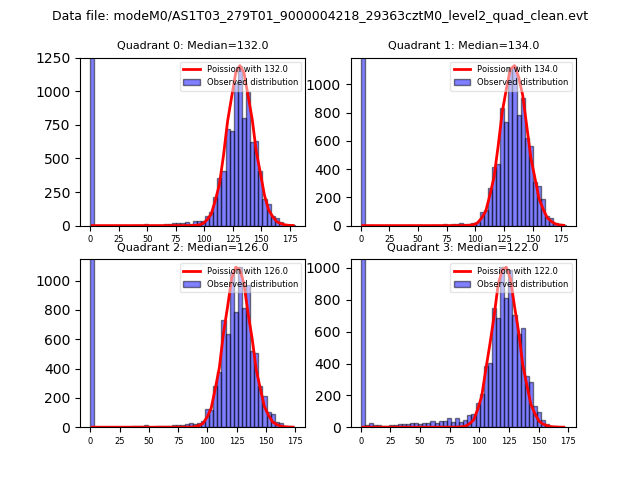 |
 |
| Quadrant-wise count rates Data is divided into 100 sec bins |
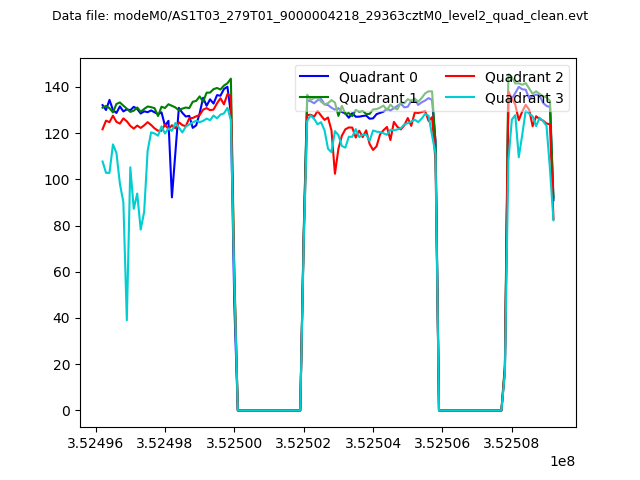 |
|
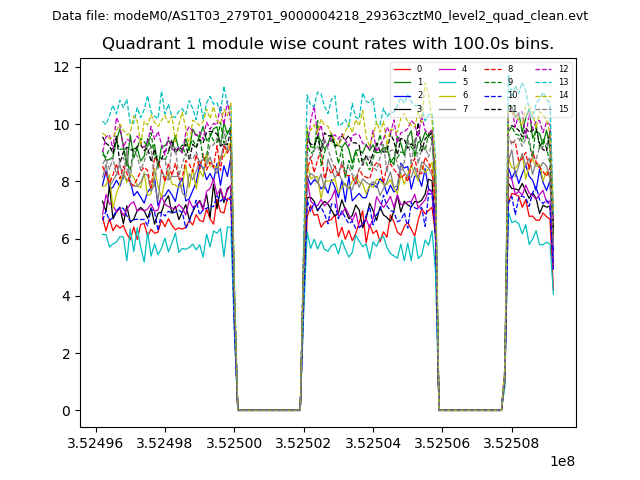
| Module-wise count rates for Quadrant A Data is divided into 100 sec bins |
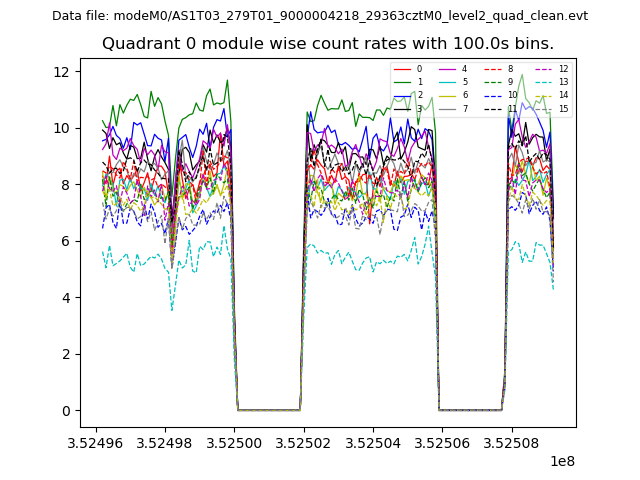 |
 |
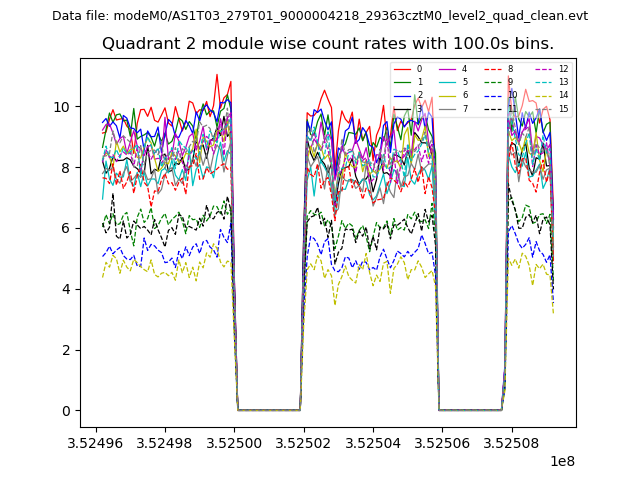
| Module-wise count rates for Quadrant B Data is divided into 100 sec bins |
 |
 |
| Module-wise count rates for Quadrant C Data is divided into 100 sec bins |
 |
 |
| Module-wise count rates for Quadrant D Data is divided into 100 sec bins |
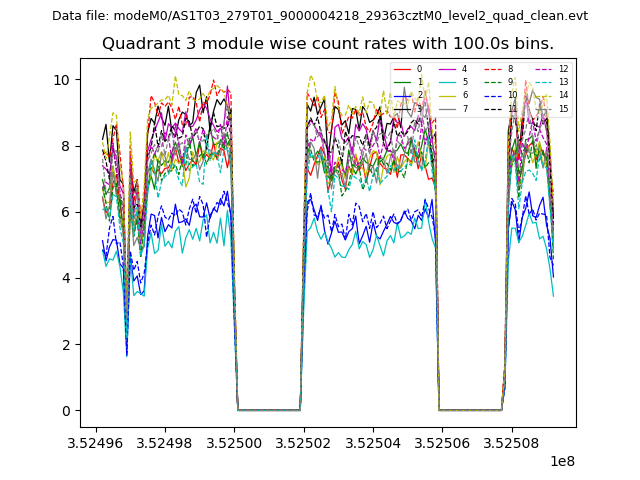 |
 |
| Parameter | Plot |
|---|---|
| CZT HV Monitor | 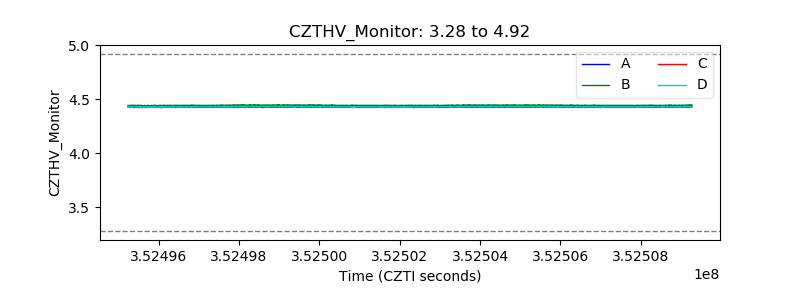 |
| D_VDD |  |
| Temperature 1 | 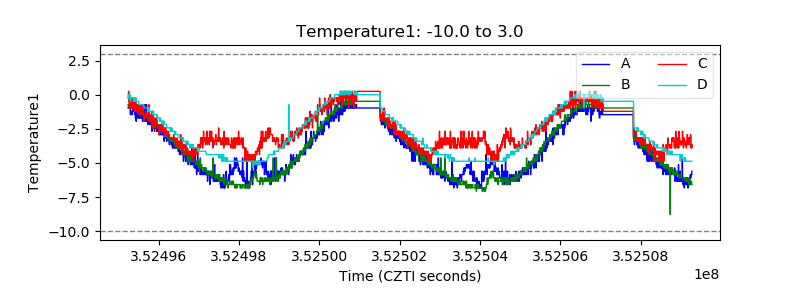 |
| Veto HV Monitor | 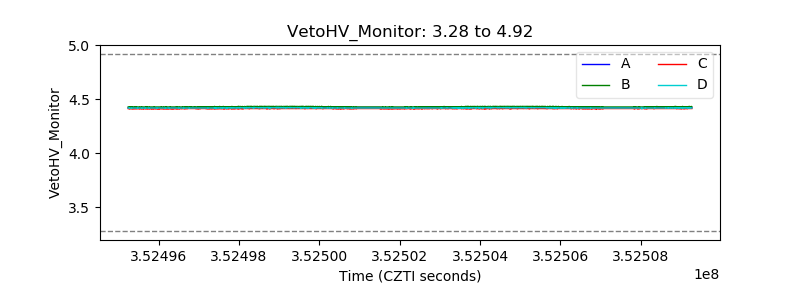 |
| Veto LLD | 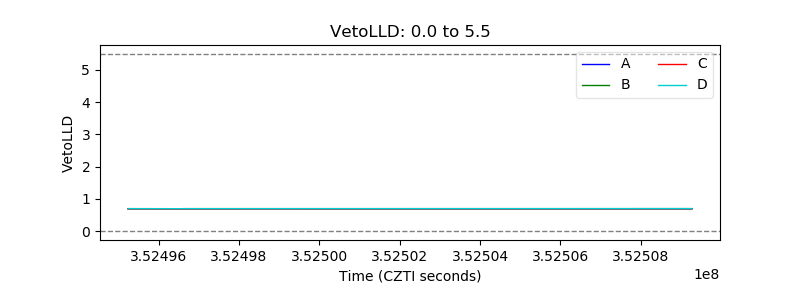 |
| Alpha Counter | 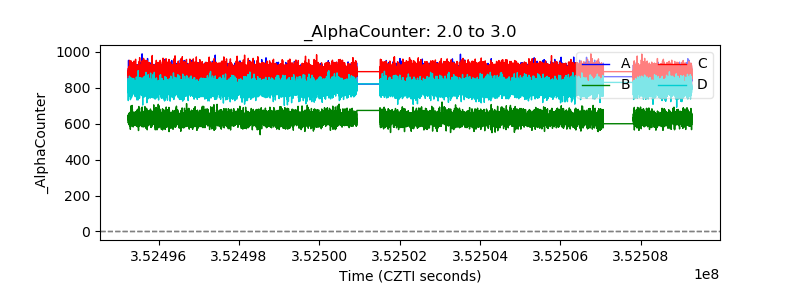 |
| _CPM_Rate | 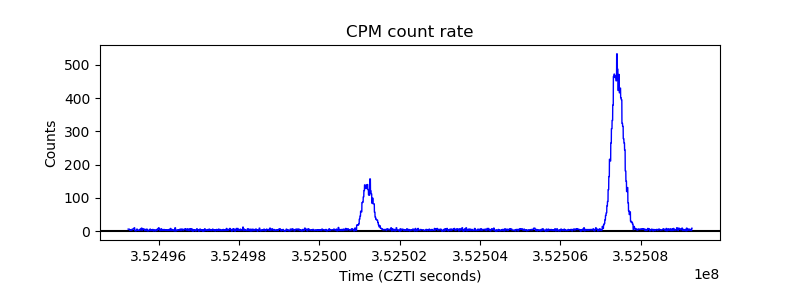 |
| CZT Counter | 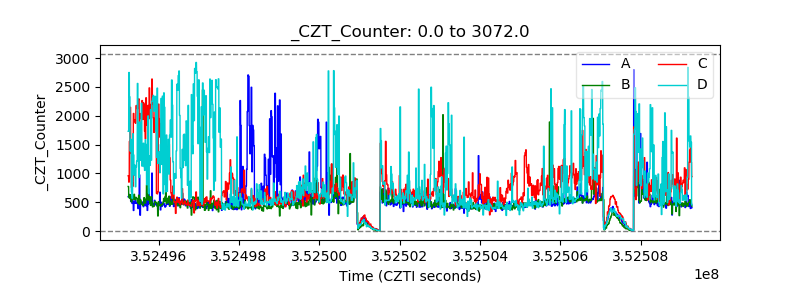 |
| +2.5 Volts monitor |  |
| +5 Volts monitor |  |
| _ROLL_ROT | 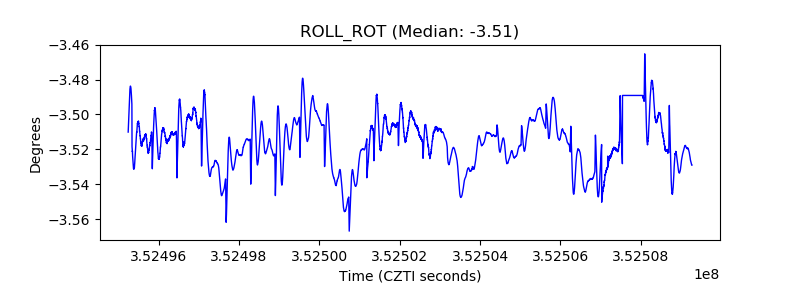 |
| _Roll_DEC | 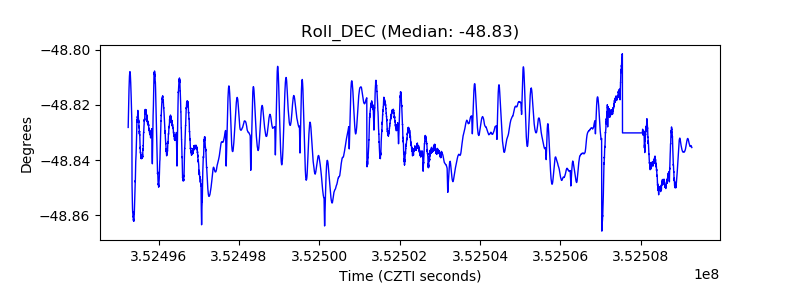 |
| _Roll_RA | 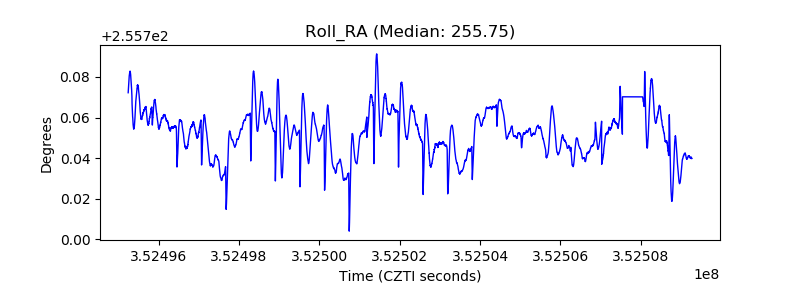 |
| Veto Counter | 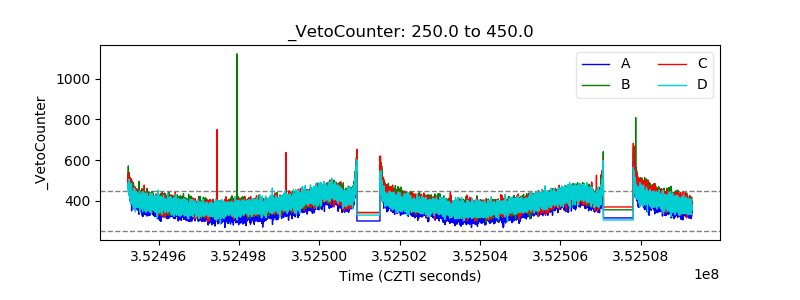 |