| Param | Original file | Final file |
|---|---|---|
| Filename | modeM0/AS1T03_279T01_9000004218_29364cztM0_level2.evt | modeM0/AS1T03_279T01_9000004218_29364cztM0_level2_quad_clean.evt |
| Size (bytes) | 662,947,200 | 105,364,800 |
| Size | 632.2 MB | 100.5 MB |
| Events in quadrant A | 3,513,838 | 707,004 |
| Events in quadrant B | 3,469,968 | 721,397 |
| Events in quadrant C | 7,106,118 | 638,326 |
| Events in quadrant D | 5,529,802 | 652,126 |
| Mode SS | |||
|---|---|---|---|
| Quadrant | BADHDUFLAG | Total packets | Discarded packets |
| A | 0 | 138 | 0 |
| B | 0 | 138 | 0 |
| C | 0 | 138 | 0 |
| D | 0 | 138 | 0 |
| Mode M9 | |||
|---|---|---|---|
| Quadrant | BADHDUFLAG | Total packets | Discarded packets |
| A | 0 | 9 | 0 |
| B | 0 | 9 | 0 |
| C | 0 | 9 | 0 |
| D | 0 | 9 | 0 |
| Mode M0 | |||
|---|---|---|---|
| Quadrant | BADHDUFLAG | Total packets | Discarded packets |
| A | 0 | 14702 | 2 |
| B | 0 | 14554 | 2 |
| C | 0 | 26004 | 2 |
| D | 0 | 20993 | 2 |
| Quadrant | Total seconds | Saturated seconds | Saturation percentage |
|---|---|---|---|
| A | 6766 | 52 | 0.768549% |
| B | 6767 | 58 | 0.857101% |
| C | 6767 | 1149 | 16.979459% |
| D | 6767 | 381 | 5.630265% |
Noise dominated data is calculated using 1-second bins in cleaned event files. If a bin has >2000 counts, and if more than 50% of those come from <1% of pixels, then it is considered to be noise-dominated and hence unusable.
| Quadrant | # 1 sec bins | Bins with >0 counts | Bins with >2000 counts | High rate bins dominated by noise | Noise dominated (total time) | Noise dominated (detector-on time) | Marked lightcurve |
|---|---|---|---|---|---|---|---|
| A | 7681 | 6767 | 11 | 11 | 0.14% | 0.16% | 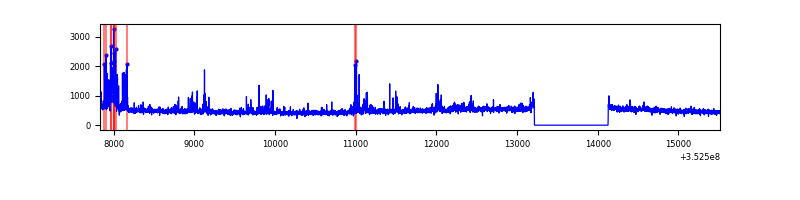 |
| B | 7682 | 6768 | 12 | 12 | 0.16% | 0.18% | 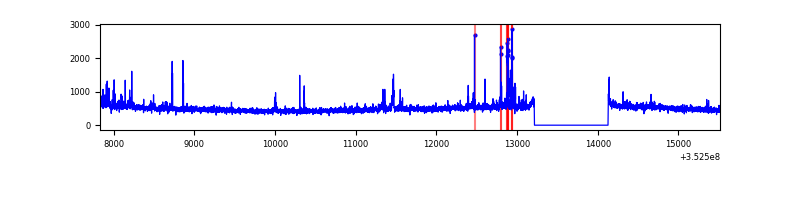 |
| C | 7682 | 6768 | 243 | 243 | 3.16% | 3.59% | 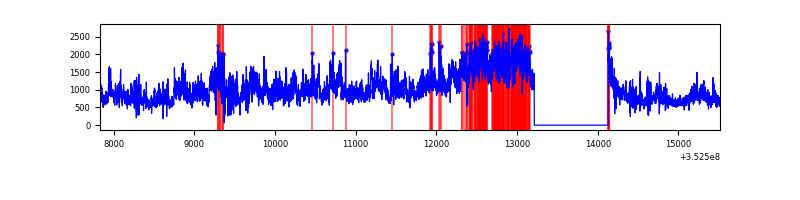 |
| D | 7682 | 6768 | 271 | 271 | 3.53% | 4.00% | 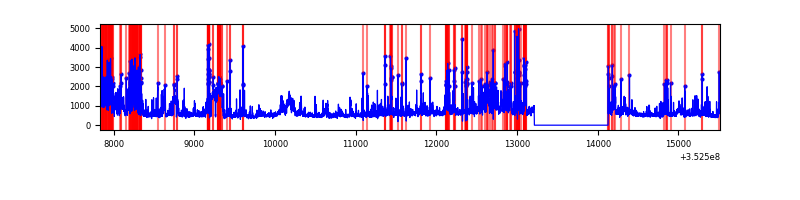 |
Top three noisy pixels from each quadrant. If the there are fewer than three noisy pixels in the level2.evt file, extra rows are filled as -1
| Pixel properties | Quadrant properties | ||||||
|---|---|---|---|---|---|---|---|
| Quadrant | DetID | PixID | Counts | Sigma | Mean | Median | Sigma |
| A | 0 | 13 | 217846 | 1292.08 | 828 | 810 | 168.0 |
| A | 14 | 235 | 97316 | 574.53 | 828 | 810 | 168.0 |
| A | 13 | 254 | 13506 | 75.58 | 828 | 810 | 168.0 |
| B | 5 | 172 | 71327 | 447.51 | 829 | 809 | 157.6 |
| B | 5 | 255 | 51244 | 320.06 | 829 | 809 | 157.6 |
| B | 0 | 190 | 24953 | 153.22 | 829 | 809 | 157.6 |
| C | 3 | 233 | 3783578 | 21310.73 | 755 | 762 | 177.5 |
| C | 14 | 238 | 219671 | 1233.24 | 755 | 762 | 177.5 |
| C | 14 | 254 | 143340 | 803.22 | 755 | 762 | 177.5 |
| D | 1 | 52 | 1036424 | 5458.58 | 786 | 766 | 189.7 |
| D | 7 | 80 | 388885 | 2045.64 | 786 | 766 | 189.7 |
| D | 12 | 227 | 305425 | 1605.75 | 786 | 766 | 189.7 |
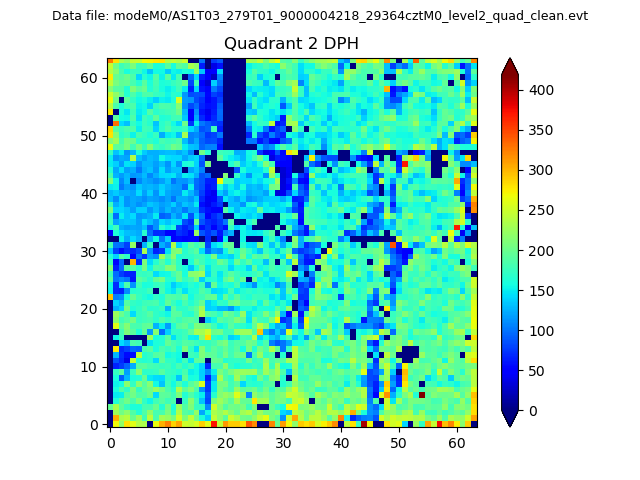
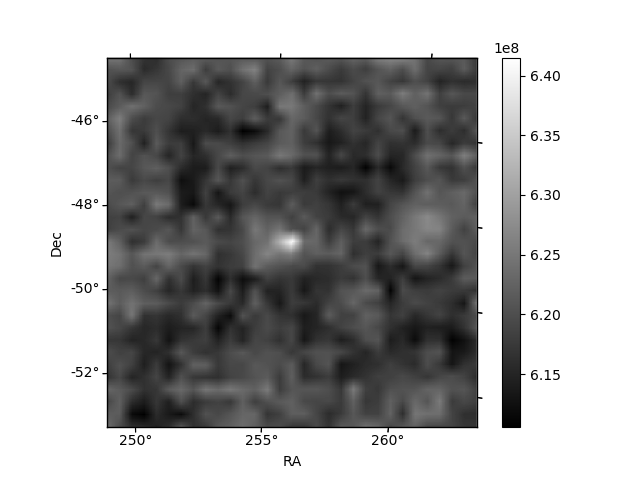
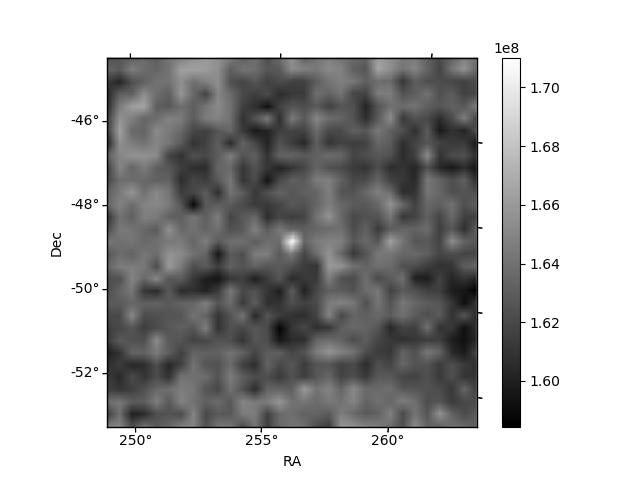
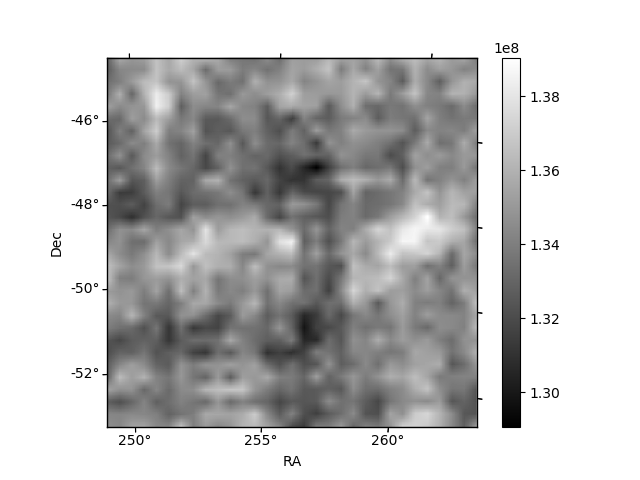
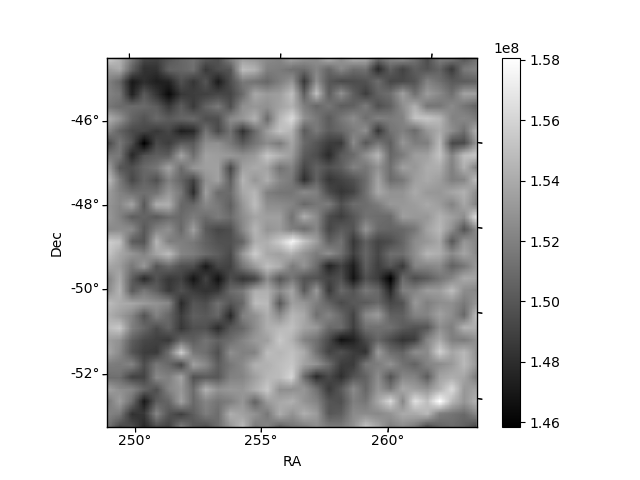
Histogram calculated using DETX and DETY for each event in the final _common_clean file
| Quadrant A | 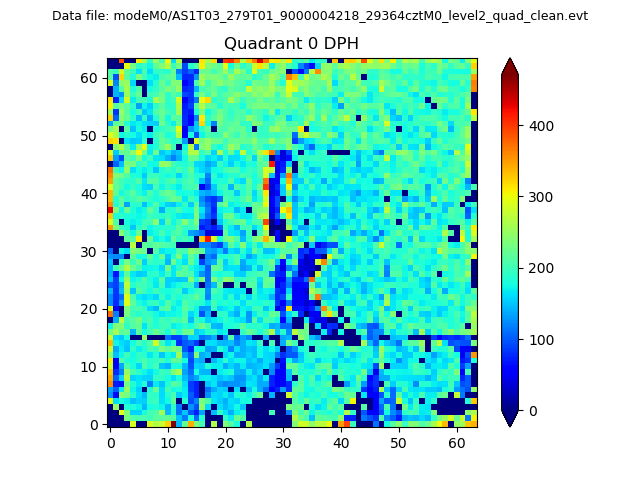 |
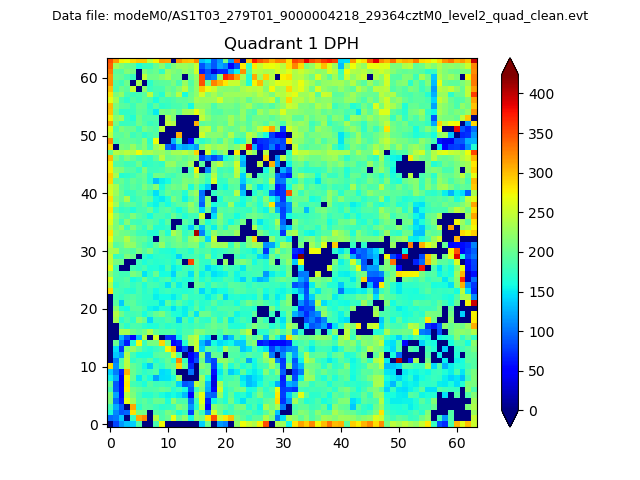 |
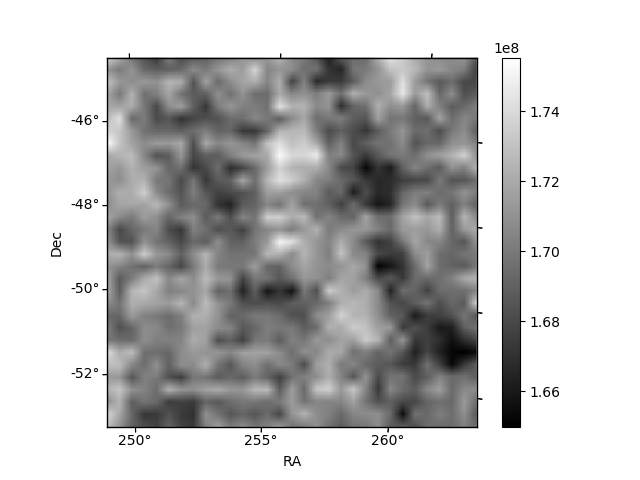
Quadrant B |
|---|---|---|---|
| Quadrant D | 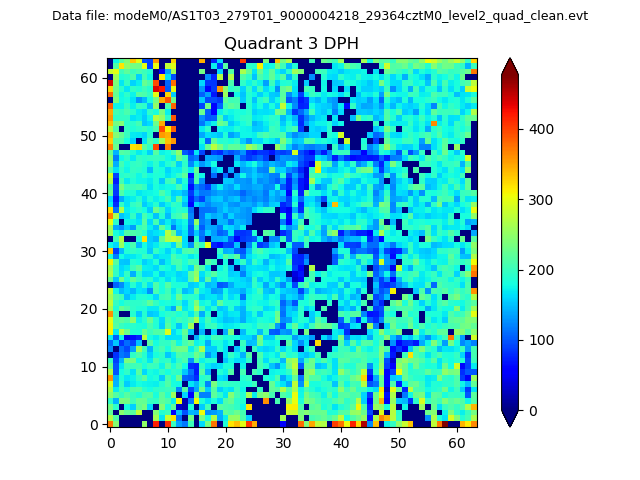 |
 |
Quadrant C |
| Plot type | Count rate plots | Images |
|---|---|---|
| Comparison with Poisson distribution Blue bars denote a histogram of data divided into 1 sec bins. Red curve is a Poisson curve with rate = median count rate of data. |
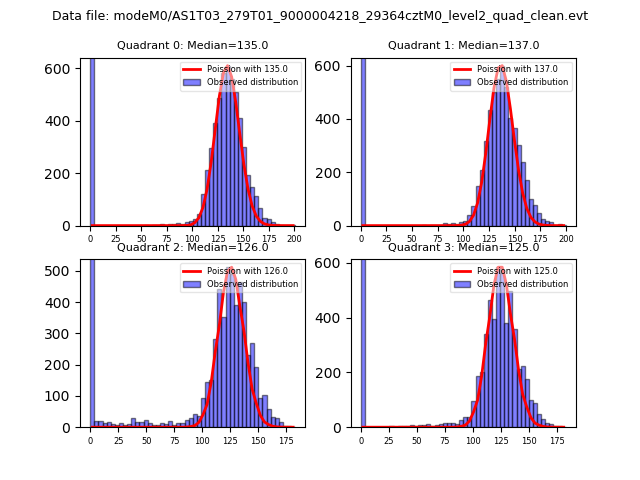 |
 |
| Quadrant-wise count rates Data is divided into 100 sec bins |
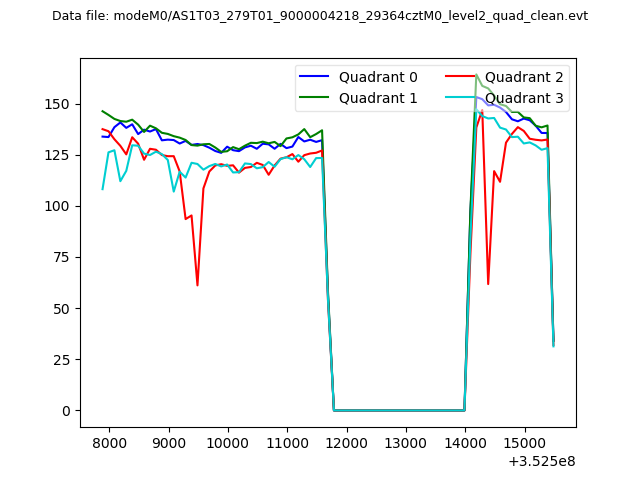 |
|
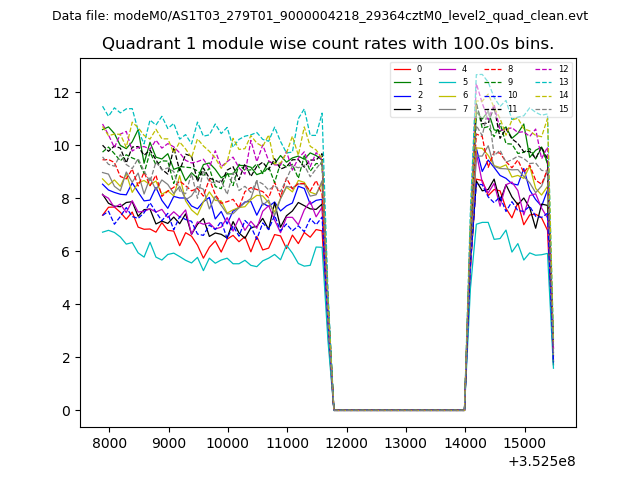
| Module-wise count rates for Quadrant A Data is divided into 100 sec bins |
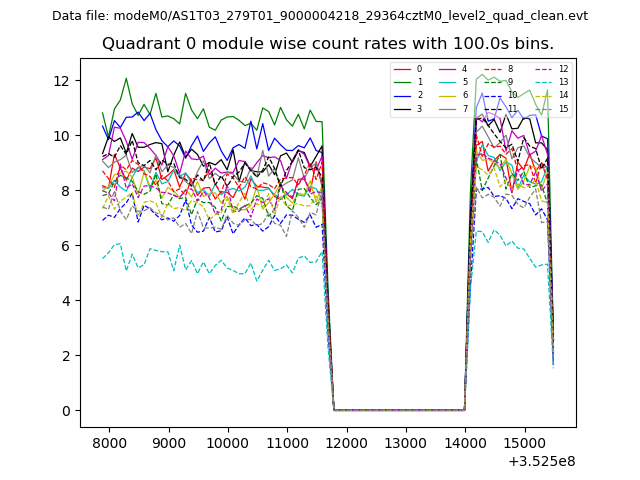 |
 |
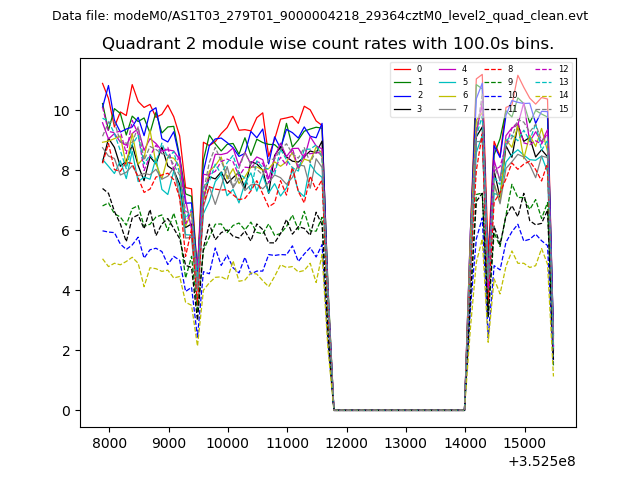
| Module-wise count rates for Quadrant B Data is divided into 100 sec bins |
 |
 |
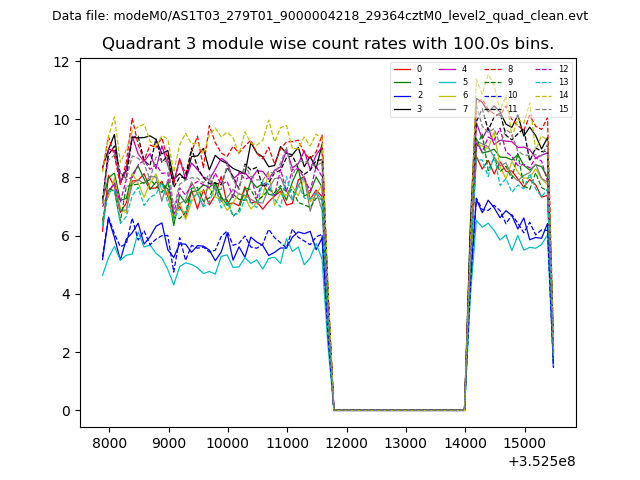
| Module-wise count rates for Quadrant C Data is divided into 100 sec bins |
 |
 |
| Module-wise count rates for Quadrant D Data is divided into 100 sec bins |
 |
 |
| Parameter | Plot |
|---|---|
| CZT HV Monitor | 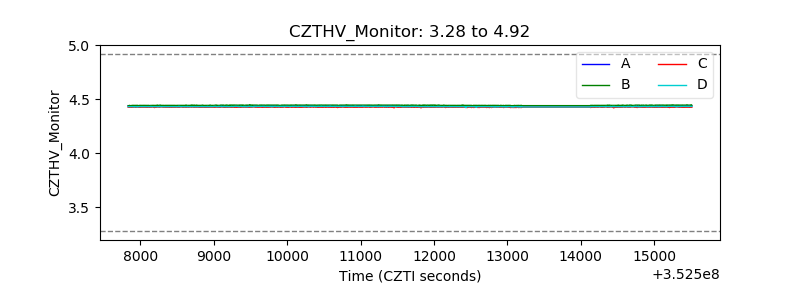 |
| D_VDD | 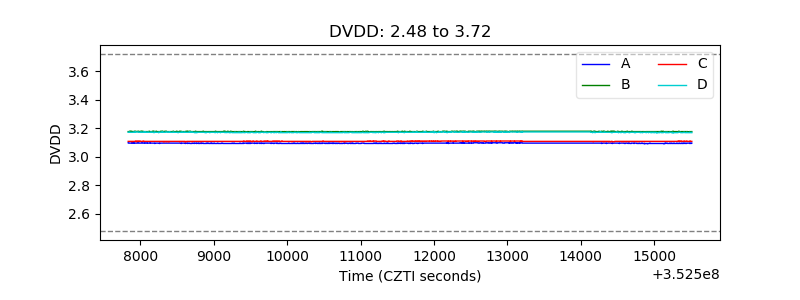 |
| Temperature 1 | 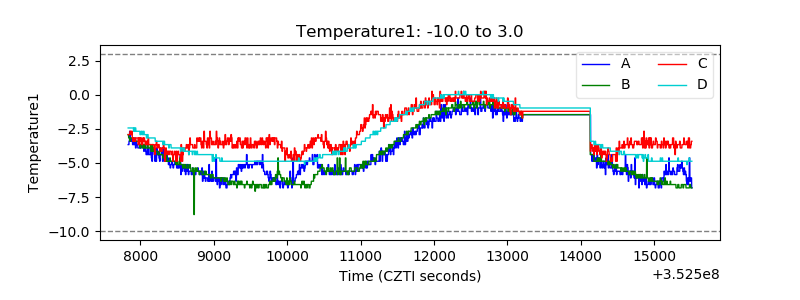 |
| Veto HV Monitor | 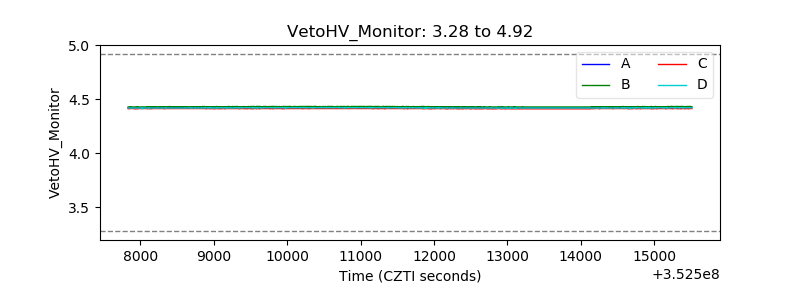 |
| Veto LLD | 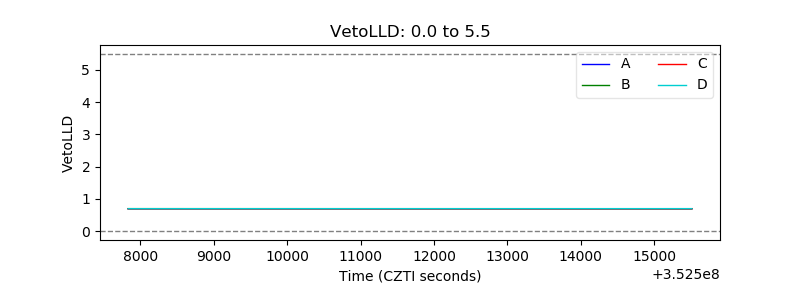 |
| Alpha Counter | 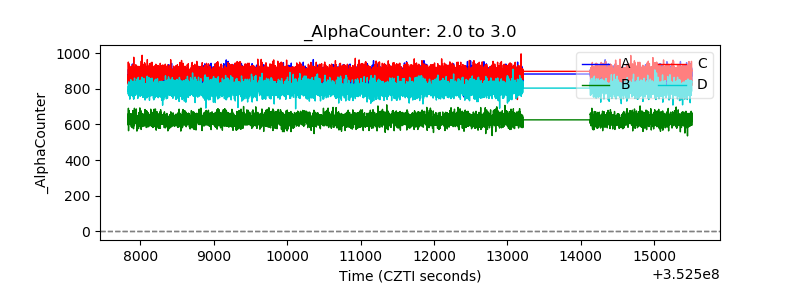 |
| _CPM_Rate | 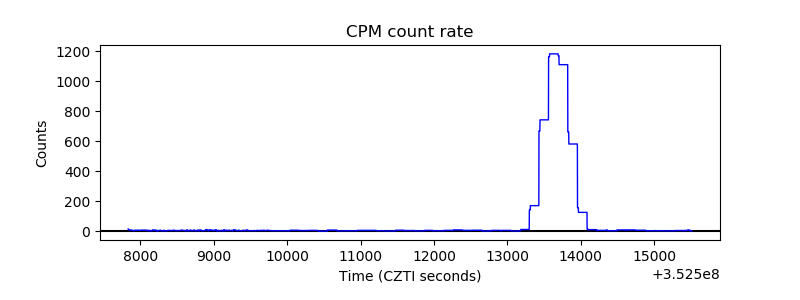 |
| CZT Counter | 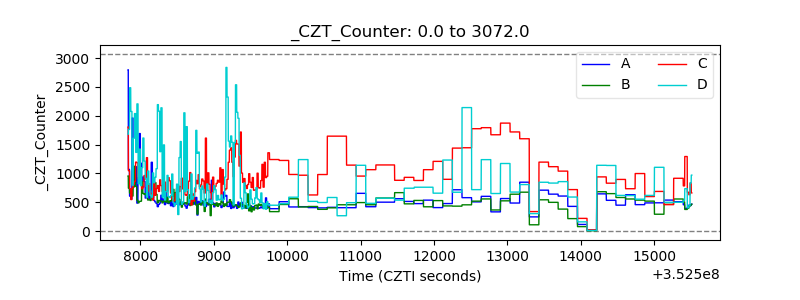 |
| +2.5 Volts monitor |  |
| +5 Volts monitor | 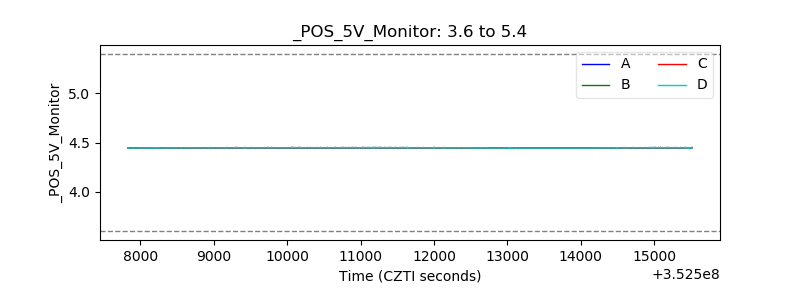 |
| _ROLL_ROT | 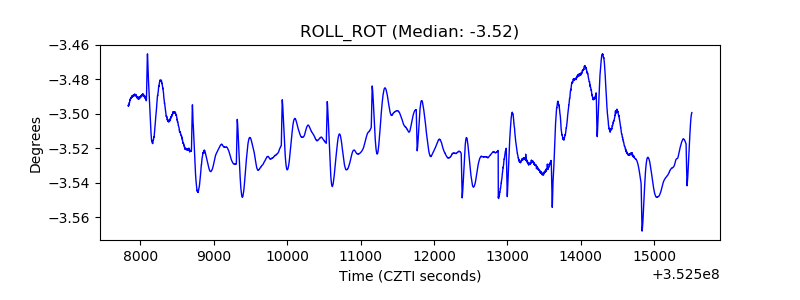 |
| _Roll_DEC | 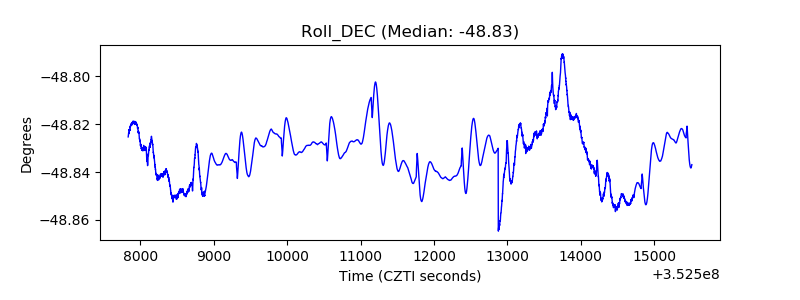 |
| _Roll_RA | 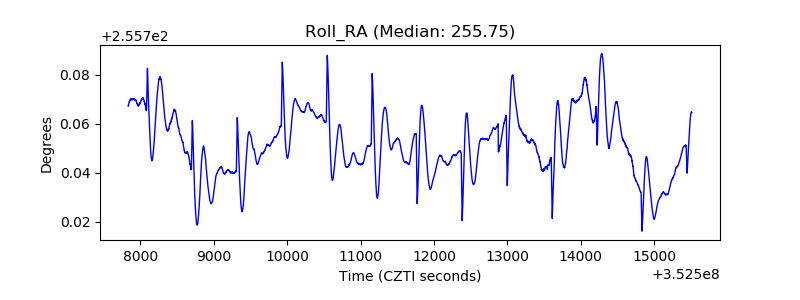 |
| Veto Counter | 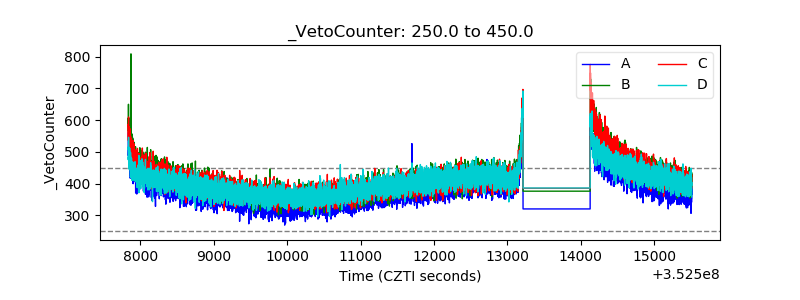 |