| Param | Original file | Final file |
|---|---|---|
| Filename | modeM0/AS1T03_279T01_9000004218_29370cztM0_level2.evt | modeM0/AS1T03_279T01_9000004218_29370cztM0_level2_quad_clean.evt |
| Size (bytes) | 656,789,760 | 105,854,400 |
| Size | 626.4 MB | 101.0 MB |
| Events in quadrant A | 3,386,858 | 740,485 |
| Events in quadrant B | 3,580,790 | 742,200 |
| Events in quadrant C | 3,592,527 | 712,110 |
| Events in quadrant D | 8,908,227 | 574,441 |
| Mode SS | |||
|---|---|---|---|
| Quadrant | BADHDUFLAG | Total packets | Discarded packets |
| A | 0 | 126 | 0 |
| B | 0 | 126 | 0 |
| C | 0 | 126 | 0 |
| D | 0 | 126 | 0 |
| Mode M9 | |||
|---|---|---|---|
| Quadrant | BADHDUFLAG | Total packets | Discarded packets |
| A | 0 | 13 | 0 |
| B | 0 | 13 | 0 |
| C | 0 | 13 | 0 |
| D | 0 | 13 | 0 |
| Mode M0 | |||
|---|---|---|---|
| Quadrant | BADHDUFLAG | Total packets | Discarded packets |
| A | 0 | 13671 | 1 |
| B | 0 | 14347 | 1 |
| C | 0 | 14398 | 1 |
| D | 0 | 30896 | 1 |
| Quadrant | Total seconds | Saturated seconds | Saturation percentage |
|---|---|---|---|
| A | 6252 | 53 | 0.847729% |
| B | 6252 | 75 | 1.199616% |
| C | 6252 | 107 | 1.711452% |
| D | 6252 | 2015 | 32.229687% |
Noise dominated data is calculated using 1-second bins in cleaned event files. If a bin has >2000 counts, and if more than 50% of those come from <1% of pixels, then it is considered to be noise-dominated and hence unusable.
| Quadrant | # 1 sec bins | Bins with >0 counts | Bins with >2000 counts | High rate bins dominated by noise | Noise dominated (total time) | Noise dominated (detector-on time) | Marked lightcurve |
|---|---|---|---|---|---|---|---|
| A | 7542 | 6253 | 0 | 0 | 0.00% | 0.00% | 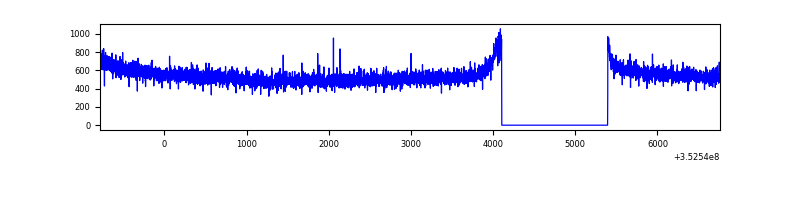 |
| B | 7542 | 6253 | 4 | 4 | 0.05% | 0.06% | 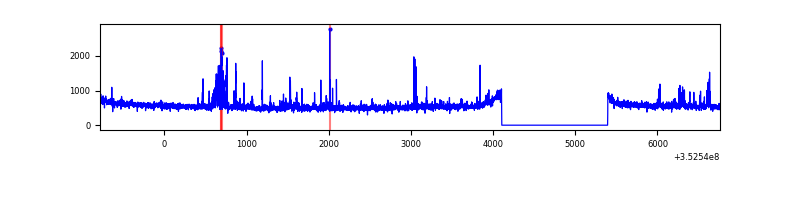 |
| C | 7542 | 6253 | 0 | 0 | 0.00% | 0.00% | 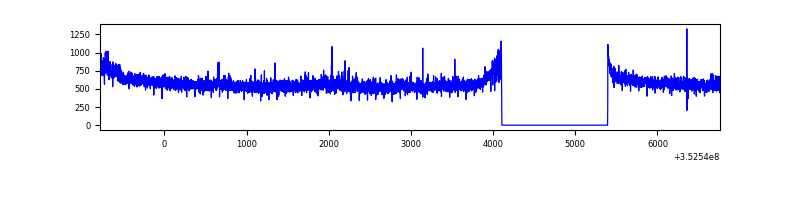 |
| D | 7542 | 6253 | 1808 | 1808 | 23.97% | 28.91% | 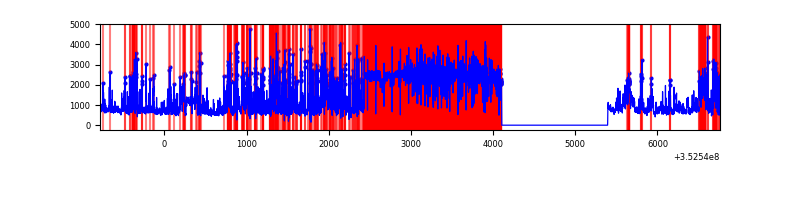 |
Top three noisy pixels from each quadrant. If the there are fewer than three noisy pixels in the level2.evt file, extra rows are filled as -1
| Pixel properties | Quadrant properties | ||||||
|---|---|---|---|---|---|---|---|
| Quadrant | DetID | PixID | Counts | Sigma | Mean | Median | Sigma |
| A | 13 | 254 | 12445 | 67.35 | 876 | 863 | 172.0 |
| A | 0 | 226 | 7548 | 38.87 | 876 | 863 | 172.0 |
| A | 3 | 137 | 7282 | 37.33 | 876 | 863 | 172.0 |
| B | 15 | 33 | 83069 | 521.19 | 857 | 841 | 157.8 |
| B | 0 | 190 | 37643 | 233.27 | 857 | 841 | 157.8 |
| B | 0 | 230 | 30706 | 189.3 | 857 | 841 | 157.8 |
| C | 14 | 238 | 141969 | 724.54 | 845 | 851 | 194.8 |
| C | 3 | 233 | 135139 | 689.47 | 845 | 851 | 194.8 |
| C | 2 | 114 | 15610 | 75.78 | 845 | 851 | 194.8 |
| D | 12 | 33 | 3662341 | 22112.38 | 704 | 689 | 165.6 |
| D | 1 | 52 | 1778272 | 10734.66 | 704 | 689 | 165.6 |
| D | 7 | 80 | 399338 | 2407.4 | 704 | 689 | 165.6 |
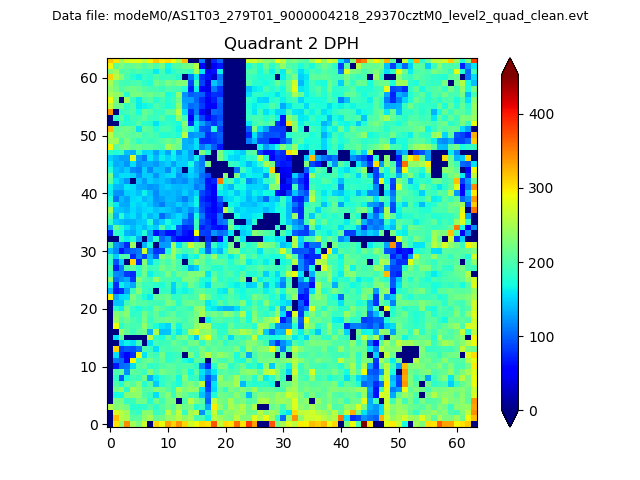
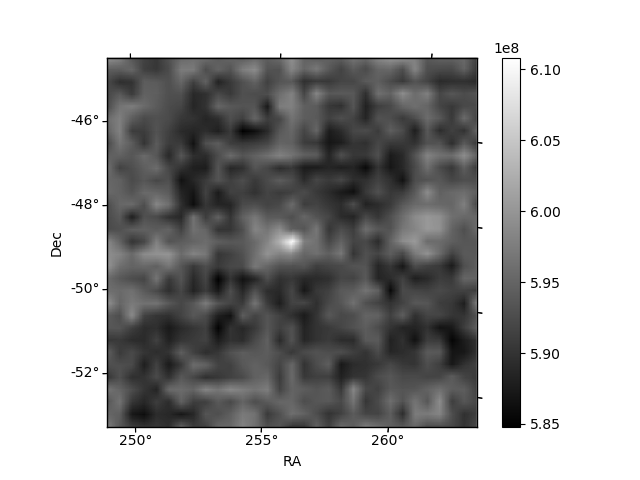
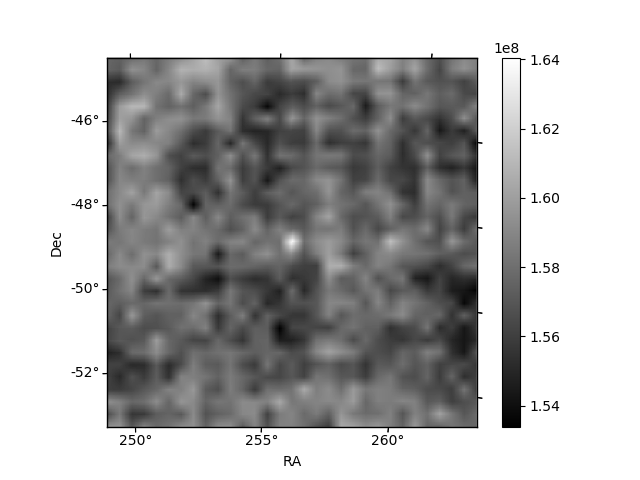
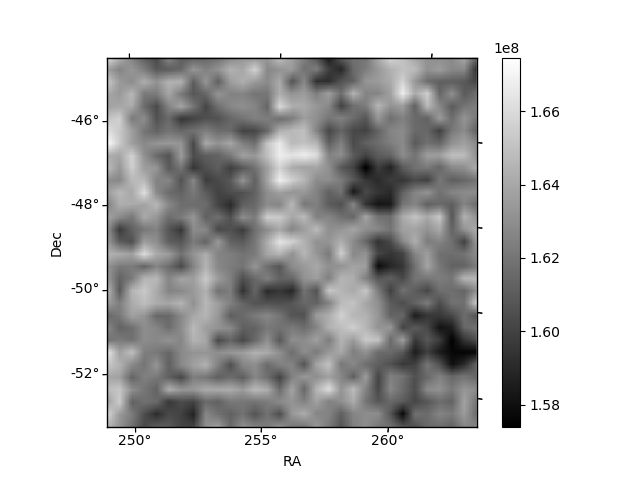
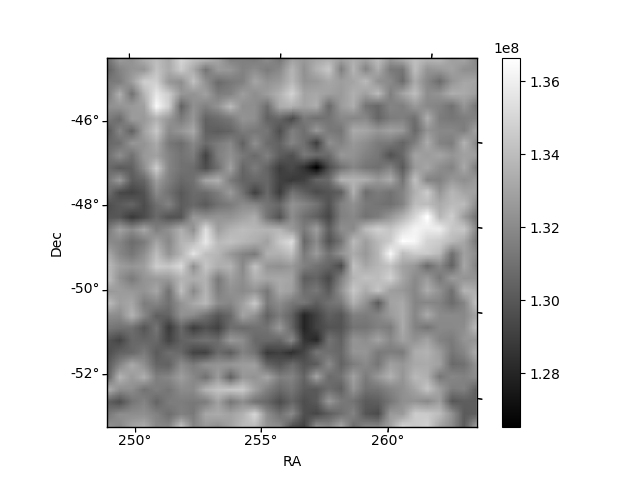
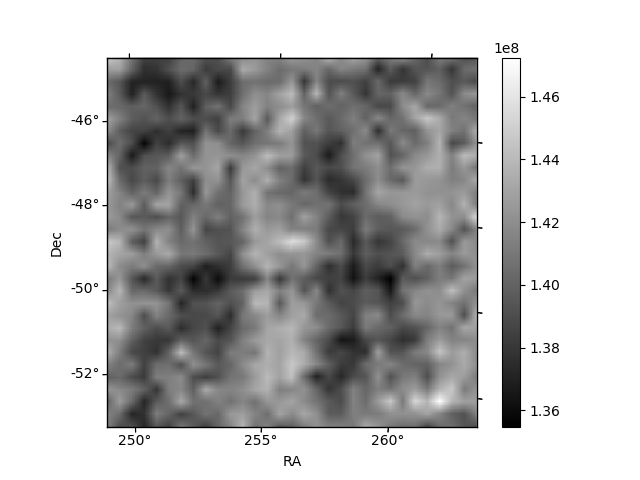
Histogram calculated using DETX and DETY for each event in the final _common_clean file
| Quadrant A | 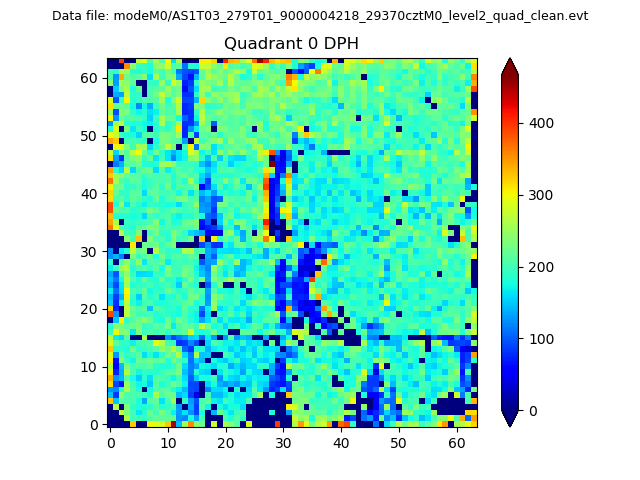 |
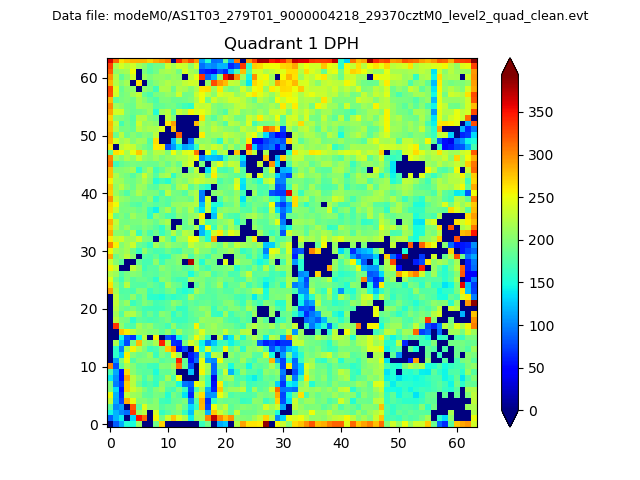 |
Quadrant B |
|---|---|---|---|
| Quadrant D | 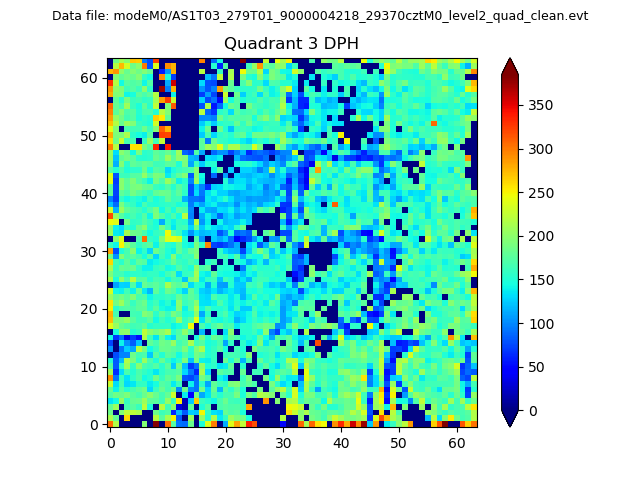 |
 |
Quadrant C |
| Plot type | Count rate plots | Images |
|---|---|---|
| Comparison with Poisson distribution Blue bars denote a histogram of data divided into 1 sec bins. Red curve is a Poisson curve with rate = median count rate of data. |
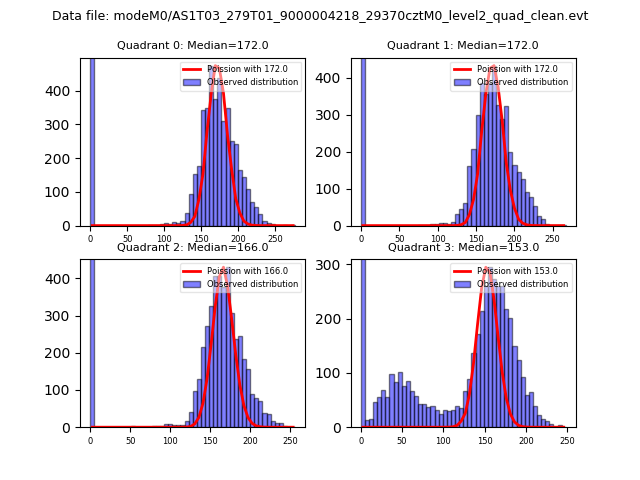 |
 |
| Quadrant-wise count rates Data is divided into 100 sec bins |
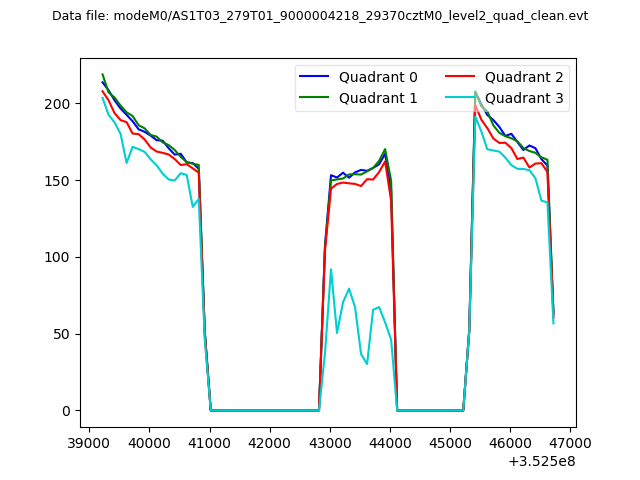 |
|
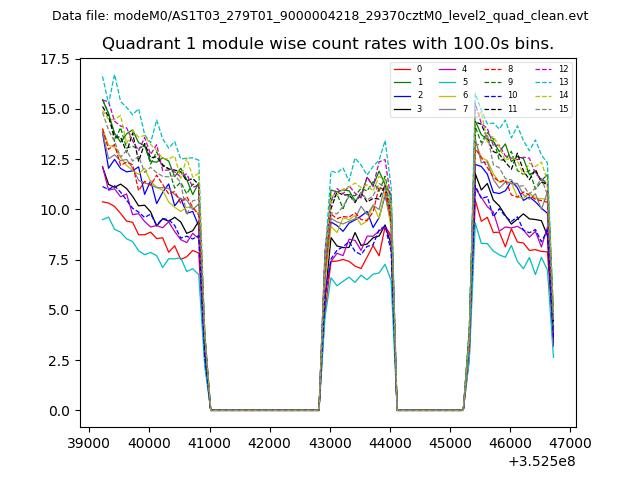
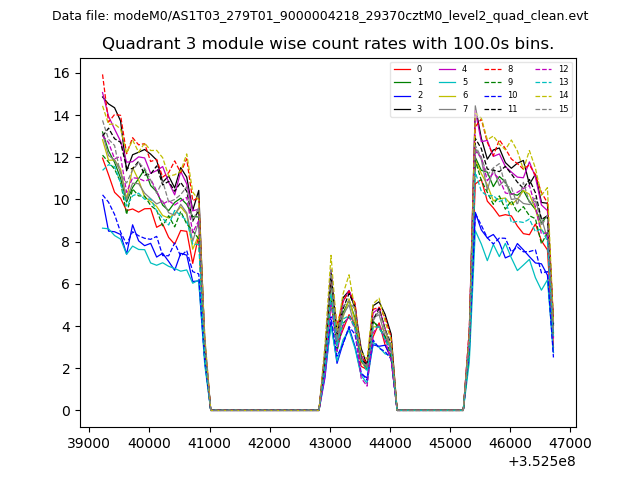
| Module-wise count rates for Quadrant A Data is divided into 100 sec bins |
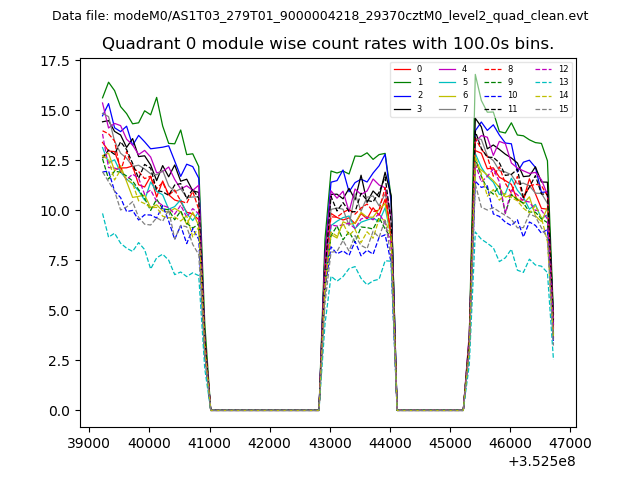 |
 |
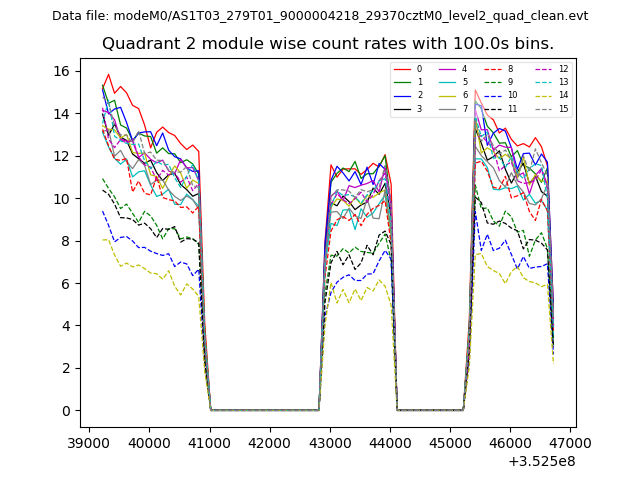
| Module-wise count rates for Quadrant B Data is divided into 100 sec bins |
 |
 |
| Module-wise count rates for Quadrant C Data is divided into 100 sec bins |
 |
 |
| Module-wise count rates for Quadrant D Data is divided into 100 sec bins |
 |
 |
| Parameter | Plot |
|---|---|
| CZT HV Monitor | 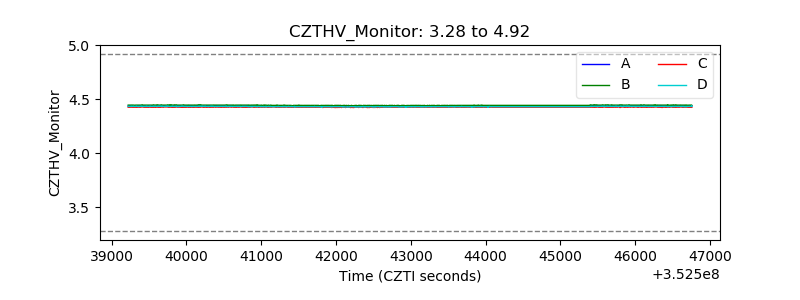 |
| D_VDD | 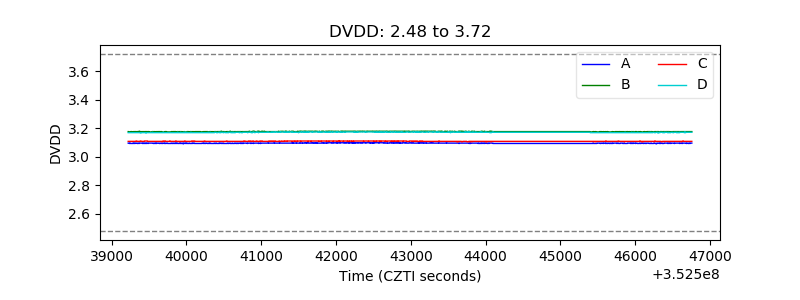 |
| Temperature 1 | 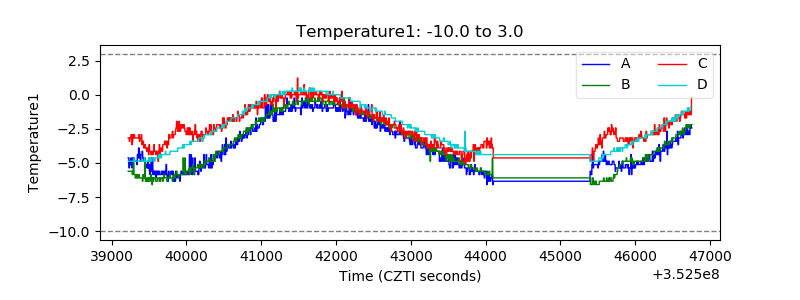 |
| Veto HV Monitor | 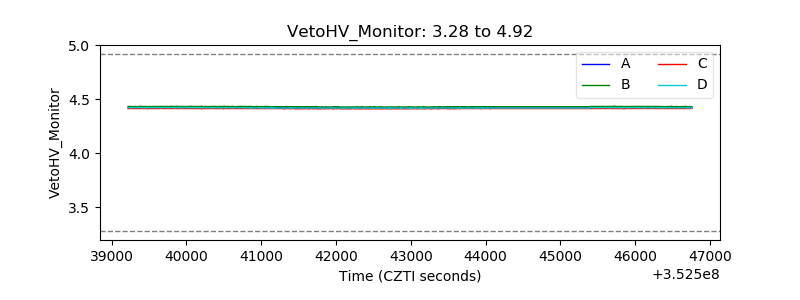 |
| Veto LLD | 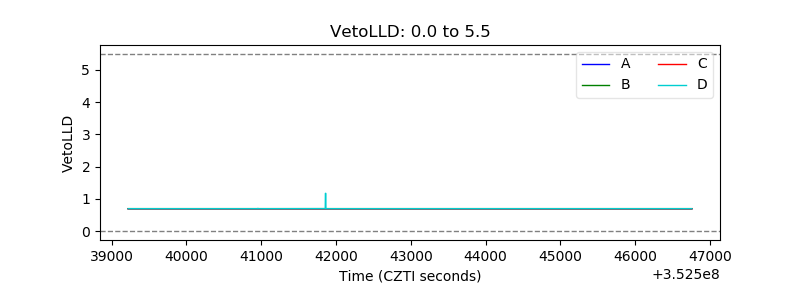 |
| Alpha Counter | 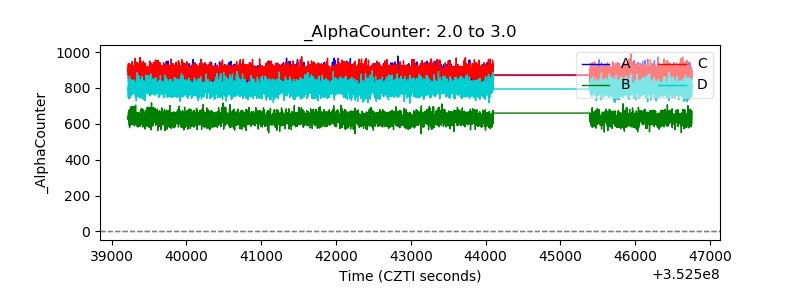 |
| _CPM_Rate | 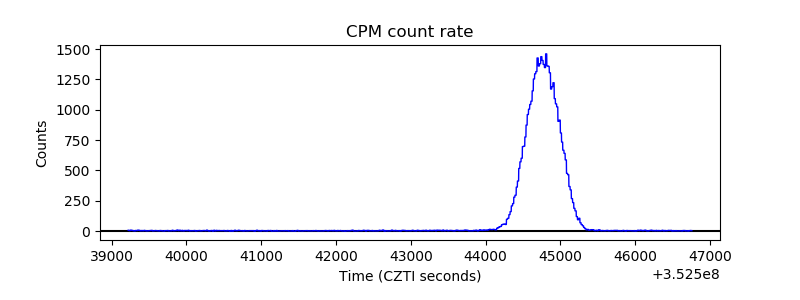 |
| CZT Counter | 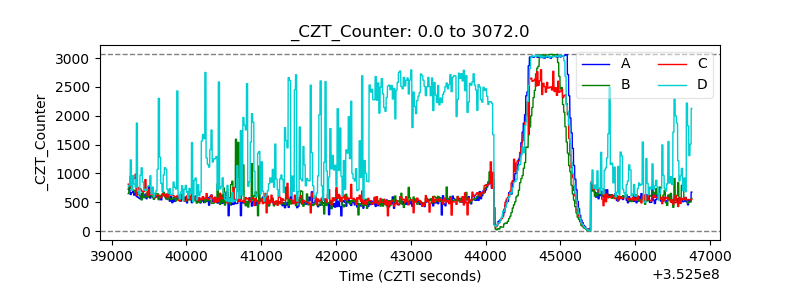 |
| +2.5 Volts monitor |  |
| +5 Volts monitor |  |
| _ROLL_ROT | 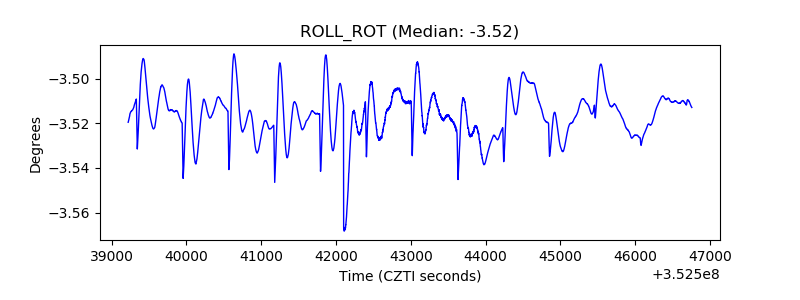 |
| _Roll_DEC | 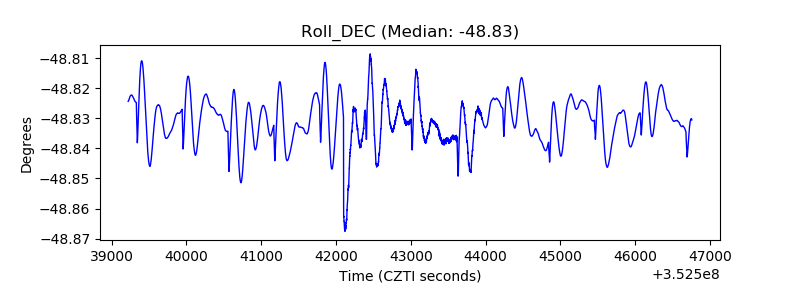 |
| _Roll_RA | 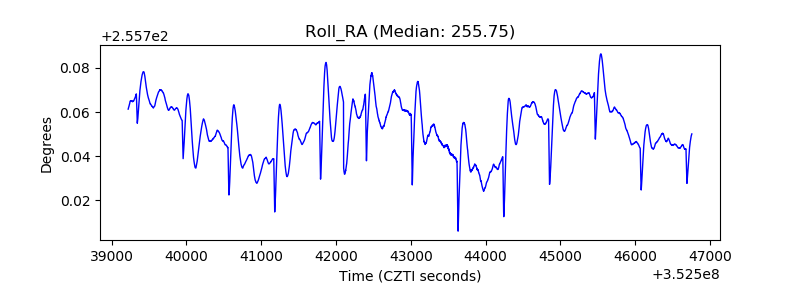 |
| Veto Counter | 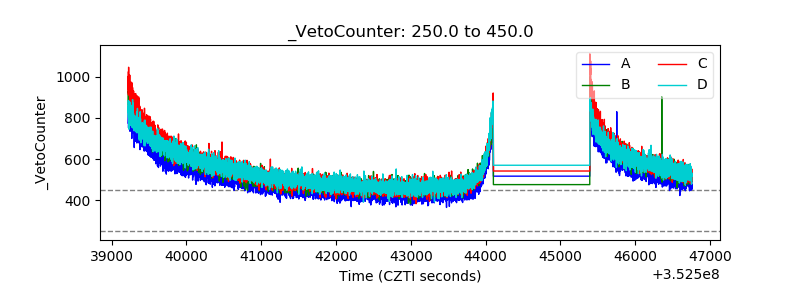 |