| Param | Original file | Final file |
|---|---|---|
| Filename | modeM0/AS1T03_279T01_9000004218_29371cztM0_level2.evt | modeM0/AS1T03_279T01_9000004218_29371cztM0_level2_quad_clean.evt |
| Size (bytes) | 763,320,960 | 83,053,440 |
| Size | 728.0 MB | 79.2 MB |
| Events in quadrant A | 3,098,551 | 598,810 |
| Events in quadrant B | 3,425,782 | 597,545 |
| Events in quadrant C | 3,332,560 | 570,927 |
| Events in quadrant D | 12,857,287 | 330,629 |
| Mode SS | |||
|---|---|---|---|
| Quadrant | BADHDUFLAG | Total packets | Discarded packets |
| A | 0 | 122 | 0 |
| B | 0 | 122 | 0 |
| C | 0 | 122 | 0 |
| D | 0 | 122 | 0 |
| Mode M9 | |||
|---|---|---|---|
| Quadrant | BADHDUFLAG | Total packets | Discarded packets |
| A | 0 | 12 | 0 |
| B | 0 | 12 | 0 |
| C | 0 | 12 | 0 |
| D | 0 | 12 | 0 |
| Mode M0 | |||
|---|---|---|---|
| Quadrant | BADHDUFLAG | Total packets | Discarded packets |
| A | 0 | 12515 | 1 |
| B | 0 | 13625 | 1 |
| C | 0 | 13353 | 1 |
| D | 0 | 42315 | 1 |
| Quadrant | Total seconds | Saturated seconds | Saturation percentage |
|---|---|---|---|
| A | 5951 | 76 | 1.277096% |
| B | 5952 | 102 | 1.713710% |
| C | 5952 | 122 | 2.049731% |
| D | 5952 | 4538 | 76.243280% |
Noise dominated data is calculated using 1-second bins in cleaned event files. If a bin has >2000 counts, and if more than 50% of those come from <1% of pixels, then it is considered to be noise-dominated and hence unusable.
| Quadrant | # 1 sec bins | Bins with >0 counts | Bins with >2000 counts | High rate bins dominated by noise | Noise dominated (total time) | Noise dominated (detector-on time) | Marked lightcurve |
|---|---|---|---|---|---|---|---|
| A | 7136 | 5952 | 0 | 0 | 0.00% | 0.00% | 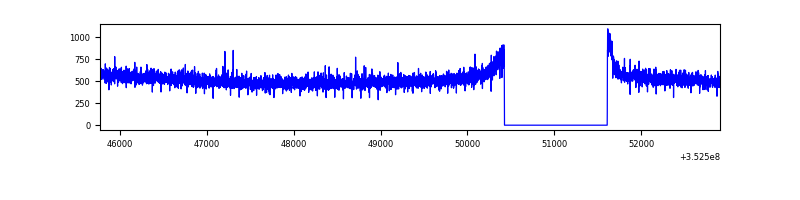 |
| B | 7137 | 5953 | 10 | 10 | 0.14% | 0.17% | 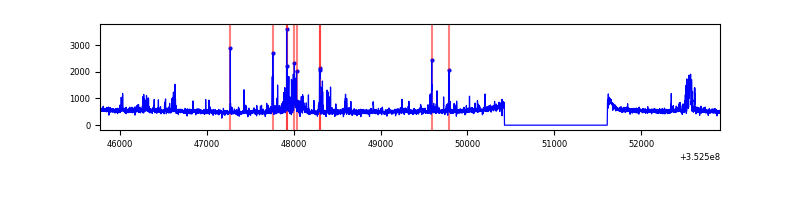 |
| C | 7137 | 5953 | 0 | 0 | 0.00% | 0.00% | 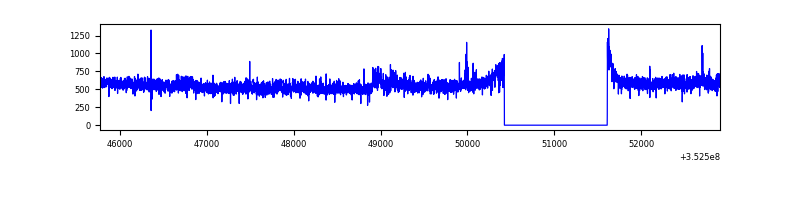 |
| D | 7137 | 5952 | 4118 | 4118 | 57.70% | 69.19% | 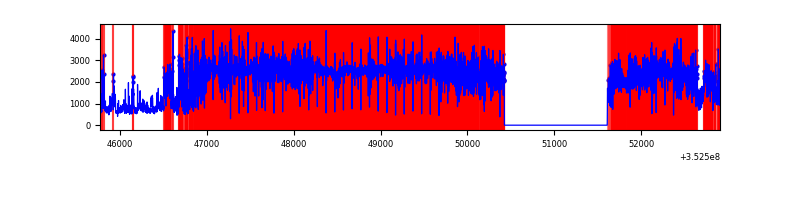 |
Top three noisy pixels from each quadrant. If the there are fewer than three noisy pixels in the level2.evt file, extra rows are filled as -1
| Pixel properties | Quadrant properties | ||||||
|---|---|---|---|---|---|---|---|
| Quadrant | DetID | PixID | Counts | Sigma | Mean | Median | Sigma |
| A | 13 | 254 | 11961 | 70.1 | 802 | 787 | 159.4 |
| A | 0 | 226 | 7004 | 39.0 | 802 | 787 | 159.4 |
| A | 3 | 137 | 6870 | 38.16 | 802 | 787 | 159.4 |
| B | 5 | 172 | 78645 | 532.04 | 785 | 767 | 146.4 |
| B | 10 | 245 | 71339 | 482.12 | 785 | 767 | 146.4 |
| B | 0 | 190 | 50406 | 339.12 | 785 | 767 | 146.4 |
| C | 3 | 233 | 141675 | 795.96 | 765 | 774 | 177.0 |
| C | 14 | 238 | 127485 | 715.8 | 765 | 774 | 177.0 |
| C | 10 | 9 | 52354 | 291.38 | 765 | 774 | 177.0 |
| D | 12 | 33 | 9657134 | 87824.16 | 459 | 449 | 110.0 |
| D | 1 | 52 | 974666 | 8860.16 | 459 | 449 | 110.0 |
| D | 7 | 80 | 175528 | 1592.28 | 459 | 449 | 110.0 |
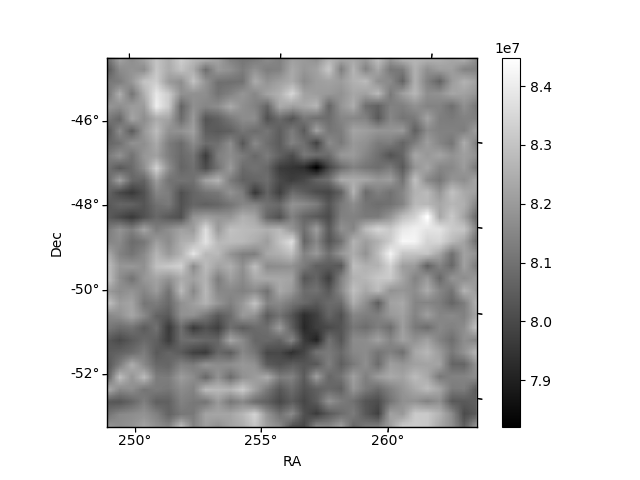
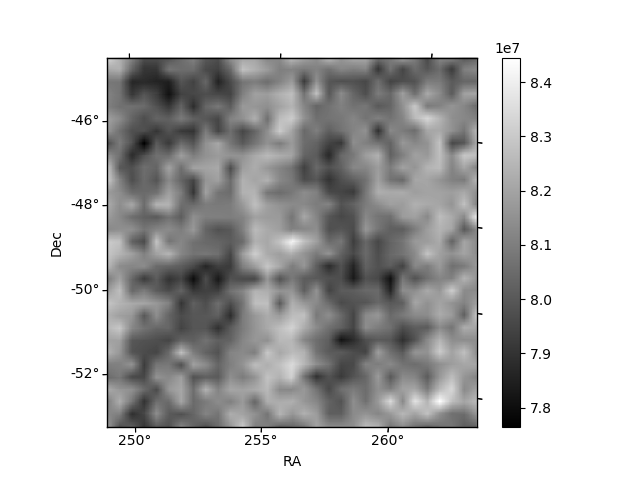
Histogram calculated using DETX and DETY for each event in the final _common_clean file
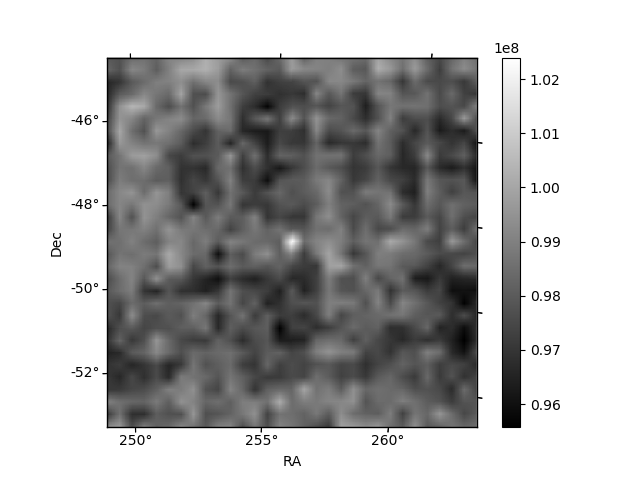
| Quadrant A |  |
 |
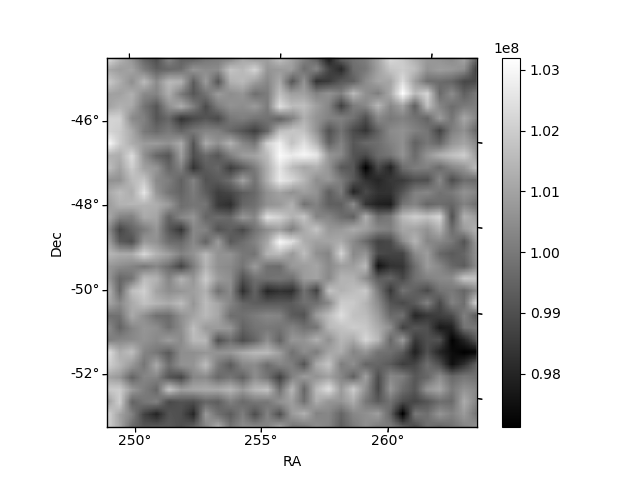
Quadrant B |
|---|---|---|---|
| Quadrant D |  |
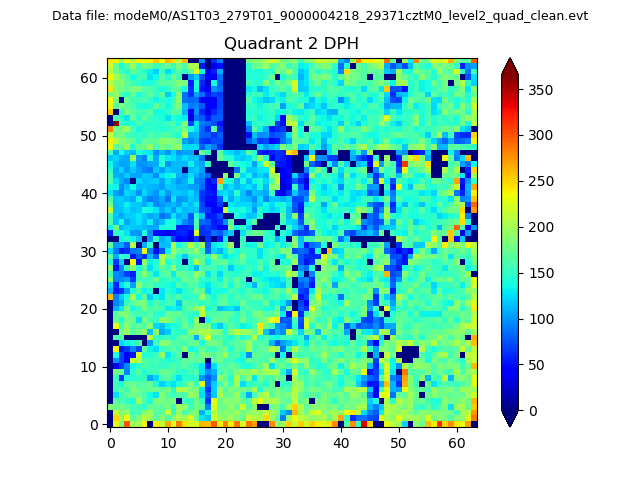 |
Quadrant C |
| Plot type | Count rate plots | Images |
|---|---|---|
| Comparison with Poisson distribution Blue bars denote a histogram of data divided into 1 sec bins. Red curve is a Poisson curve with rate = median count rate of data. |
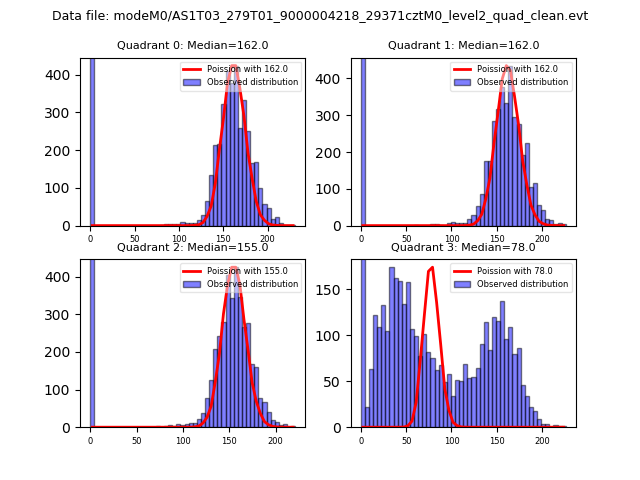 |
 |
| Quadrant-wise count rates Data is divided into 100 sec bins |
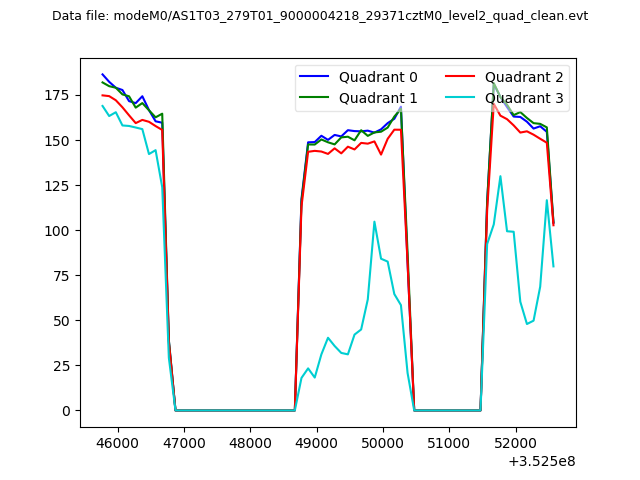 |
|
| Module-wise count rates for Quadrant A Data is divided into 100 sec bins |
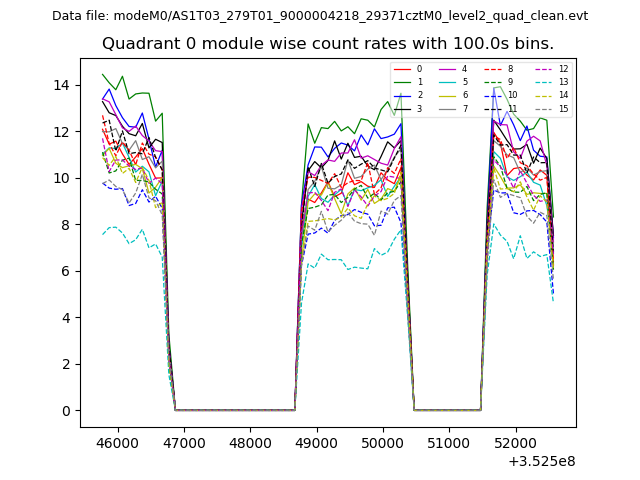 |
 |
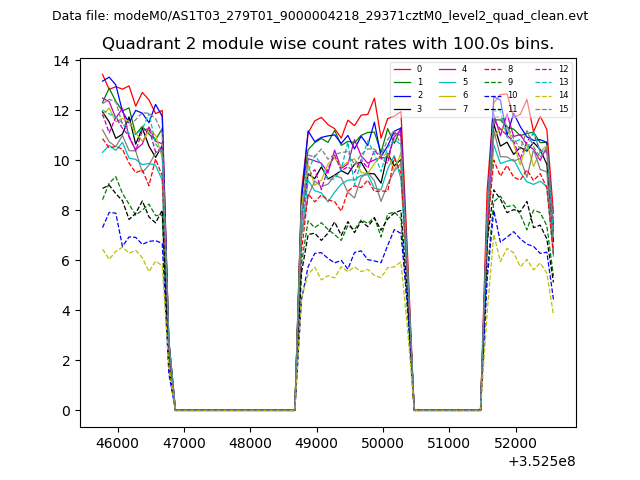
| Module-wise count rates for Quadrant B Data is divided into 100 sec bins |
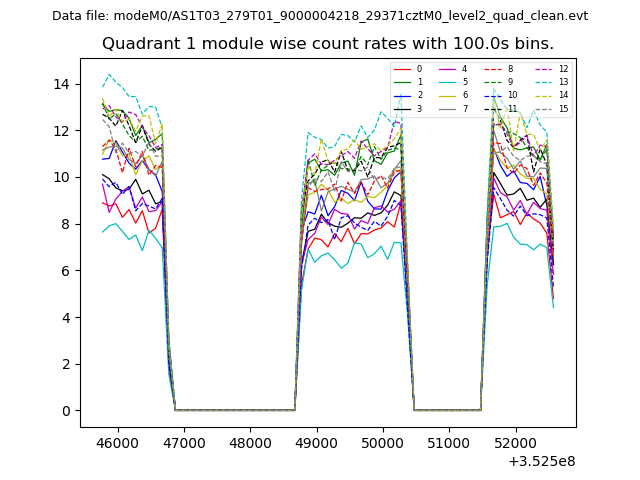 |
 |
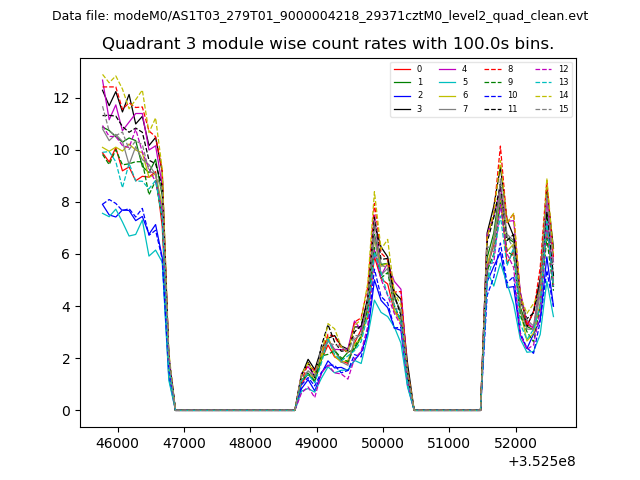
| Module-wise count rates for Quadrant C Data is divided into 100 sec bins |
 |
 |
| Module-wise count rates for Quadrant D Data is divided into 100 sec bins |
 |
 |
| Parameter | Plot |
|---|---|
| CZT HV Monitor | 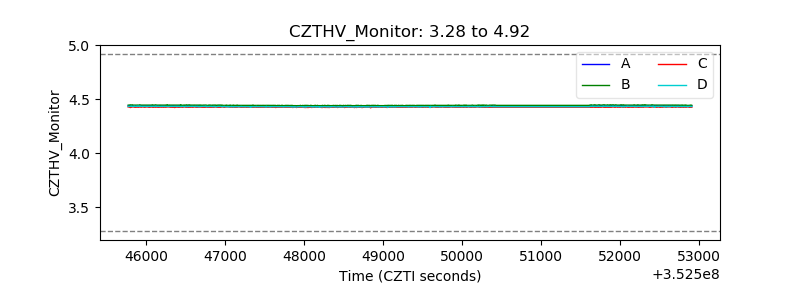 |
| D_VDD | 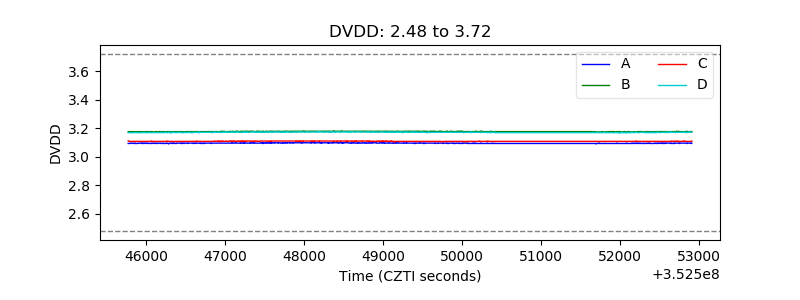 |
| Temperature 1 | 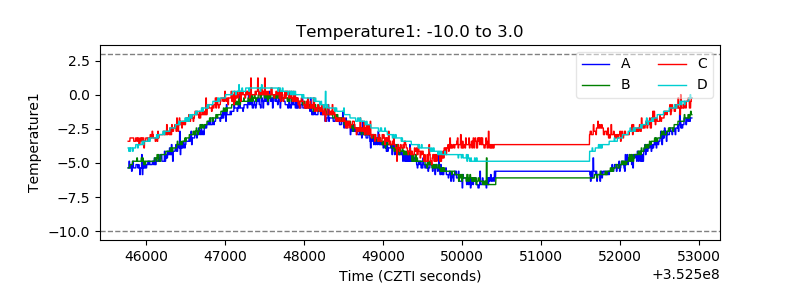 |
| Veto HV Monitor | 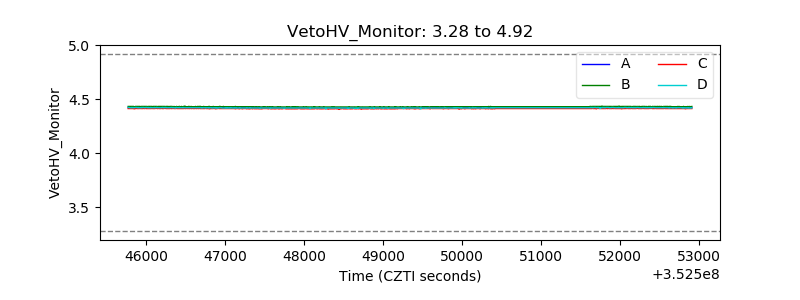 |
| Veto LLD | 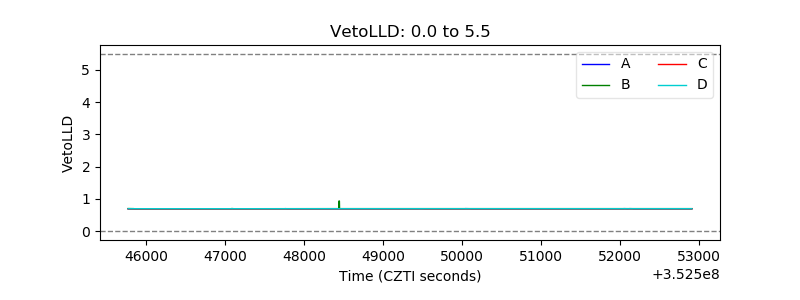 |
| Alpha Counter | 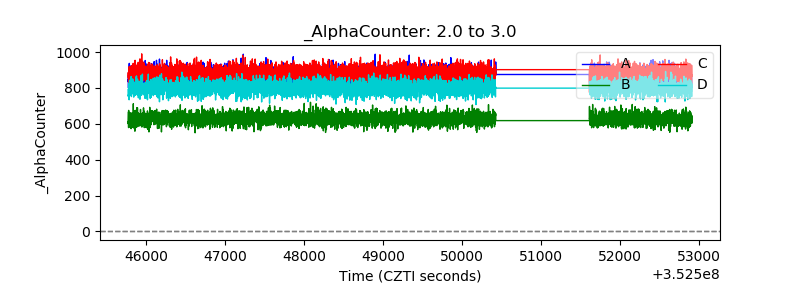 |
| _CPM_Rate | 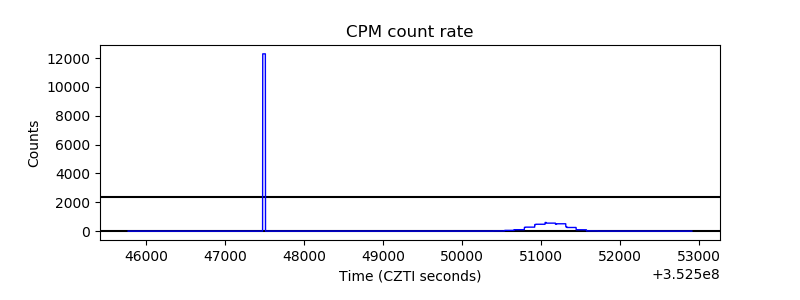 |
| CZT Counter | 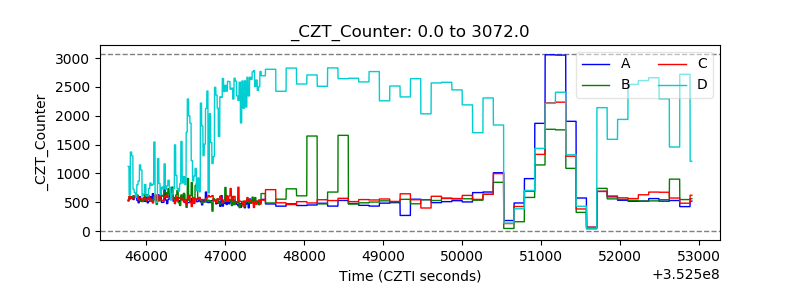 |
| +2.5 Volts monitor |  |
| +5 Volts monitor |  |
| _ROLL_ROT | 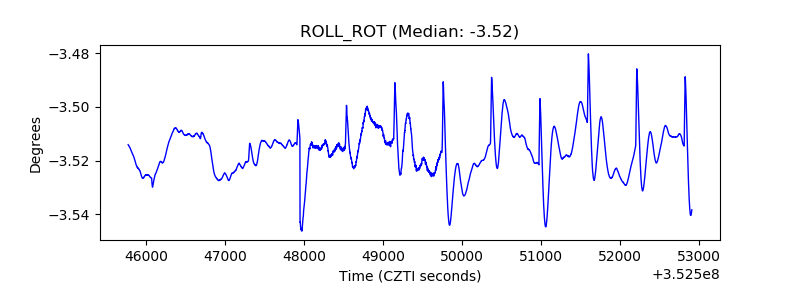 |
| _Roll_DEC | 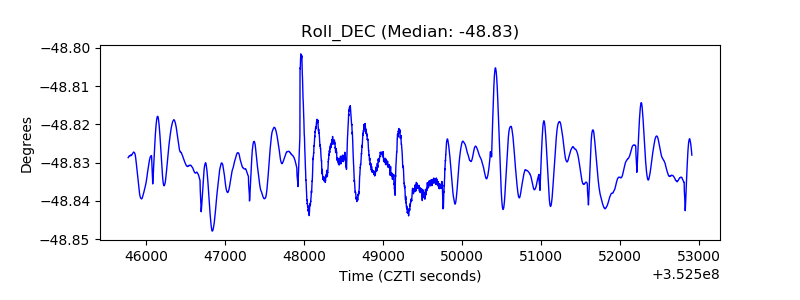 |
| _Roll_RA | 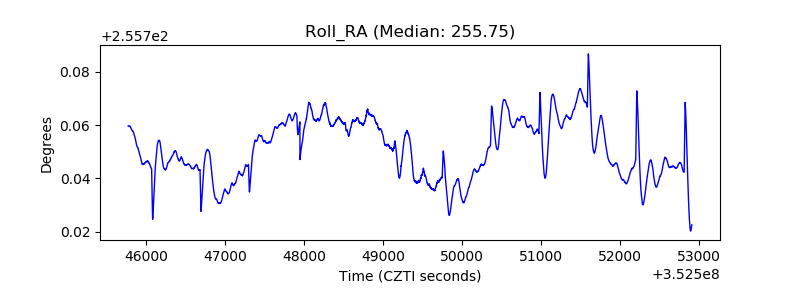 |
| Veto Counter | 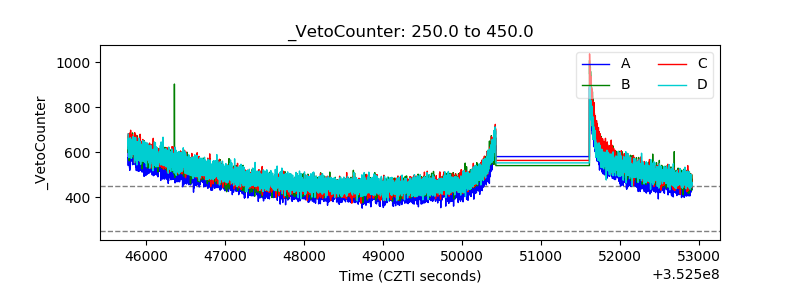 |