| Param | Original file | Final file |
|---|---|---|
| Filename | modeM0/AS1T03_279T01_9000004218_29374cztM0_level2.evt | modeM0/AS1T03_279T01_9000004218_29374cztM0_level2_quad_clean.evt |
| Size (bytes) | 712,342,080 | 85,968,000 |
| Size | 679.3 MB | 82.0 MB |
| Events in quadrant A | 3,730,248 | 540,282 |
| Events in quadrant B | 4,012,472 | 539,311 |
| Events in quadrant C | 4,038,423 | 518,474 |
| Events in quadrant D | 9,279,874 | 477,958 |
| Mode SS | |||
|---|---|---|---|
| Quadrant | BADHDUFLAG | Total packets | Discarded packets |
| A | 0 | 154 | 0 |
| B | 0 | 154 | 0 |
| C | 0 | 154 | 0 |
| D | 0 | 154 | 0 |
| Mode M9 | |||
|---|---|---|---|
| Quadrant | BADHDUFLAG | Total packets | Discarded packets |
| A | 0 | 2 | 0 |
| B | 0 | 2 | 0 |
| C | 0 | 2 | 0 |
| D | 0 | 2 | 0 |
| Mode M0 | |||
|---|---|---|---|
| Quadrant | BADHDUFLAG | Total packets | Discarded packets |
| A | 0 | 15839 | 1 |
| B | 0 | 16574 | 1 |
| C | 0 | 16394 | 1 |
| D | 0 | 32904 | 2 |
| Quadrant | Total seconds | Saturated seconds | Saturation percentage |
|---|---|---|---|
| A | 7579 | 200 | 2.638871% |
| B | 7580 | 243 | 3.205805% |
| C | 7580 | 228 | 3.007916% |
| D | 7579 | 1456 | 19.210978% |
Noise dominated data is calculated using 1-second bins in cleaned event files. If a bin has >2000 counts, and if more than 50% of those come from <1% of pixels, then it is considered to be noise-dominated and hence unusable.
| Quadrant | # 1 sec bins | Bins with >0 counts | Bins with >2000 counts | High rate bins dominated by noise | Noise dominated (total time) | Noise dominated (detector-on time) | Marked lightcurve |
|---|---|---|---|---|---|---|---|
| A | 7729 | 7581 | 1 | 1 | 0.01% | 0.01% | 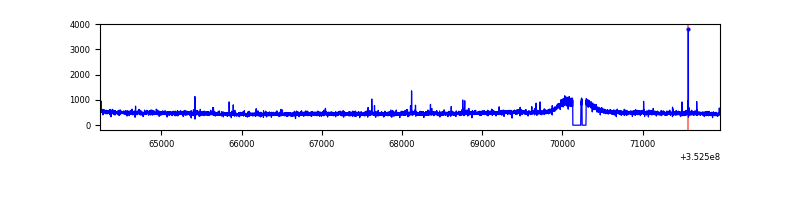 |
| B | 7730 | 7582 | 8 | 8 | 0.10% | 0.11% | 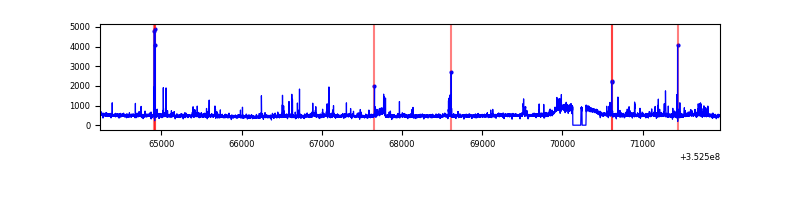 |
| C | 7730 | 7582 | 1 | 1 | 0.01% | 0.01% | 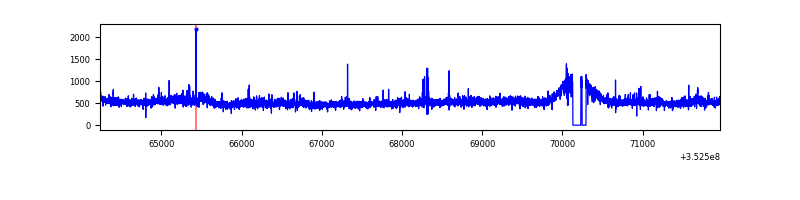 |
| D | 7729 | 7581 | 1155 | 1155 | 14.94% | 15.24% | 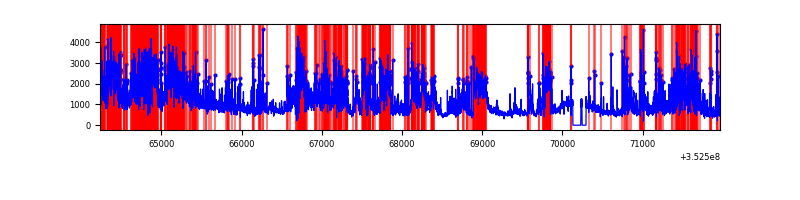 |
Top three noisy pixels from each quadrant. If the there are fewer than three noisy pixels in the level2.evt file, extra rows are filled as -1
| Pixel properties | Quadrant properties | ||||||
|---|---|---|---|---|---|---|---|
| Quadrant | DetID | PixID | Counts | Sigma | Mean | Median | Sigma |
| A | 14 | 235 | 20269 | 100.71 | 954 | 936 | 192.0 |
| A | 13 | 254 | 14867 | 72.57 | 954 | 936 | 192.0 |
| A | 0 | 13 | 12038 | 57.83 | 954 | 936 | 192.0 |
| B | 0 | 229 | 205638 | 1152.9 | 941 | 919 | 177.6 |
| B | 0 | 190 | 30374 | 165.88 | 941 | 919 | 177.6 |
| B | 10 | 245 | 24714 | 134.0 | 941 | 919 | 177.6 |
| C | 3 | 233 | 186322 | 869.76 | 912 | 918 | 213.2 |
| C | 14 | 238 | 152160 | 709.5 | 912 | 918 | 213.2 |
| C | 10 | 9 | 96010 | 446.09 | 912 | 918 | 213.2 |
| D | 12 | 33 | 3755329 | 17966.87 | 870 | 847 | 209.0 |
| D | 1 | 52 | 1384731 | 6622.5 | 870 | 847 | 209.0 |
| D | 7 | 80 | 258959 | 1235.18 | 870 | 847 | 209.0 |
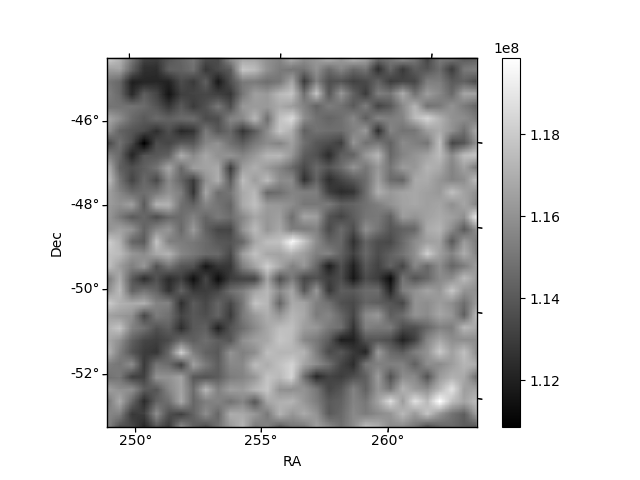
Histogram calculated using DETX and DETY for each event in the final _common_clean file
| Quadrant A |  |
 |
Quadrant B |
|---|---|---|---|
| Quadrant D |  |
 |
Quadrant C |
| Plot type | Count rate plots | Images |
|---|---|---|
| Comparison with Poisson distribution Blue bars denote a histogram of data divided into 1 sec bins. Red curve is a Poisson curve with rate = median count rate of data. |
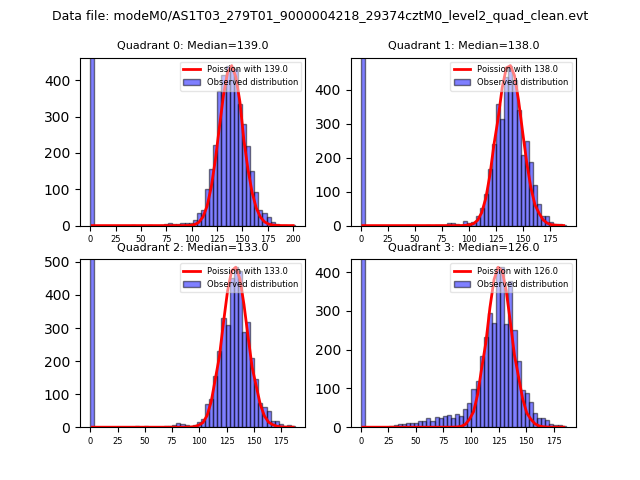 |
 |
| Quadrant-wise count rates Data is divided into 100 sec bins |
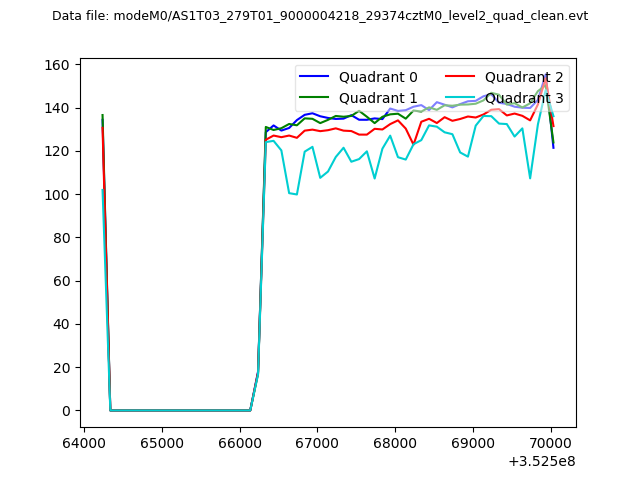 |
|
| Module-wise count rates for Quadrant A Data is divided into 100 sec bins |
 |
 |
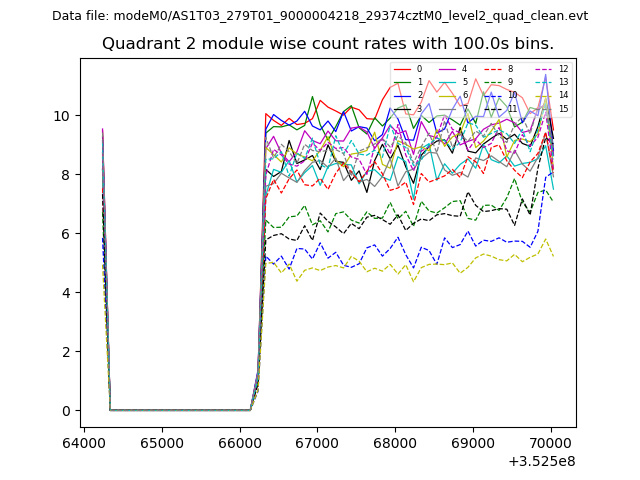
| Module-wise count rates for Quadrant B Data is divided into 100 sec bins |
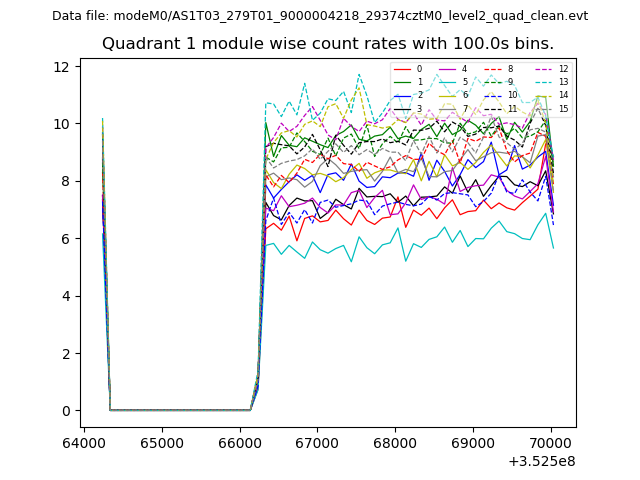 |
 |
| Module-wise count rates for Quadrant C Data is divided into 100 sec bins |
 |
 |
| Module-wise count rates for Quadrant D Data is divided into 100 sec bins |
 |
 |
| Parameter | Plot |
|---|---|
| CZT HV Monitor | 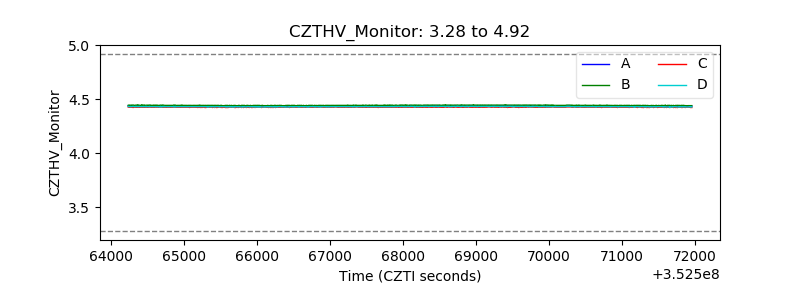 |
| D_VDD |  |
| Temperature 1 |  |
| Veto HV Monitor |  |
| Veto LLD |  |
| Alpha Counter | 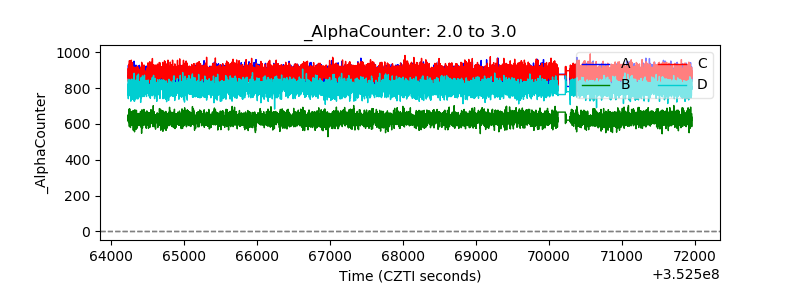 |
| _CPM_Rate | 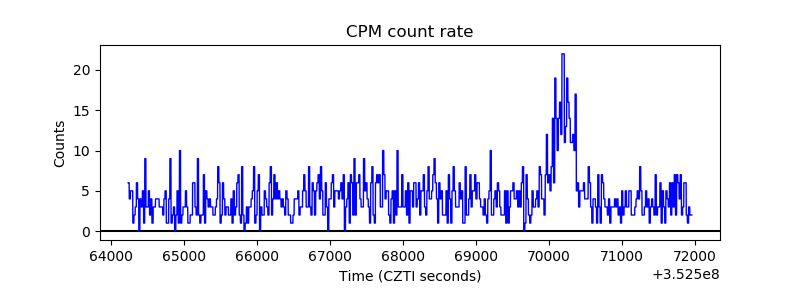 |
| CZT Counter |  |
| +2.5 Volts monitor |  |
| +5 Volts monitor |  |
| _ROLL_ROT |  |
| _Roll_DEC |  |
| _Roll_RA |  |
| Veto Counter |  |