| Param | Original file | Final file |
|---|---|---|
| Filename | modeM0/AS1A10_102T11_9000004220_29379cztM0_level2.evt | modeM0/AS1A10_102T11_9000004220_29379cztM0_level2_quad_clean.evt |
| Size (bytes) | 853,859,520 | 119,957,760 |
| Size | 814.3 MB | 114.4 MB |
| Events in quadrant A | 4,222,055 | 771,856 |
| Events in quadrant B | 4,399,410 | 785,584 |
| Events in quadrant C | 4,725,355 | 768,763 |
| Events in quadrant D | 11,904,228 | 681,756 |
| Mode M0 | |||
|---|---|---|---|
| Quadrant | BADHDUFLAG | Total packets | Discarded packets |
| A | 0 | 18713 | 1 |
| B | 0 | 19207 | 1 |
| C | 0 | 19856 | 1 |
| D | 0 | 41652 | 1 |
| Mode SS | |||
|---|---|---|---|
| Quadrant | BADHDUFLAG | Total packets | Discarded packets |
| A | 0 | 184 | 0 |
| B | 0 | 184 | 0 |
| C | 0 | 184 | 0 |
| D | 0 | 184 | 0 |
| Mode M9 | |||
|---|---|---|---|
| Quadrant | BADHDUFLAG | Total packets | Discarded packets |
| A | 0 | 16 | 0 |
| B | 0 | 16 | 0 |
| C | 0 | 16 | 0 |
| D | 0 | 16 | 0 |
| Quadrant | Total seconds | Saturated seconds | Saturation percentage |
|---|---|---|---|
| A | 8999 | 35 | 0.388932% |
| B | 8999 | 79 | 0.877875% |
| C | 8999 | 225 | 2.500278% |
| D | 9000 | 2342 | 26.022222% |
Noise dominated data is calculated using 1-second bins in cleaned event files. If a bin has >2000 counts, and if more than 50% of those come from <1% of pixels, then it is considered to be noise-dominated and hence unusable.
| Quadrant | # 1 sec bins | Bins with >0 counts | Bins with >2000 counts | High rate bins dominated by noise | Noise dominated (total time) | Noise dominated (detector-on time) | Marked lightcurve |
|---|---|---|---|---|---|---|---|
| A | 9804 | 9000 | 20 | 20 | 0.20% | 0.22% | 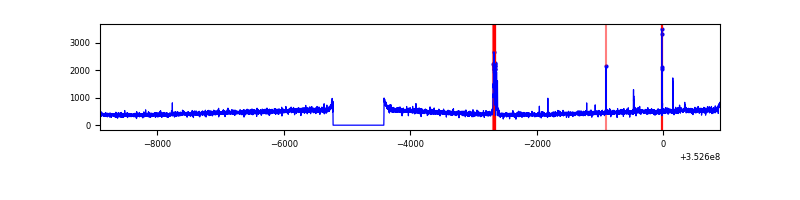 |
| B | 9804 | 9000 | 6 | 6 | 0.06% | 0.07% | 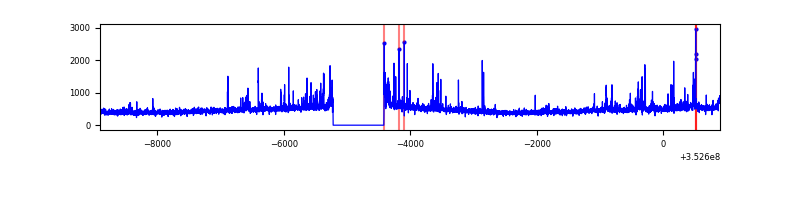 |
| C | 9804 | 9000 | 24 | 24 | 0.24% | 0.27% | 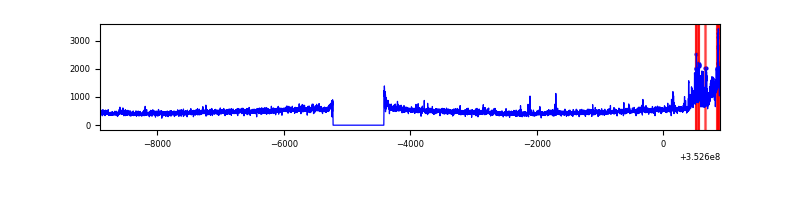 |
| D | 9805 | 9001 | 2079 | 2079 | 21.20% | 23.10% | 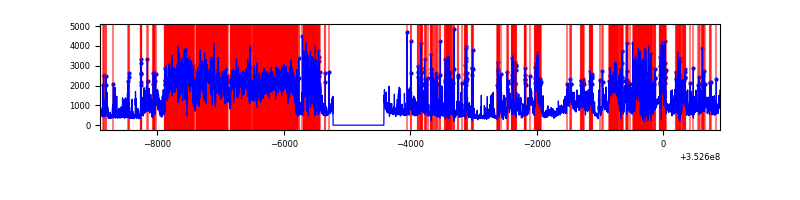 |
Top three noisy pixels from each quadrant. If the there are fewer than three noisy pixels in the level2.evt file, extra rows are filled as -1
| Pixel properties | Quadrant properties | ||||||
|---|---|---|---|---|---|---|---|
| Quadrant | DetID | PixID | Counts | Sigma | Mean | Median | Sigma |
| A | 15 | 174 | 118707 | 551.82 | 1060 | 1037 | 213.2 |
| A | 13 | 254 | 17712 | 78.2 | 1060 | 1037 | 213.2 |
| A | 3 | 137 | 10539 | 44.56 | 1060 | 1037 | 213.2 |
| B | 5 | 255 | 131985 | 653.94 | 1051 | 1026 | 200.3 |
| B | 0 | 229 | 76165 | 375.21 | 1051 | 1026 | 200.3 |
| B | 0 | 190 | 32251 | 155.92 | 1051 | 1026 | 200.3 |
| C | 10 | 9 | 360304 | 1517.35 | 1014 | 1018 | 236.8 |
| C | 3 | 233 | 210342 | 884.02 | 1014 | 1018 | 236.8 |
| C | 14 | 238 | 168097 | 705.61 | 1014 | 1018 | 236.8 |
| D | 12 | 33 | 5769305 | 25609.86 | 942 | 915 | 225.2 |
| D | 1 | 52 | 1712681 | 7599.71 | 942 | 915 | 225.2 |
| D | 8 | 195 | 332721 | 1473.12 | 942 | 915 | 225.2 |
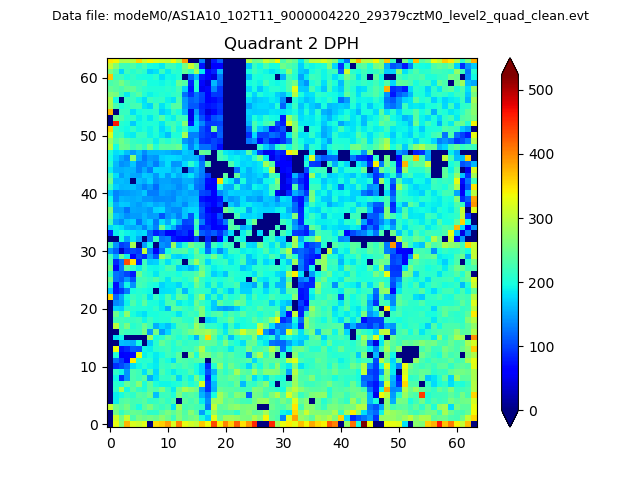
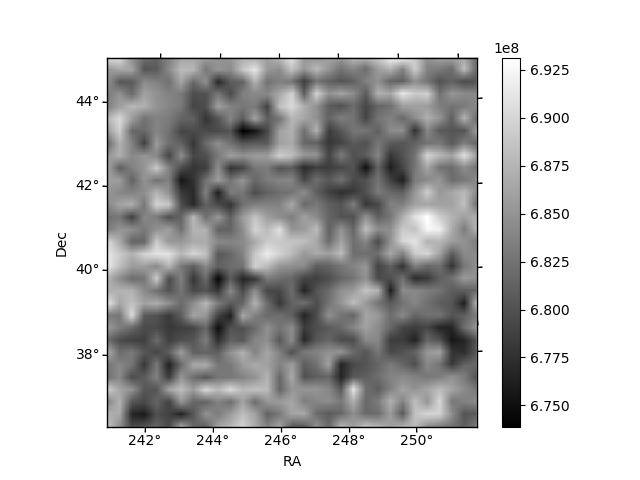
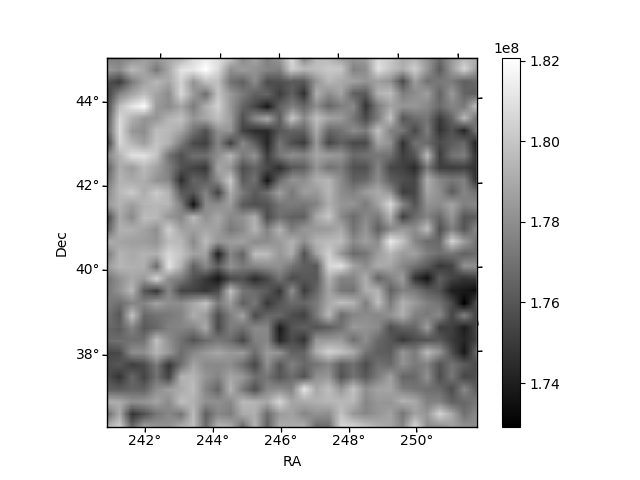
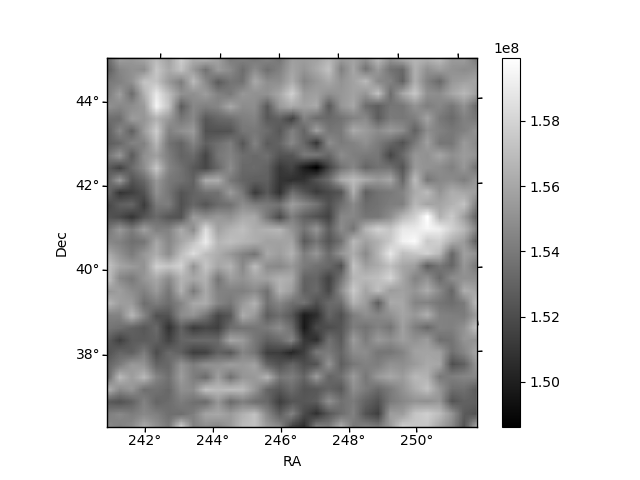
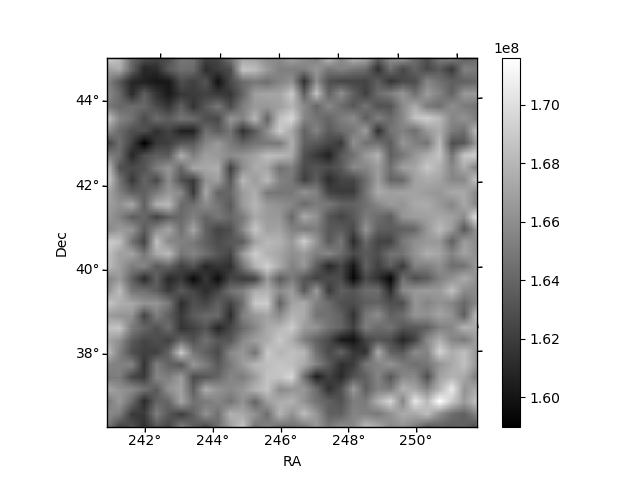
Histogram calculated using DETX and DETY for each event in the final _common_clean file
| Quadrant A | 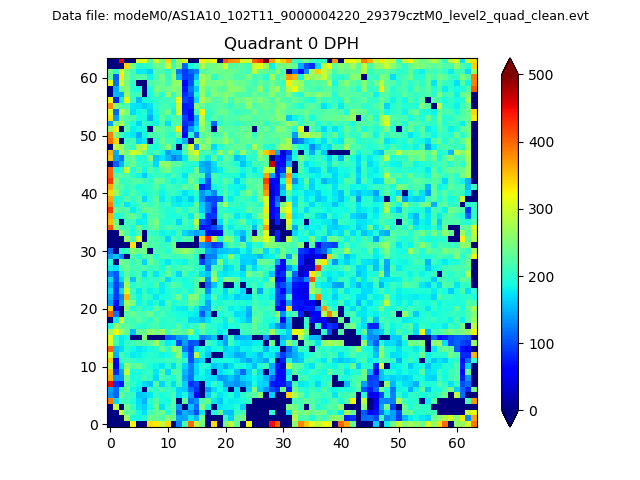 |
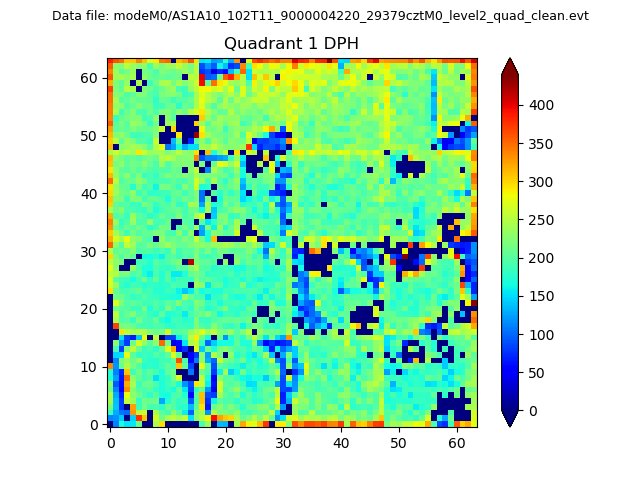 |
Quadrant B |
|---|---|---|---|
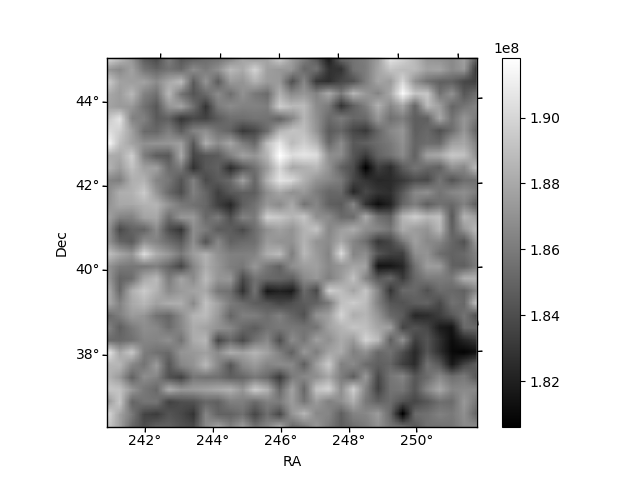
| Quadrant D | 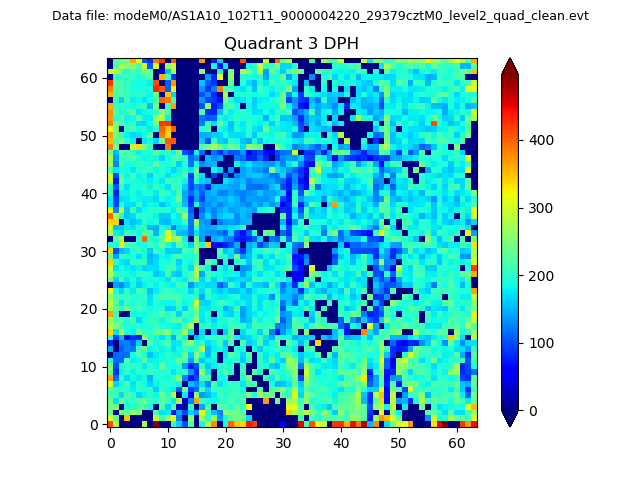 |
 |
Quadrant C |
| Plot type | Count rate plots | Images |
|---|---|---|
| Comparison with Poisson distribution Blue bars denote a histogram of data divided into 1 sec bins. Red curve is a Poisson curve with rate = median count rate of data. |
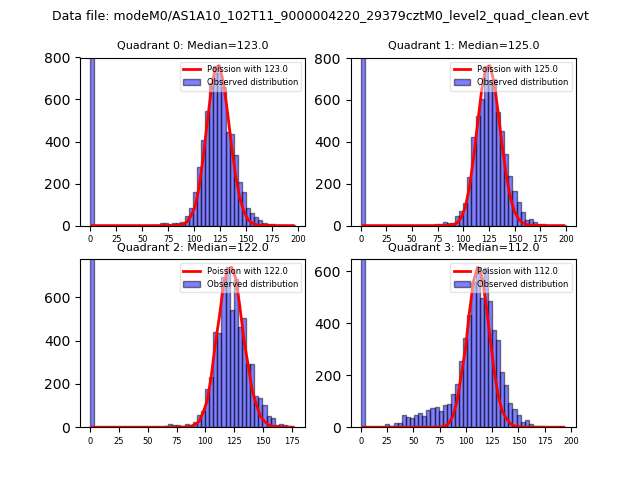 |
 |
| Quadrant-wise count rates Data is divided into 100 sec bins |
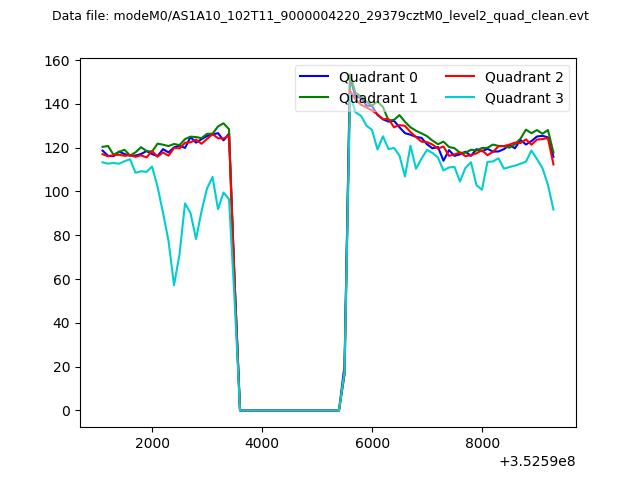 |
|
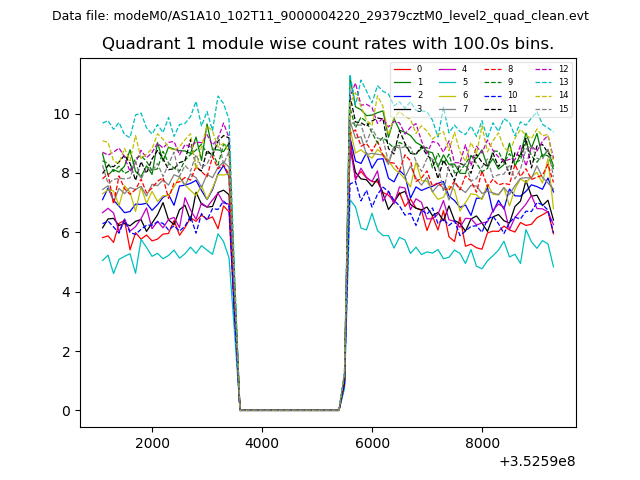
| Module-wise count rates for Quadrant A Data is divided into 100 sec bins |
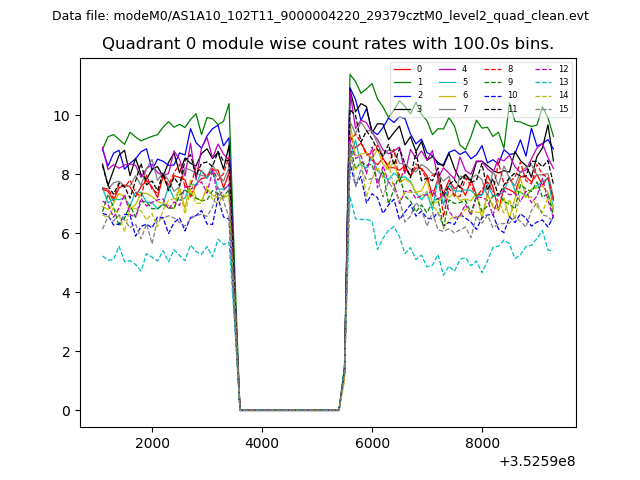 |
 |
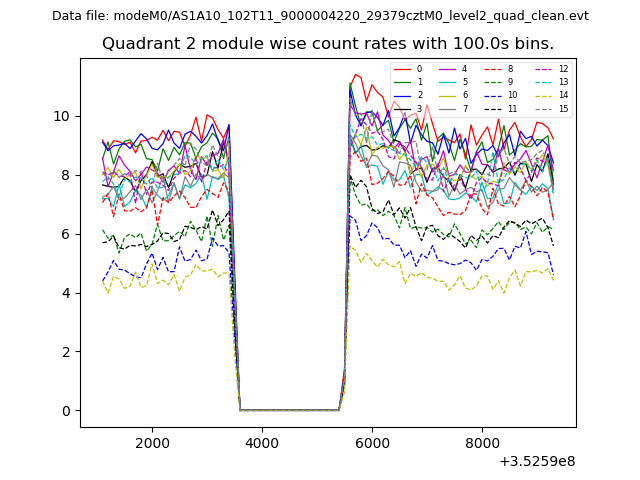
| Module-wise count rates for Quadrant B Data is divided into 100 sec bins |
 |
 |
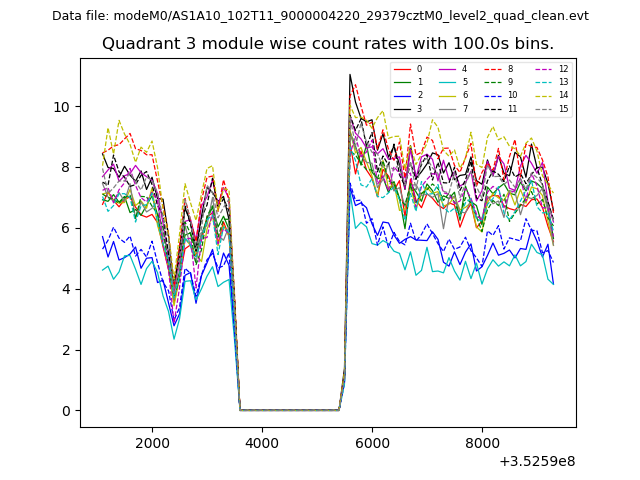
| Module-wise count rates for Quadrant C Data is divided into 100 sec bins |
 |
 |
| Module-wise count rates for Quadrant D Data is divided into 100 sec bins |
 |
 |
| Parameter | Plot |
|---|---|
| CZT HV Monitor | 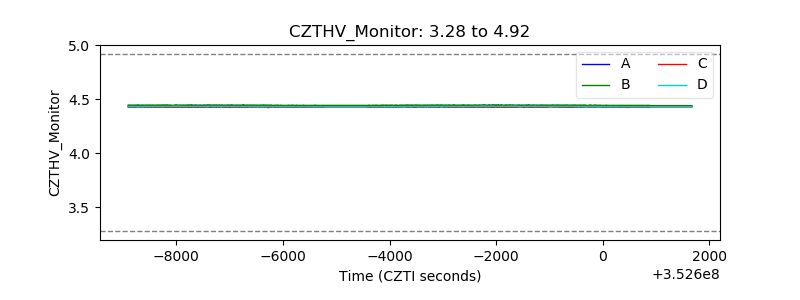 |
| D_VDD | 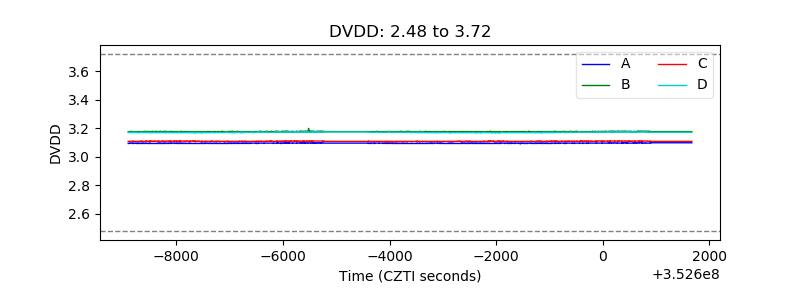 |
| Temperature 1 | 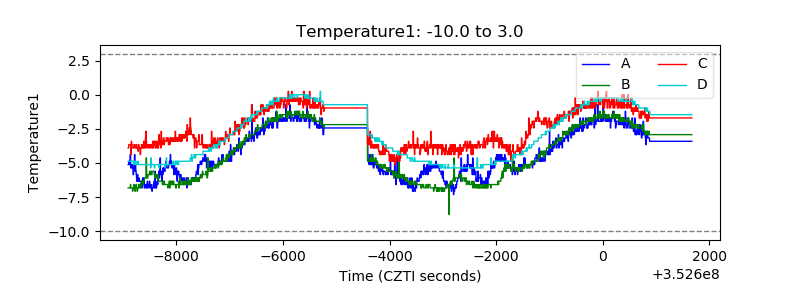 |
| Veto HV Monitor | 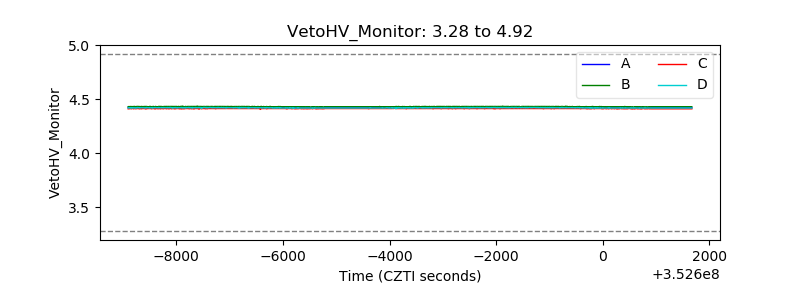 |
| Veto LLD |  |
| Alpha Counter | 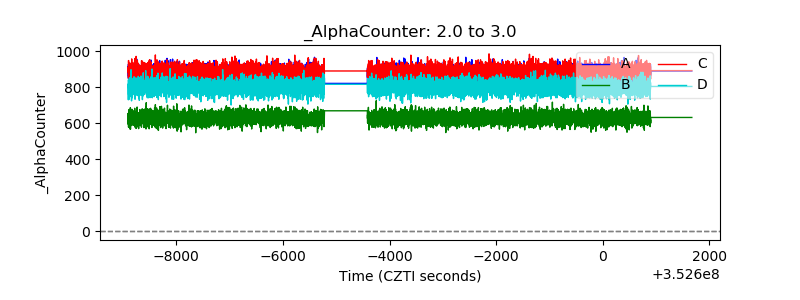 |
| _CPM_Rate |  |
| CZT Counter | 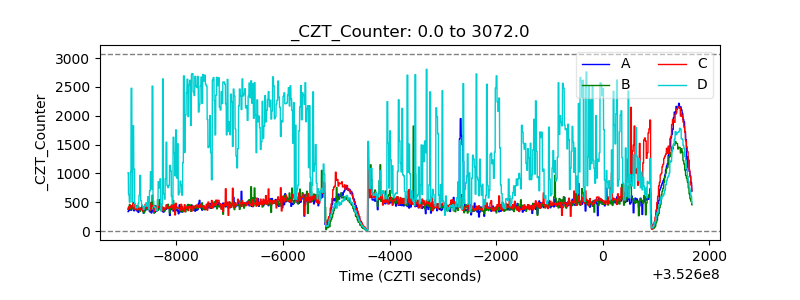 |
| +2.5 Volts monitor | 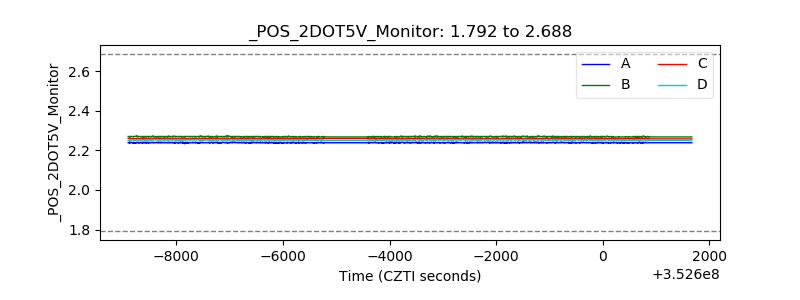 |
| +5 Volts monitor | 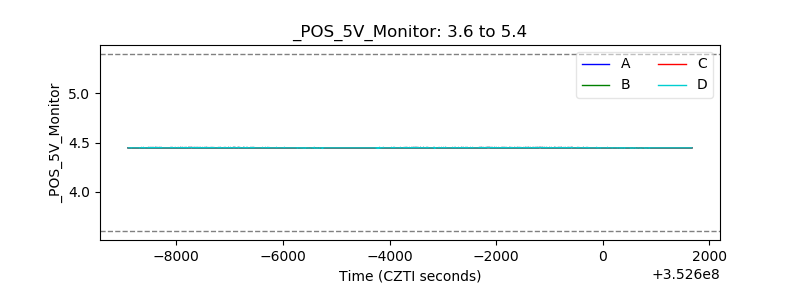 |
| _ROLL_ROT | 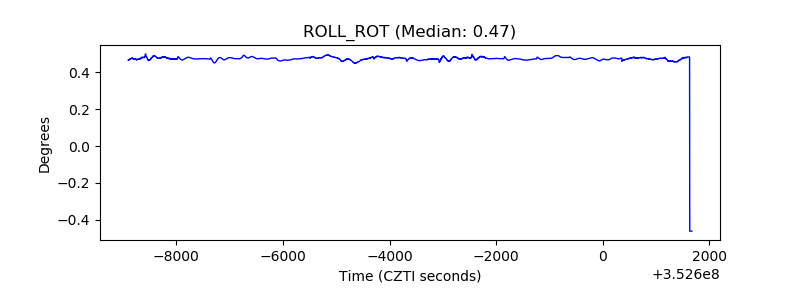 |
| _Roll_DEC | 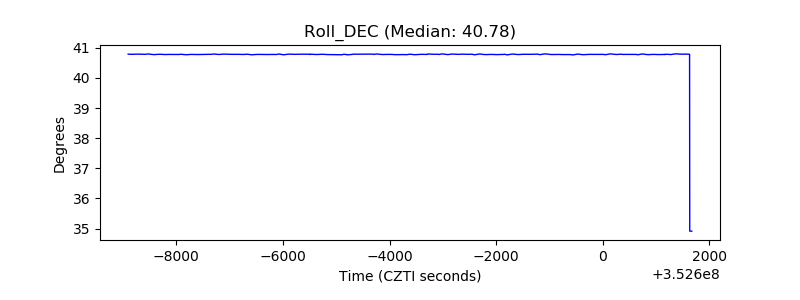 |
| _Roll_RA | 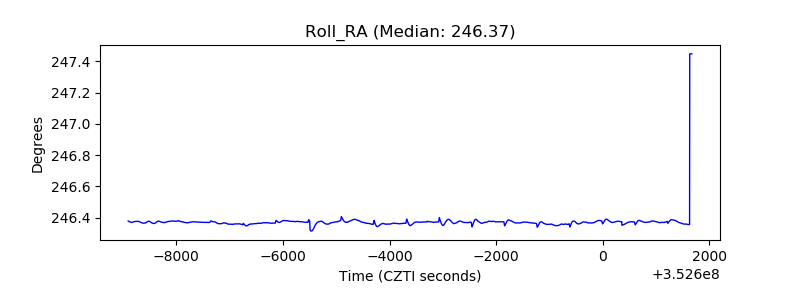 |
| Veto Counter | 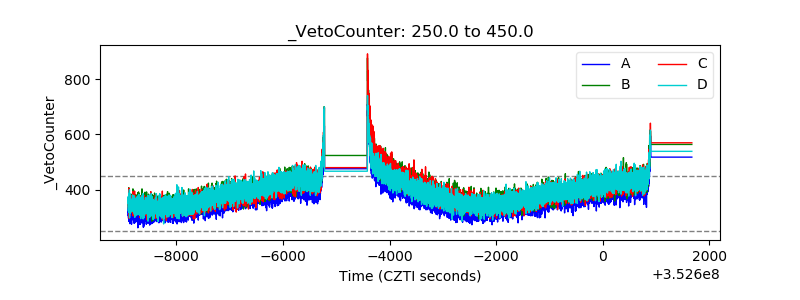 |