| Param | Original file | Final file |
|---|---|---|
| Filename | modeM0/AS1A10_101T19_9000004228cztM0_level2.fits | modeM0/AS1A10_101T19_9000004228cztM0_level2_quad_clean.evt |
| Size (bytes) | 448,447,680 | 449,579,520 |
| Size | 427.7 MB | 428.8 MB |
| Events in quadrant A | 2,847,422 | 2,855,759 |
| Events in quadrant B | 2,752,952 | 2,919,187 |
| Events in quadrant C | 2,776,121 | 2,801,429 |
| Events in quadrant D | 1,894,988 | 1,740,492 |
| Mode SS | |||
|---|---|---|---|
| Quadrant | BADHDUFLAG | Total packets | Discarded packets |
| A | 0 | 980 | 0 |
| B | 0 | 980 | 0 |
| C | 0 | 983 | 0 |
| D | 0 | 980 | 0 |
| Mode M9 | |||
|---|---|---|---|
| Quadrant | BADHDUFLAG | Total packets | Discarded packets |
| A | 0 | 125 | 0 |
| B | 0 | 125 | 0 |
| C | 0 | 125 | 0 |
| D | 0 | 125 | 0 |
| Mode M0 | |||
|---|---|---|---|
| Quadrant | BADHDUFLAG | Total packets | Discarded packets |
| A | 0 | 114373 | 0 |
| B | 0 | 102868 | 0 |
| C | 0 | 114964 | 0 |
| D | 0 | 293376 | 0 |
| Quadrant | Total seconds | Saturated seconds | Saturation percentage |
|---|---|---|---|
| A | 48054 | 1423 | 2.961252% |
| B | 48044 | 757 | 1.575639% |
| C | 48044 | 1708 | 3.555075% |
| D | 48046 | 23157 | 48.197561% |
Noise dominated data is calculated using 1-second bins in cleaned event files. If a bin has >2000 counts, and if more than 50% of those come from <1% of pixels, then it is considered to be noise-dominated and hence unusable.
| Quadrant | # 1 sec bins | Bins with >0 counts | Bins with >2000 counts | High rate bins dominated by noise | Noise dominated (total time) | Noise dominated (detector-on time) | Marked lightcurve |
|---|---|---|---|---|---|---|---|
| A | 53624 | 48106 | 0 | 0 | 0.00% | 0.00% |  |
| B | 53624 | 48099 | 0 | 0 | 0.00% | 0.00% |  |
| C | 53623 | 48091 | 0 | 0 | 0.00% | 0.00% |  |
| D | 53623 | 48030 | 0 | 0 | 0.00% | 0.00% |  |
Top three noisy pixels from each quadrant. If the there are fewer than three noisy pixels in the level2.evt file, extra rows are filled as -1
| Pixel properties | Quadrant properties | ||||||
|---|---|---|---|---|---|---|---|
| Quadrant | DetID | PixID | Counts | Sigma | Mean | Median | Sigma |
| A | 0 | 29 | 2773 | 11.27 | 741 | 692 | 184.6 |
| A | 7 | 110 | 2210 | 8.22 | 741 | 692 | 184.6 |
| A | 0 | 30 | 2104 | 7.65 | 741 | 692 | 184.6 |
| B | 2 | 9 | 2234 | 10.48 | 727 | 690 | 147.3 |
| B | 2 | 8 | 1831 | 7.75 | 727 | 690 | 147.3 |
| B | 5 | 128 | 1813 | 7.62 | 727 | 690 | 147.3 |
| C | 1 | 81 | 2208 | 8.07 | 732 | 682 | 189.1 |
| C | 1 | 80 | 2138 | 7.7 | 732 | 682 | 189.1 |
| C | 9 | 209 | 1939 | 6.65 | 732 | 682 | 189.1 |
| D | 15 | 46 | 1476 | 6.68 | 541 | 492 | 147.3 |
| D | 10 | 189 | 1390 | 6.1 | 541 | 492 | 147.3 |
| D | 6 | 67 | 1381 | 6.04 | 541 | 492 | 147.3 |
Histogram calculated using DETX and DETY for each event in the final _common_clean file
| Quadrant A | 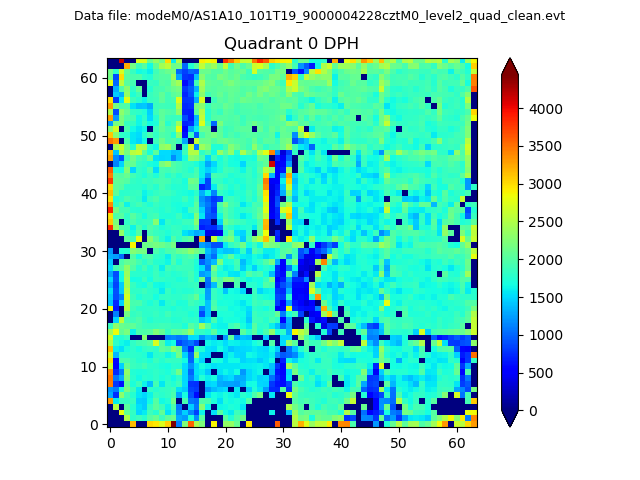 |
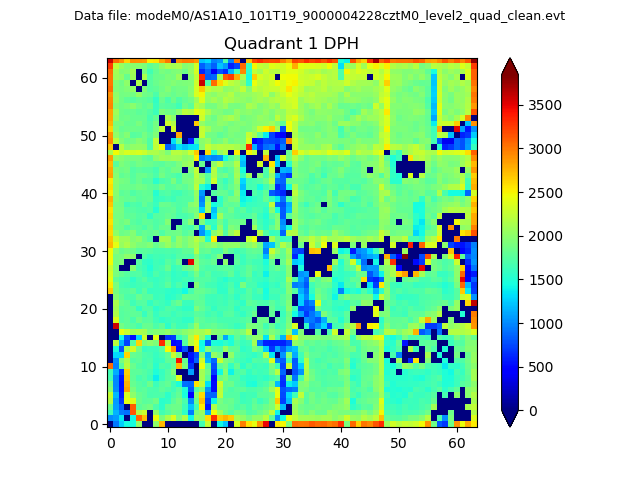 |
Quadrant B |
|---|---|---|---|
| Quadrant D | 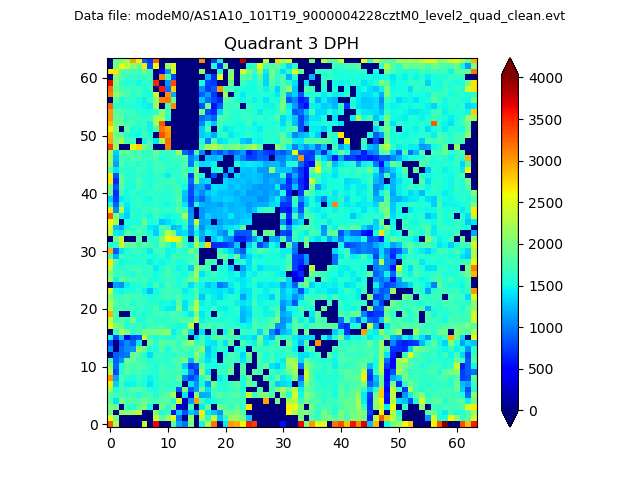 |
 |
Quadrant C |
| Plot type | Count rate plots | Images |
|---|---|---|
| Comparison with Poisson distribution Blue bars denote a histogram of data divided into 1 sec bins. Red curve is a Poisson curve with rate = median count rate of data. |
 |
 |
| Quadrant-wise count rates Data is divided into 100 sec bins |
 |
|
| Module-wise count rates for Quadrant A Data is divided into 100 sec bins |
 |
 |
| Module-wise count rates for Quadrant B Data is divided into 100 sec bins |
 |
 |
| Module-wise count rates for Quadrant C Data is divided into 100 sec bins |
 |
 |
| Module-wise count rates for Quadrant D Data is divided into 100 sec bins |
 |
 |
| Parameter | Plot |
|---|---|
| CZT HV Monitor |  |
| D_VDD | 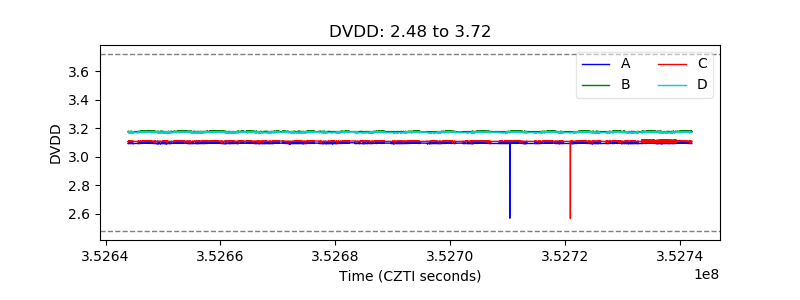 |
| Temperature 1 |  |
| Veto HV Monitor | 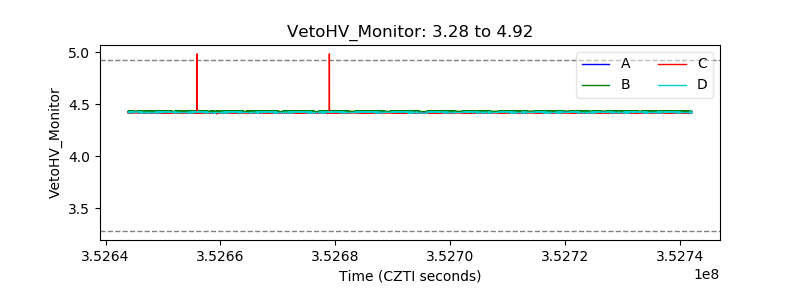 |
| Veto LLD |  |
| Alpha Counter |  |
| _CPM_Rate |  |
| CZT Counter |  |
| +2.5 Volts monitor |  |
| +5 Volts monitor |  |
| _ROLL_ROT |  |
| _Roll_DEC |  |
| _Roll_RA |  |
| Veto Counter |  |