| Param | Original file | Final file |
|---|---|---|
| Filename | modeM0/AS1A10_101T19_9000004228_29388cztM0_level2.evt | modeM0/AS1A10_101T19_9000004228_29388cztM0_level2_quad_clean.evt |
| Size (bytes) | 783,253,440 | 77,901,120 |
| Size | 747.0 MB | 74.3 MB |
| Events in quadrant A | 4,135,292 | 469,060 |
| Events in quadrant B | 3,898,931 | 478,584 |
| Events in quadrant C | 4,314,179 | 461,701 |
| Events in quadrant D | 10,864,059 | 425,706 |
| Mode SS | |||
|---|---|---|---|
| Quadrant | BADHDUFLAG | Total packets | Discarded packets |
| A | 0 | 152 | 0 |
| B | 0 | 152 | 0 |
| C | 0 | 152 | 0 |
| D | 0 | 152 | 0 |
| Mode M9 | |||
|---|---|---|---|
| Quadrant | BADHDUFLAG | Total packets | Discarded packets |
| A | 0 | 3 | 0 |
| B | 0 | 3 | 0 |
| C | 0 | 3 | 0 |
| D | 0 | 3 | 0 |
| Mode M0 | |||
|---|---|---|---|
| Quadrant | BADHDUFLAG | Total packets | Discarded packets |
| A | 0 | 16943 | 3 |
| B | 0 | 16157 | 2 |
| C | 0 | 17417 | 2 |
| D | 0 | 37599 | 2 |
| Quadrant | Total seconds | Saturated seconds | Saturation percentage |
|---|---|---|---|
| A | 7524 | 160 | 2.126528% |
| B | 7524 | 133 | 1.767677% |
| C | 7524 | 313 | 4.160021% |
| D | 7524 | 2194 | 29.160021% |
Noise dominated data is calculated using 1-second bins in cleaned event files. If a bin has >2000 counts, and if more than 50% of those come from <1% of pixels, then it is considered to be noise-dominated and hence unusable.
| Quadrant | # 1 sec bins | Bins with >0 counts | Bins with >2000 counts | High rate bins dominated by noise | Noise dominated (total time) | Noise dominated (detector-on time) | Marked lightcurve |
|---|---|---|---|---|---|---|---|
| A | 7844 | 7525 | 30 | 30 | 0.38% | 0.40% | 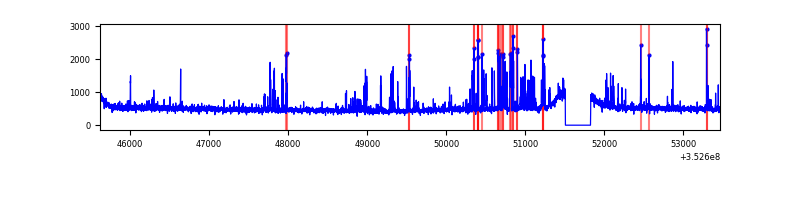 |
| B | 7844 | 7525 | 8 | 8 | 0.10% | 0.11% | 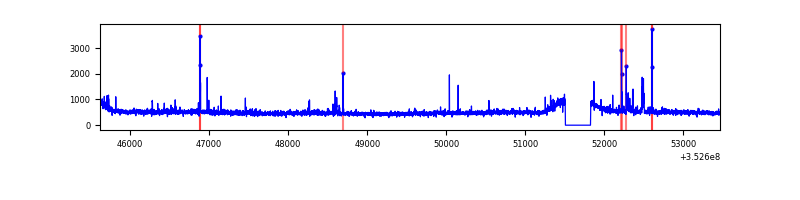 |
| C | 7844 | 7525 | 0 | 0 | 0.00% | 0.00% | 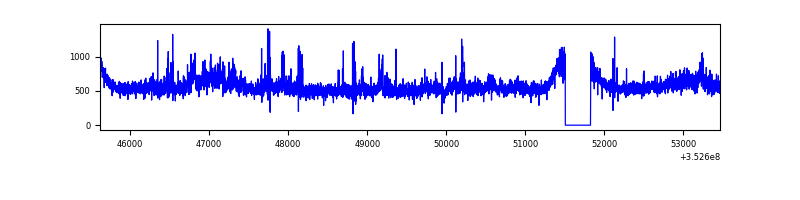 |
| D | 7844 | 7525 | 1718 | 1718 | 21.90% | 22.83% | 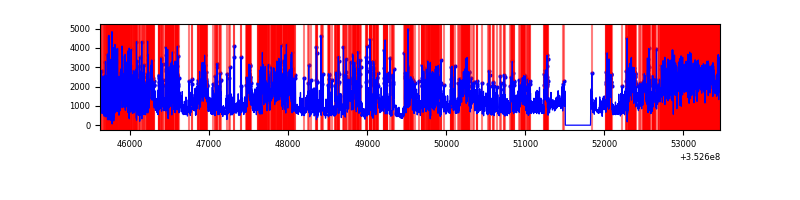 |
Top three noisy pixels from each quadrant. If the there are fewer than three noisy pixels in the level2.evt file, extra rows are filled as -1
| Pixel properties | Quadrant properties | ||||||
|---|---|---|---|---|---|---|---|
| Quadrant | DetID | PixID | Counts | Sigma | Mean | Median | Sigma |
| A | 1 | 113 | 413987 | 2121.32 | 962 | 940 | 194.7 |
| A | 13 | 254 | 14676 | 70.55 | 962 | 940 | 194.7 |
| A | 14 | 235 | 10037 | 46.72 | 962 | 940 | 194.7 |
| B | 0 | 229 | 66354 | 352.83 | 951 | 928 | 185.4 |
| B | 5 | 255 | 29400 | 153.55 | 951 | 928 | 185.4 |
| B | 12 | 111 | 22527 | 116.48 | 951 | 928 | 185.4 |
| C | 3 | 233 | 383485 | 1767.27 | 918 | 925 | 216.5 |
| C | 14 | 238 | 196130 | 901.76 | 918 | 925 | 216.5 |
| C | 14 | 254 | 72222 | 329.36 | 918 | 925 | 216.5 |
| D | 1 | 52 | 3549431 | 17568.19 | 843 | 821 | 202.0 |
| D | 12 | 33 | 3542404 | 17533.41 | 843 | 821 | 202.0 |
| D | 8 | 195 | 254954 | 1258.14 | 843 | 821 | 202.0 |
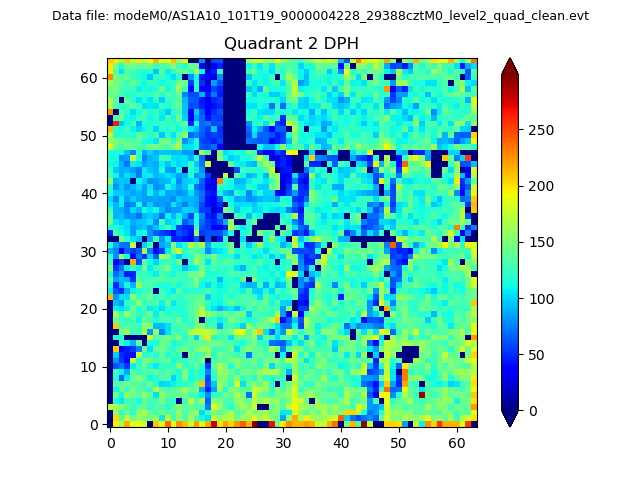
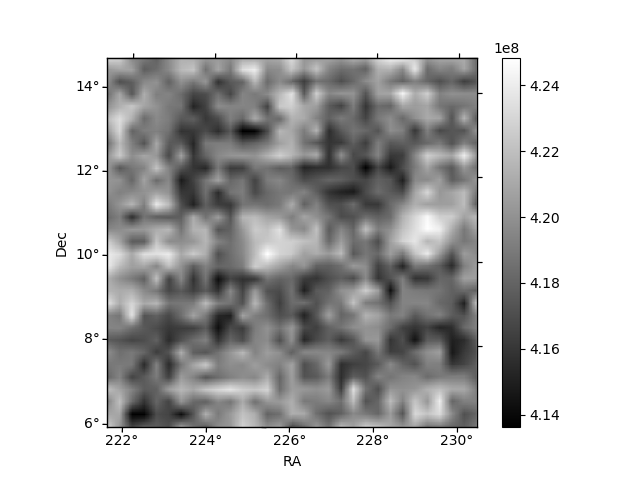
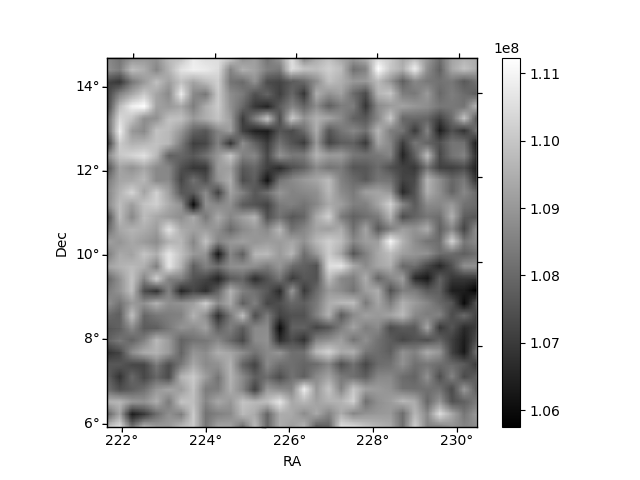
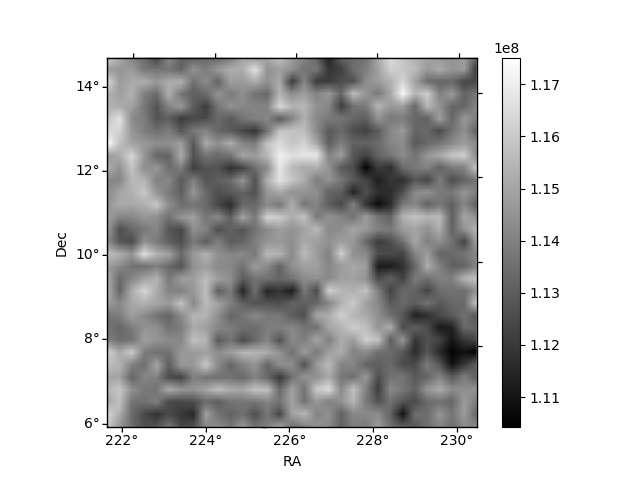
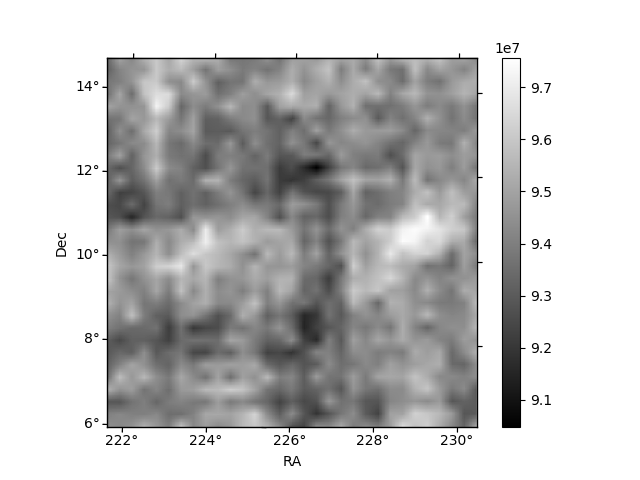
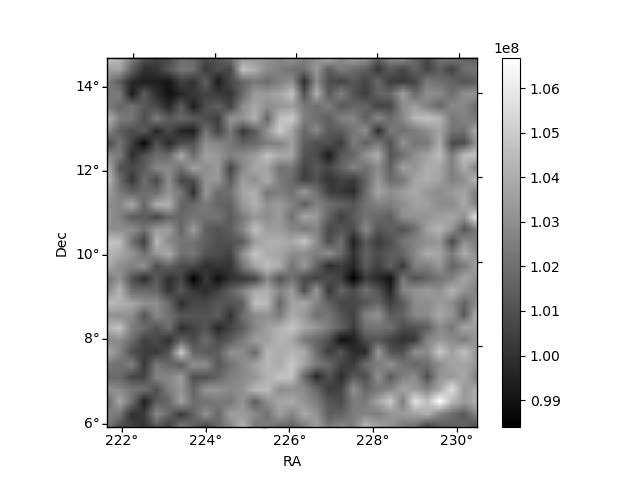
Histogram calculated using DETX and DETY for each event in the final _common_clean file
| Quadrant A | 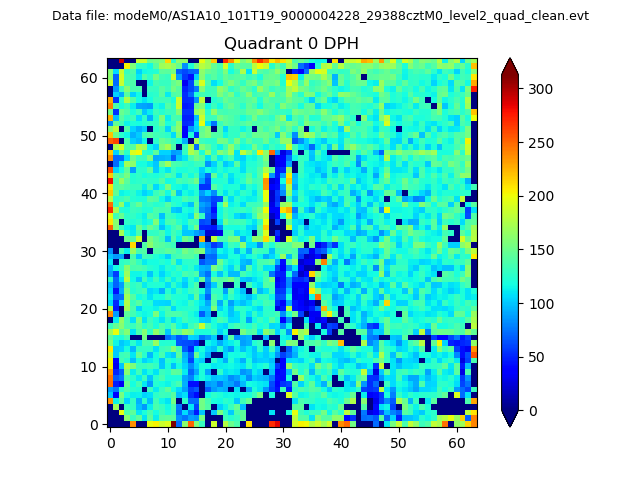 |
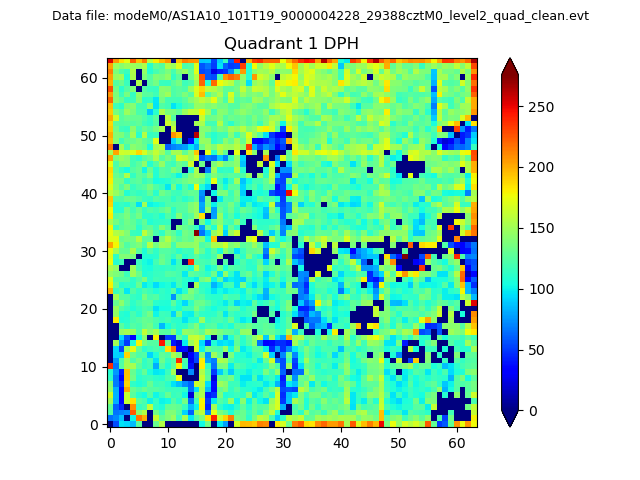 |
Quadrant B |
|---|---|---|---|
| Quadrant D | 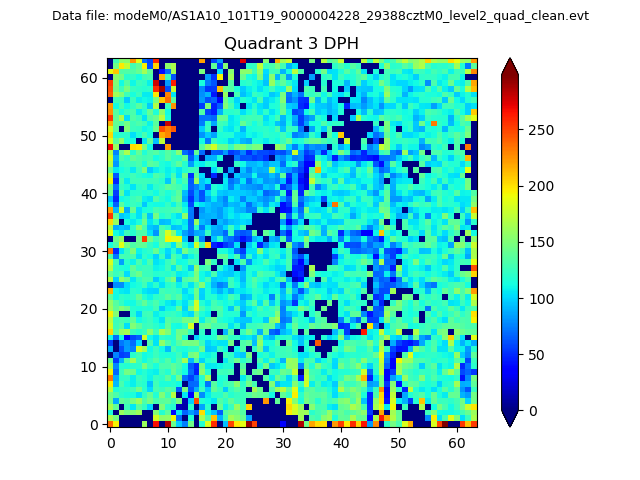 |
 |
Quadrant C |
| Plot type | Count rate plots | Images |
|---|---|---|
| Comparison with Poisson distribution Blue bars denote a histogram of data divided into 1 sec bins. Red curve is a Poisson curve with rate = median count rate of data. |
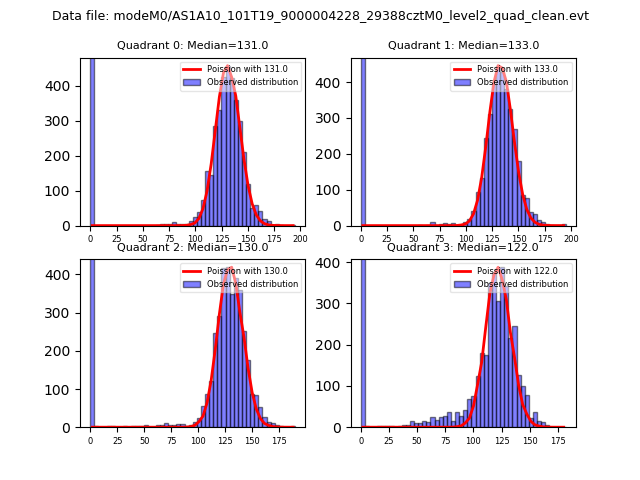 |
 |
| Quadrant-wise count rates Data is divided into 100 sec bins |
 |
|
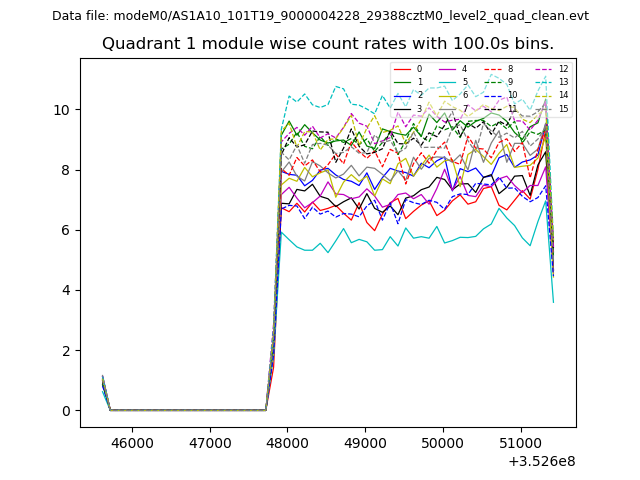
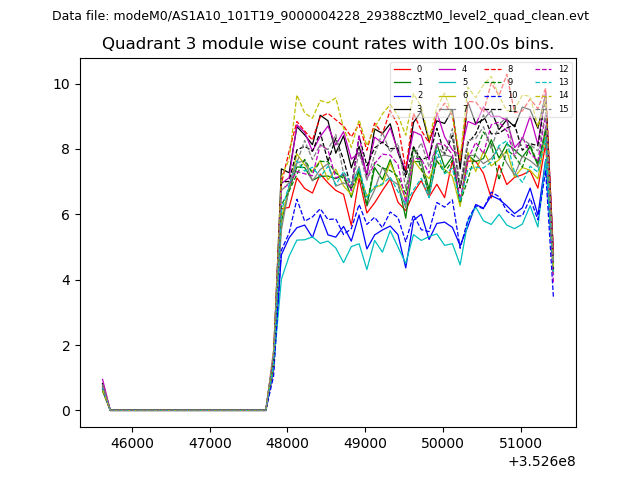
| Module-wise count rates for Quadrant A Data is divided into 100 sec bins |
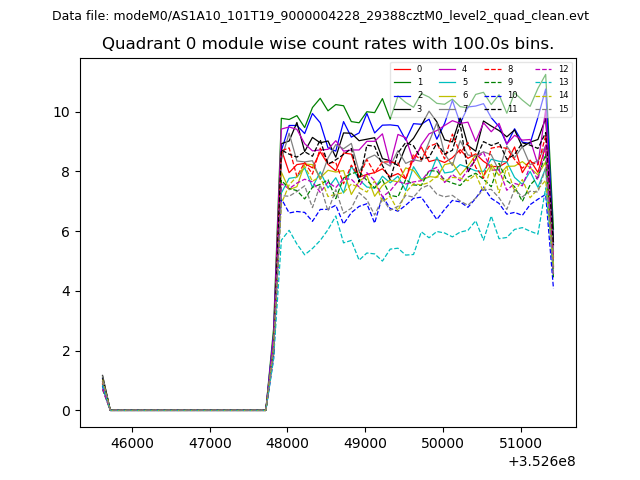 |
 |
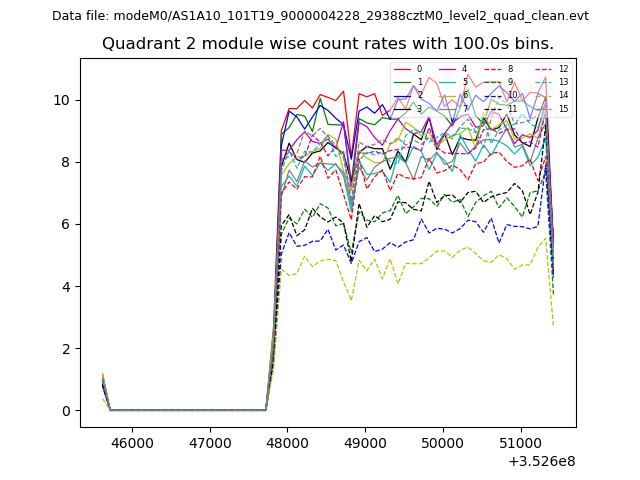
| Module-wise count rates for Quadrant B Data is divided into 100 sec bins |
 |
 |
| Module-wise count rates for Quadrant C Data is divided into 100 sec bins |
 |
 |
| Module-wise count rates for Quadrant D Data is divided into 100 sec bins |
 |
 |
| Parameter | Plot |
|---|---|
| CZT HV Monitor | 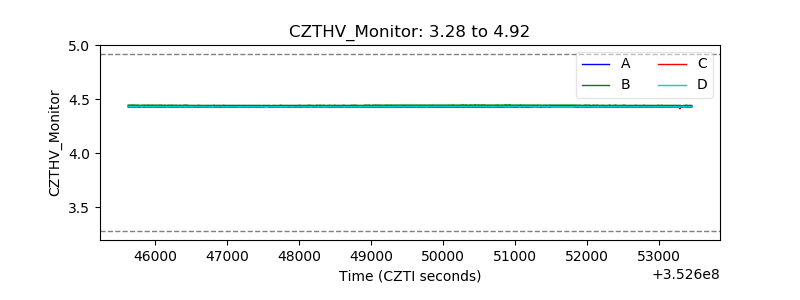 |
| D_VDD | 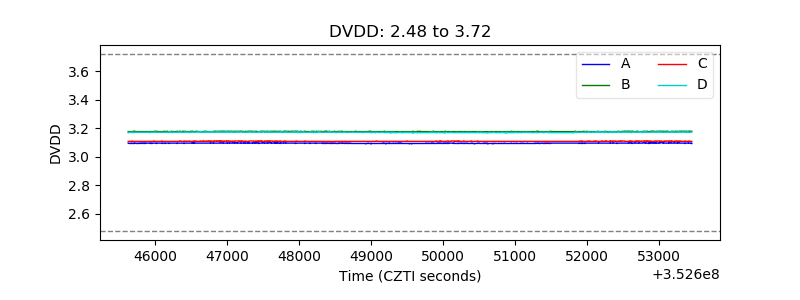 |
| Temperature 1 | 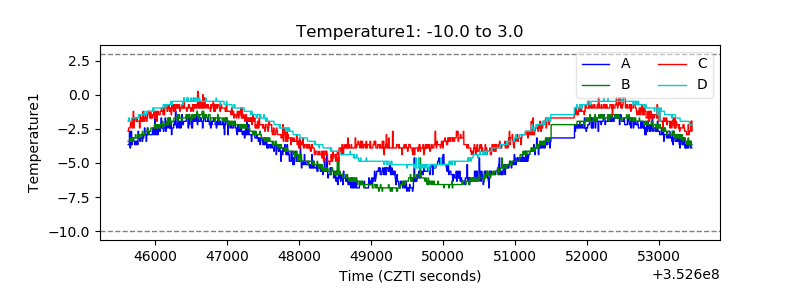 |
| Veto HV Monitor | 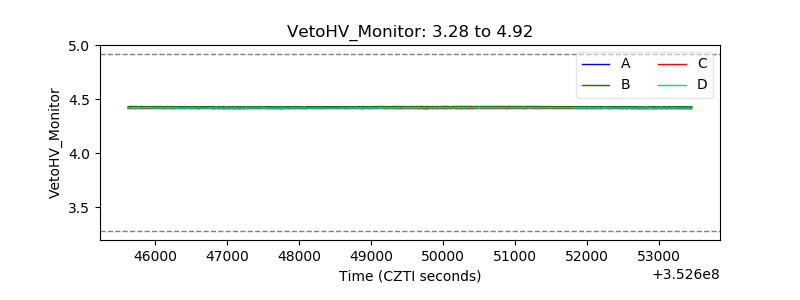 |
| Veto LLD | 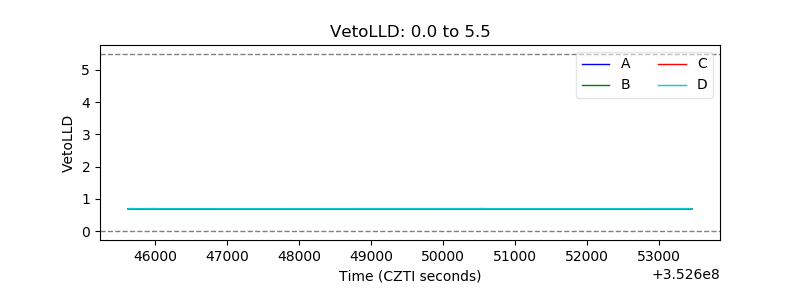 |
| Alpha Counter |  |
| _CPM_Rate | 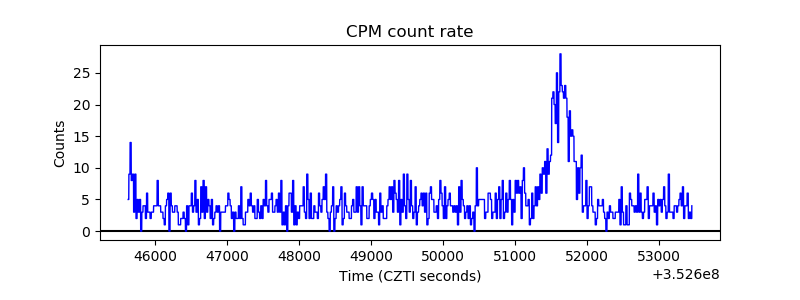 |
| CZT Counter | 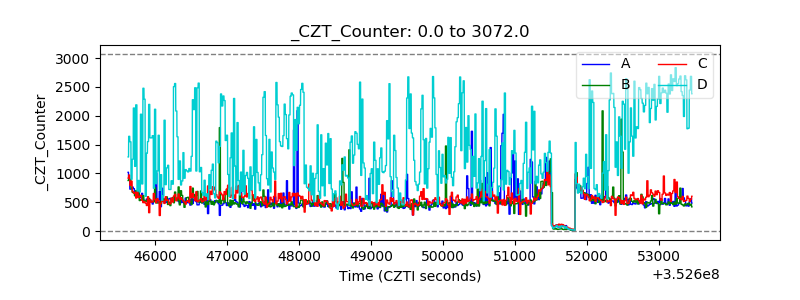 |
| +2.5 Volts monitor |  |
| +5 Volts monitor |  |
| _ROLL_ROT | 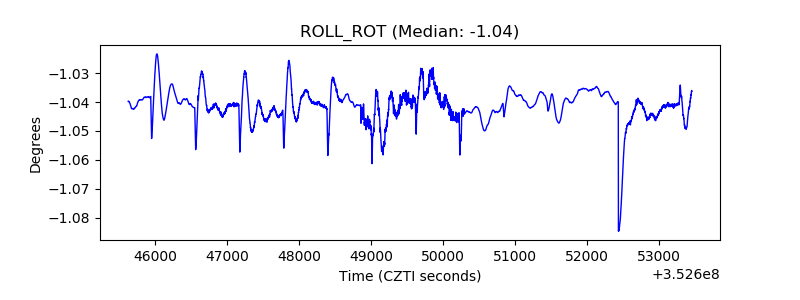 |
| _Roll_DEC |  |
| _Roll_RA | 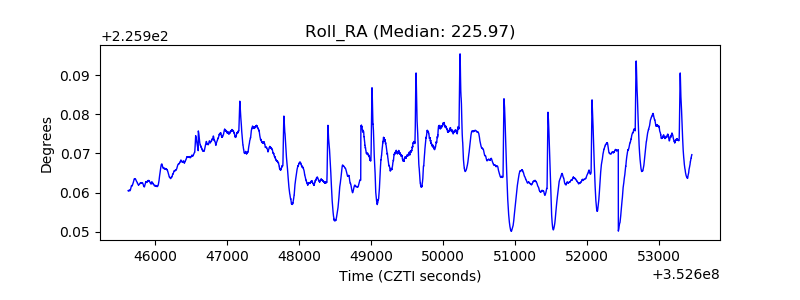 |
| Veto Counter | 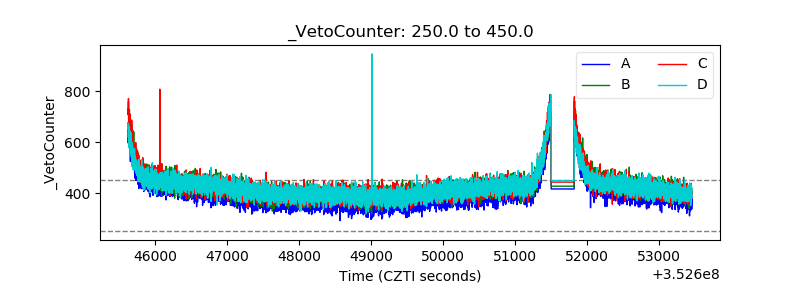 |