| Param | Original file | Final file |
|---|---|---|
| Filename | modeM0/AS1A10_101T19_9000004228_29389cztM0_level2.evt | modeM0/AS1A10_101T19_9000004228_29389cztM0_level2_quad_clean.evt |
| Size (bytes) | 964,275,840 | 79,056,000 |
| Size | 919.6 MB | 75.4 MB |
| Events in quadrant A | 4,423,165 | 486,021 |
| Events in quadrant B | 4,069,187 | 497,584 |
| Events in quadrant C | 4,811,851 | 482,885 |
| Events in quadrant D | 15,373,071 | 384,754 |
| Mode SS | |||
|---|---|---|---|
| Quadrant | BADHDUFLAG | Total packets | Discarded packets |
| A | 0 | 160 | 0 |
| B | 0 | 160 | 0 |
| C | 0 | 160 | 0 |
| D | 0 | 160 | 0 |
| Mode M9 | |||
|---|---|---|---|
| Quadrant | BADHDUFLAG | Total packets | Discarded packets |
| A | 0 | 5 | 0 |
| B | 0 | 5 | 0 |
| C | 0 | 5 | 0 |
| D | 0 | 5 | 0 |
| Mode M0 | |||
|---|---|---|---|
| Quadrant | BADHDUFLAG | Total packets | Discarded packets |
| A | 0 | 18045 | 2 |
| B | 0 | 16933 | 2 |
| C | 0 | 19463 | 2 |
| D | 0 | 51050 | 2 |
| Quadrant | Total seconds | Saturated seconds | Saturation percentage |
|---|---|---|---|
| A | 7790 | 241 | 3.093710% |
| B | 7790 | 214 | 2.747112% |
| C | 7791 | 356 | 4.569375% |
| D | 7791 | 4703 | 60.364523% |
Noise dominated data is calculated using 1-second bins in cleaned event files. If a bin has >2000 counts, and if more than 50% of those come from <1% of pixels, then it is considered to be noise-dominated and hence unusable.
| Quadrant | # 1 sec bins | Bins with >0 counts | Bins with >2000 counts | High rate bins dominated by noise | Noise dominated (total time) | Noise dominated (detector-on time) | Marked lightcurve |
|---|---|---|---|---|---|---|---|
| A | 8325 | 7792 | 51 | 51 | 0.61% | 0.65% | 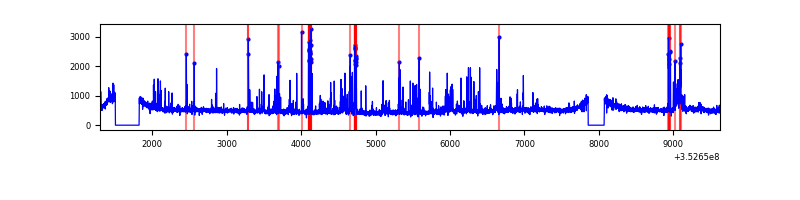 |
| B | 8325 | 7792 | 9 | 9 | 0.11% | 0.12% | 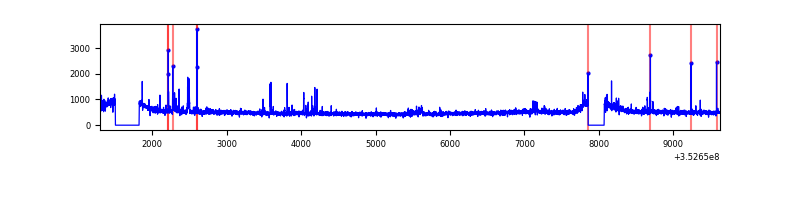 |
| C | 8326 | 7793 | 5 | 5 | 0.06% | 0.06% | 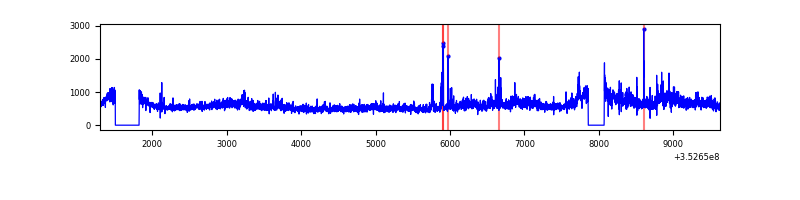 |
| D | 8326 | 7793 | 4416 | 4416 | 53.04% | 56.67% | 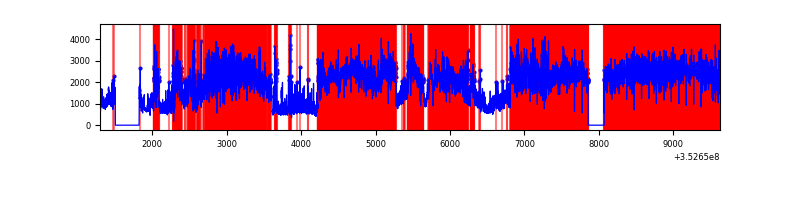 |
Top three noisy pixels from each quadrant. If the there are fewer than three noisy pixels in the level2.evt file, extra rows are filled as -1
| Pixel properties | Quadrant properties | ||||||
|---|---|---|---|---|---|---|---|
| Quadrant | DetID | PixID | Counts | Sigma | Mean | Median | Sigma |
| A | 1 | 113 | 515589 | 2528.7 | 1002 | 979 | 203.5 |
| A | 14 | 235 | 24143 | 113.82 | 1002 | 979 | 203.5 |
| A | 13 | 170 | 19224 | 89.65 | 1002 | 979 | 203.5 |
| B | 0 | 229 | 63502 | 328.08 | 992 | 967 | 190.6 |
| B | 0 | 190 | 25967 | 131.16 | 992 | 967 | 190.6 |
| B | 5 | 255 | 25852 | 130.56 | 992 | 967 | 190.6 |
| C | 3 | 233 | 669504 | 2953.65 | 958 | 965 | 226.3 |
| C | 10 | 9 | 178907 | 786.16 | 958 | 965 | 226.3 |
| C | 14 | 238 | 159667 | 701.16 | 958 | 965 | 226.3 |
| D | 12 | 33 | 5765259 | 33712.45 | 718 | 700 | 171.0 |
| D | 8 | 195 | 4467151 | 26120.82 | 718 | 700 | 171.0 |
| D | 1 | 52 | 1991381 | 11641.96 | 718 | 700 | 171.0 |
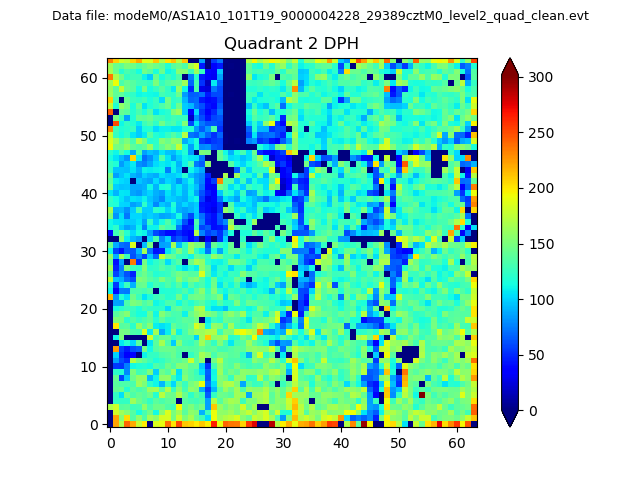
Histogram calculated using DETX and DETY for each event in the final _common_clean file
| Quadrant A | 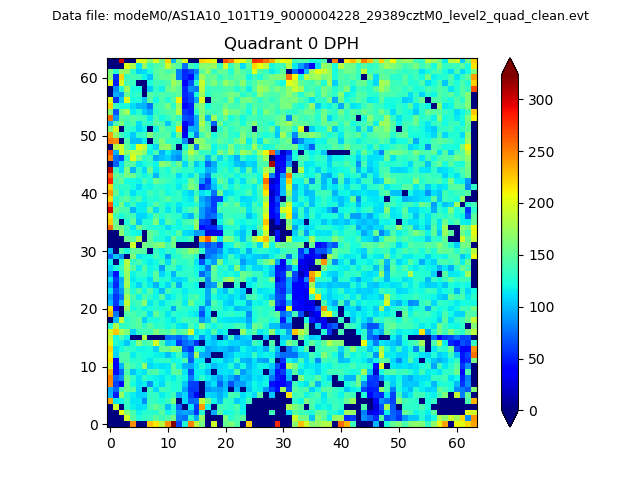 |
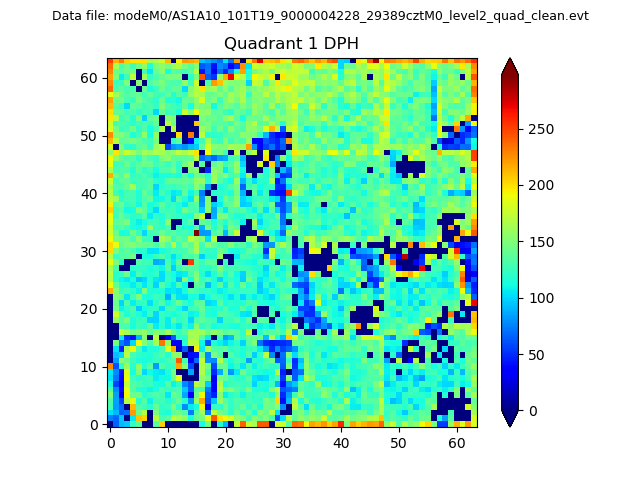 |
Quadrant B |
|---|---|---|---|
| Quadrant D | 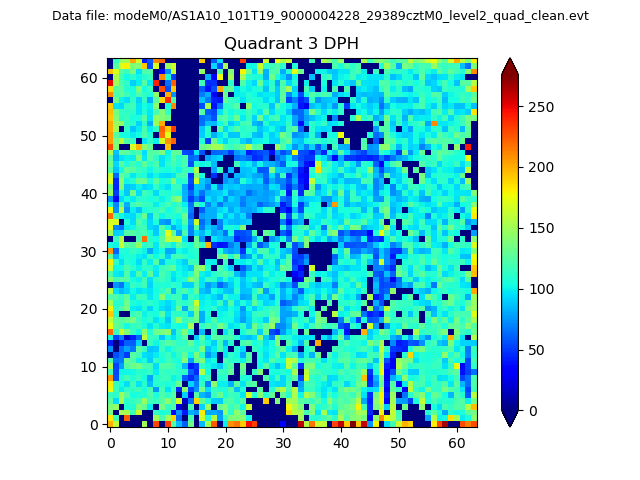 |
 |
Quadrant C |
| Plot type | Count rate plots | Images |
|---|---|---|
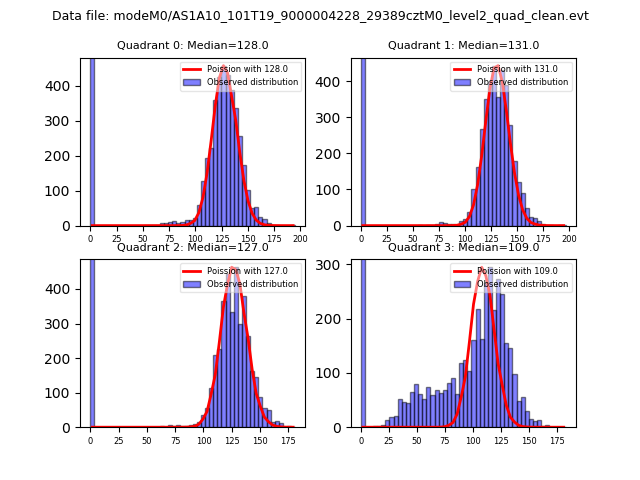
| Comparison with Poisson distribution Blue bars denote a histogram of data divided into 1 sec bins. Red curve is a Poisson curve with rate = median count rate of data. |
 |
 |
| Quadrant-wise count rates Data is divided into 100 sec bins |
 |
|
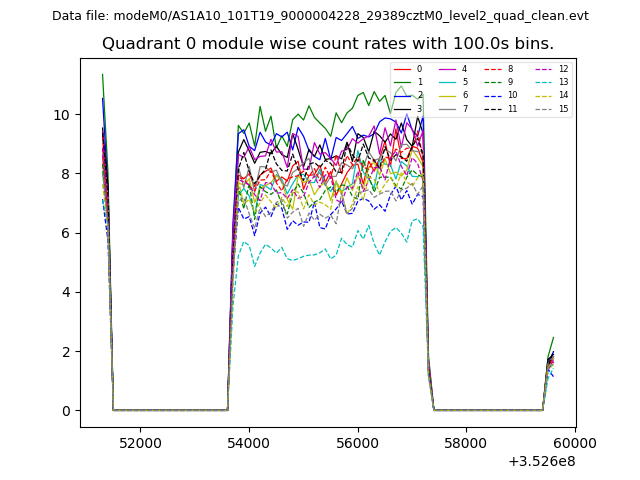
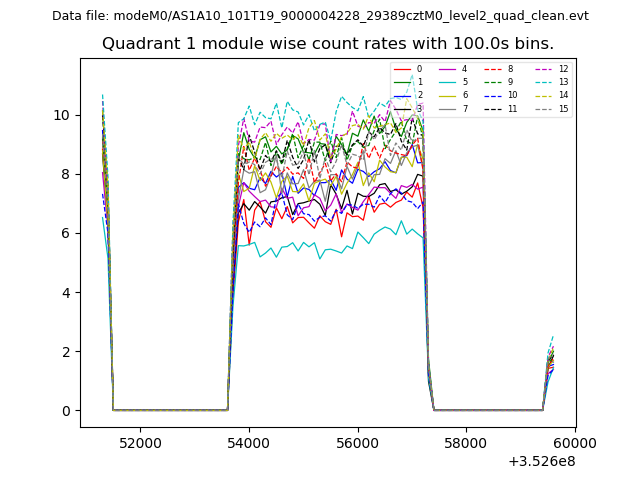
| Module-wise count rates for Quadrant A Data is divided into 100 sec bins |
 |
 |
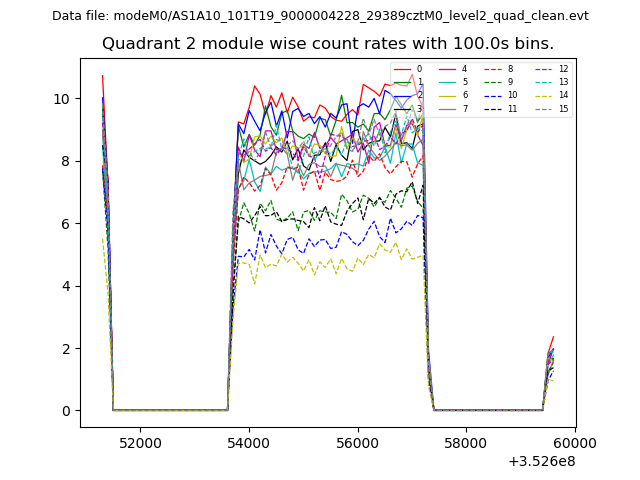
| Module-wise count rates for Quadrant B Data is divided into 100 sec bins |
 |
 |
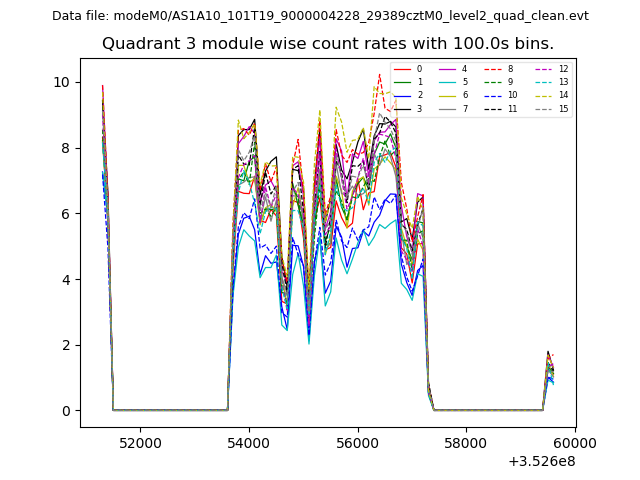
| Module-wise count rates for Quadrant C Data is divided into 100 sec bins |
 |
 |
| Module-wise count rates for Quadrant D Data is divided into 100 sec bins |
 |
 |
| Parameter | Plot |
|---|---|
| CZT HV Monitor | 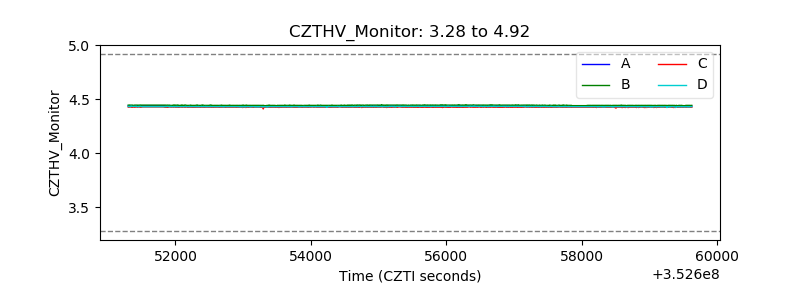 |
| D_VDD | 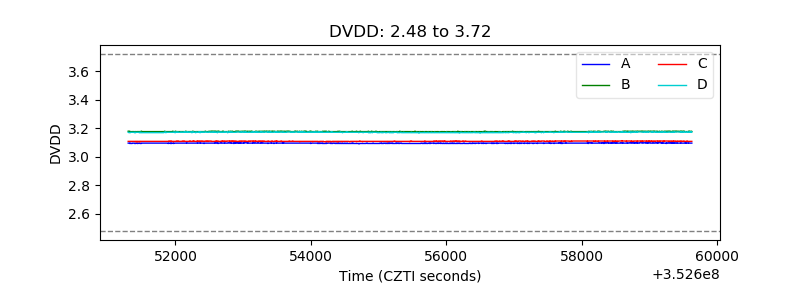 |
| Temperature 1 | 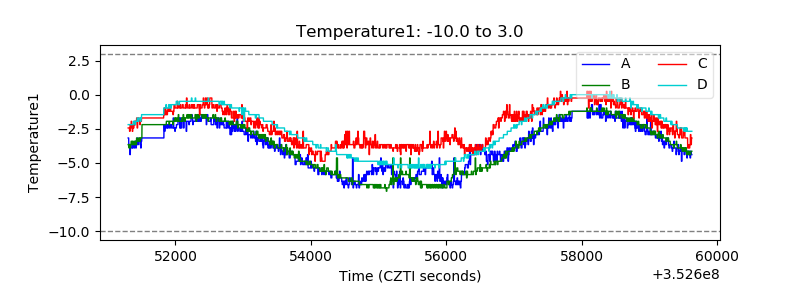 |
| Veto HV Monitor | 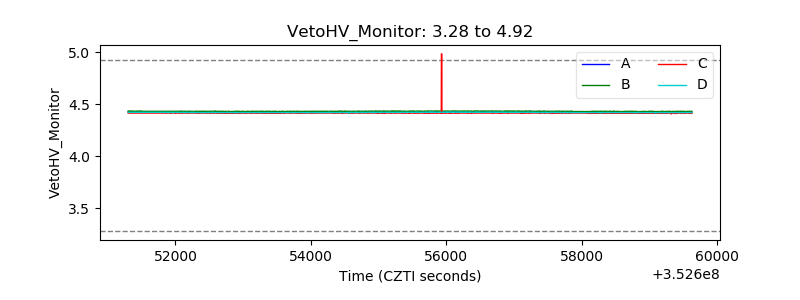 |
| Veto LLD | 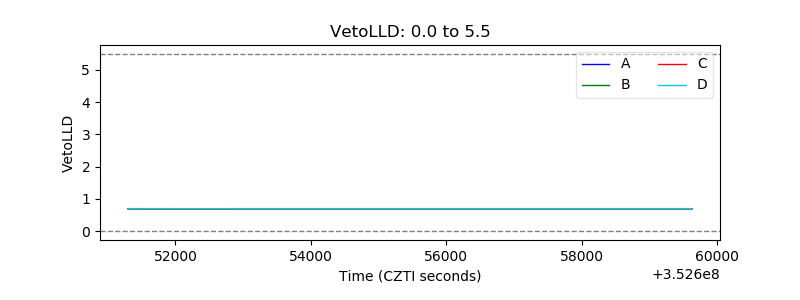 |
| Alpha Counter | 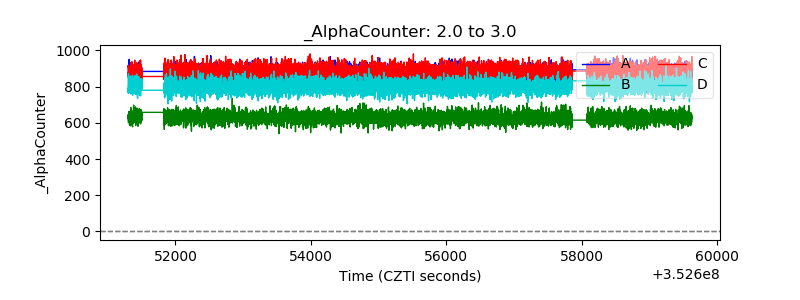 |
| _CPM_Rate | 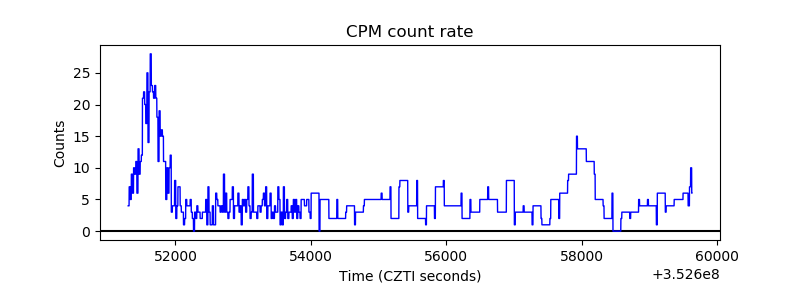 |
| CZT Counter | 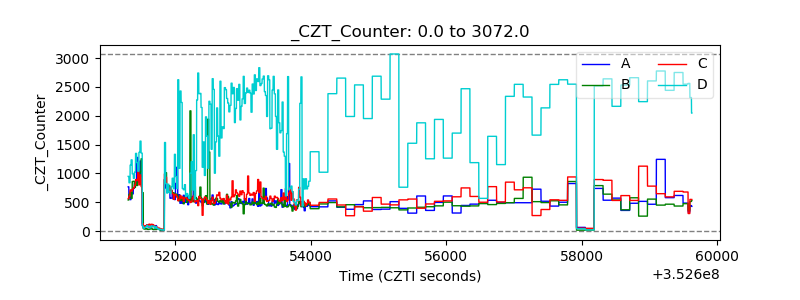 |
| +2.5 Volts monitor |  |
| +5 Volts monitor |  |
| _ROLL_ROT | 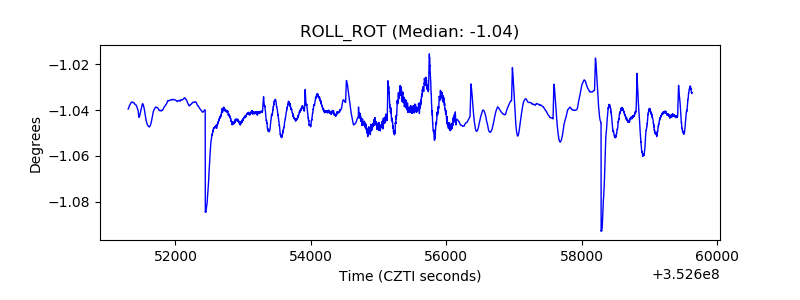 |
| _Roll_DEC | 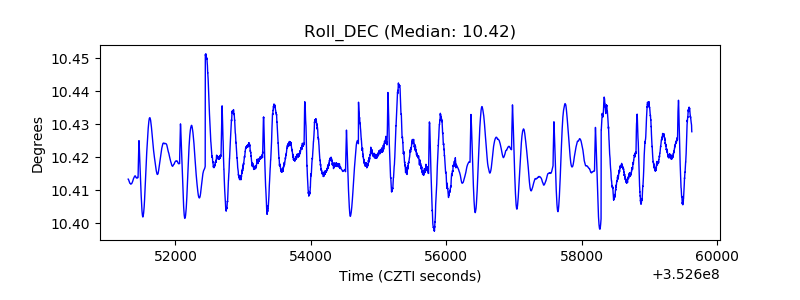 |
| _Roll_RA | 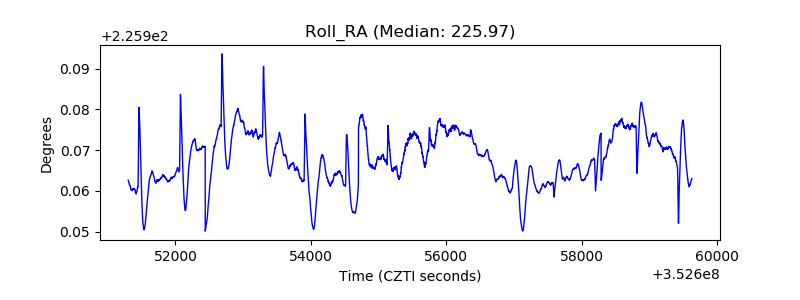 |
| Veto Counter | 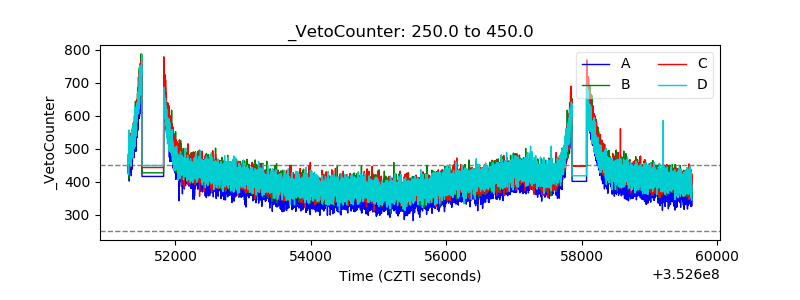 |