| Param | Original file | Final file |
|---|---|---|
| Filename | modeM0/AS1A10_101T19_9000004228_29390cztM0_level2.evt | modeM0/AS1A10_101T19_9000004228_29390cztM0_level2_quad_clean.evt |
| Size (bytes) | 968,584,320 | 85,527,360 |
| Size | 923.7 MB | 81.6 MB |
| Events in quadrant A | 4,989,560 | 534,125 |
| Events in quadrant B | 3,990,381 | 548,064 |
| Events in quadrant C | 4,556,319 | 530,717 |
| Events in quadrant D | 15,268,998 | 431,904 |
| Mode SS | |||
|---|---|---|---|
| Quadrant | BADHDUFLAG | Total packets | Discarded packets |
| A | 0 | 162 | 0 |
| B | 0 | 162 | 0 |
| C | 0 | 162 | 0 |
| D | 0 | 162 | 0 |
| Mode M9 | |||
|---|---|---|---|
| Quadrant | BADHDUFLAG | Total packets | Discarded packets |
| A | 0 | 5 | 0 |
| B | 0 | 5 | 0 |
| C | 0 | 5 | 0 |
| D | 0 | 5 | 0 |
| Mode M0 | |||
|---|---|---|---|
| Quadrant | BADHDUFLAG | Total packets | Discarded packets |
| A | 0 | 20005 | 2 |
| B | 0 | 16745 | 2 |
| C | 0 | 18325 | 2 |
| D | 0 | 50787 | 5 |
| Quadrant | Total seconds | Saturated seconds | Saturation percentage |
|---|---|---|---|
| A | 7819 | 324 | 4.143752% |
| B | 7820 | 179 | 2.289003% |
| C | 7820 | 484 | 6.189258% |
| D | 7819 | 4787 | 61.222663% |
Noise dominated data is calculated using 1-second bins in cleaned event files. If a bin has >2000 counts, and if more than 50% of those come from <1% of pixels, then it is considered to be noise-dominated and hence unusable.
| Quadrant | # 1 sec bins | Bins with >0 counts | Bins with >2000 counts | High rate bins dominated by noise | Noise dominated (total time) | Noise dominated (detector-on time) | Marked lightcurve |
|---|---|---|---|---|---|---|---|
| A | 8409 | 7821 | 149 | 149 | 1.77% | 1.91% | 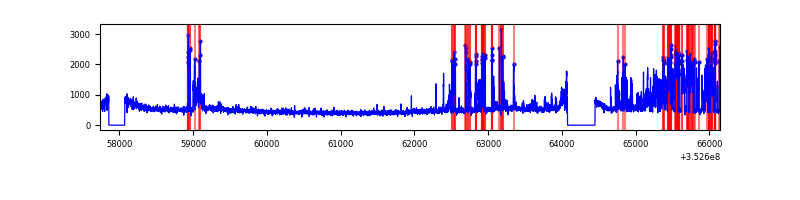 |
| B | 8410 | 7822 | 7 | 7 | 0.08% | 0.09% | 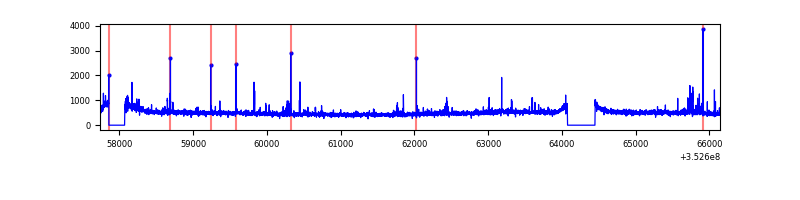 |
| C | 8410 | 7822 | 1 | 1 | 0.01% | 0.01% | 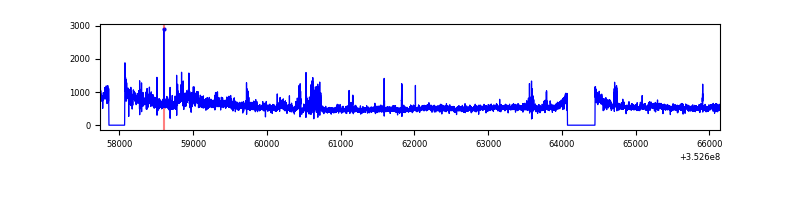 |
| D | 8409 | 7821 | 4195 | 4195 | 49.89% | 53.64% | 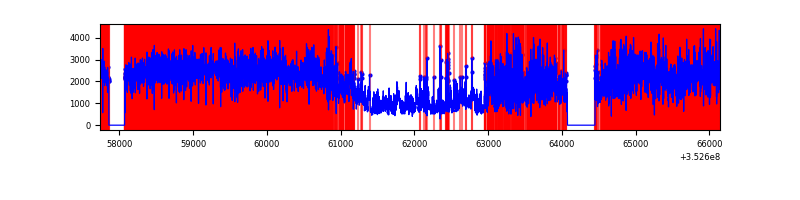 |
Top three noisy pixels from each quadrant. If the there are fewer than three noisy pixels in the level2.evt file, extra rows are filled as -1
| Pixel properties | Quadrant properties | ||||||
|---|---|---|---|---|---|---|---|
| Quadrant | DetID | PixID | Counts | Sigma | Mean | Median | Sigma |
| A | 1 | 113 | 1189506 | 5970.04 | 979 | 956 | 199.1 |
| A | 13 | 170 | 19255 | 91.92 | 979 | 956 | 199.1 |
| A | 13 | 254 | 16029 | 75.71 | 979 | 956 | 199.1 |
| B | 5 | 255 | 52548 | 274.84 | 977 | 952 | 187.7 |
| B | 10 | 245 | 39288 | 204.21 | 977 | 952 | 187.7 |
| B | 12 | 111 | 23301 | 119.05 | 977 | 952 | 187.7 |
| C | 3 | 233 | 545222 | 2477.3 | 933 | 937 | 219.7 |
| C | 14 | 238 | 214695 | 972.91 | 933 | 937 | 219.7 |
| C | 14 | 254 | 95328 | 429.62 | 933 | 937 | 219.7 |
| D | 8 | 195 | 6281860 | 37277.07 | 702 | 682 | 168.5 |
| D | 1 | 52 | 3944459 | 23405.24 | 702 | 682 | 168.5 |
| D | 12 | 33 | 1727128 | 10245.98 | 702 | 682 | 168.5 |
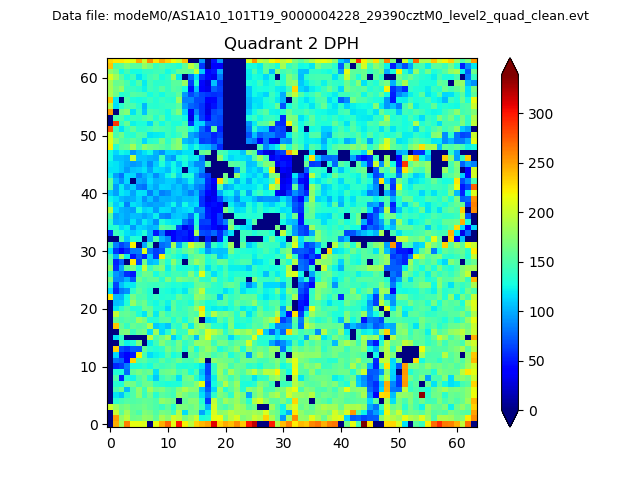
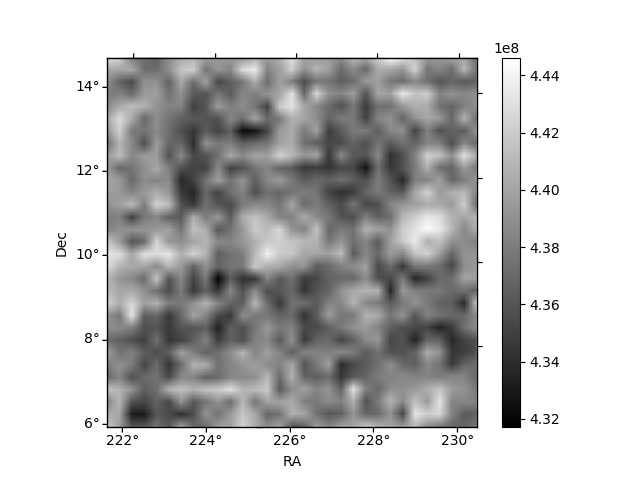
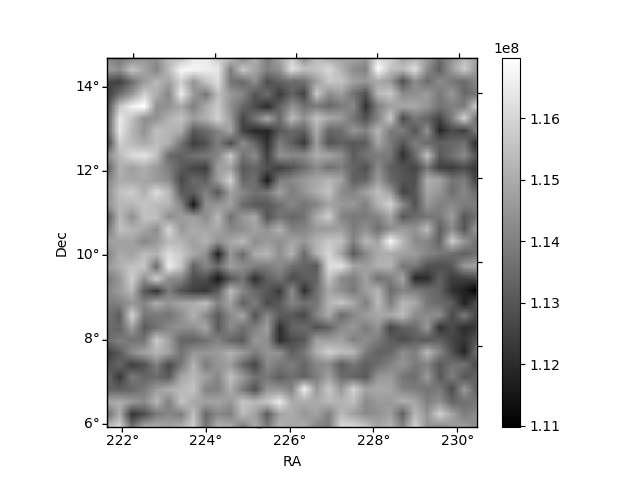
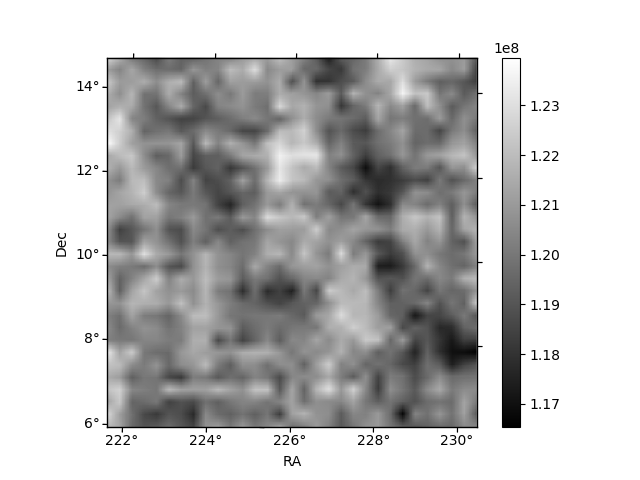
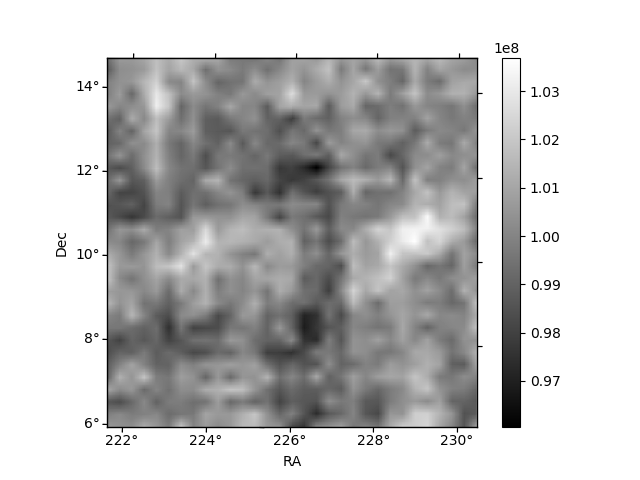
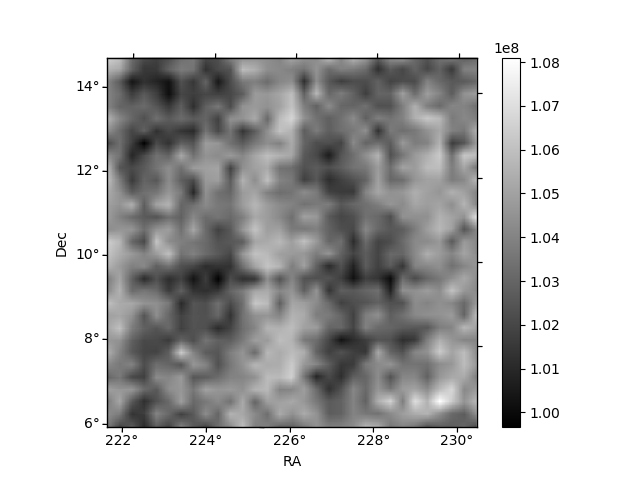
Histogram calculated using DETX and DETY for each event in the final _common_clean file
| Quadrant A | 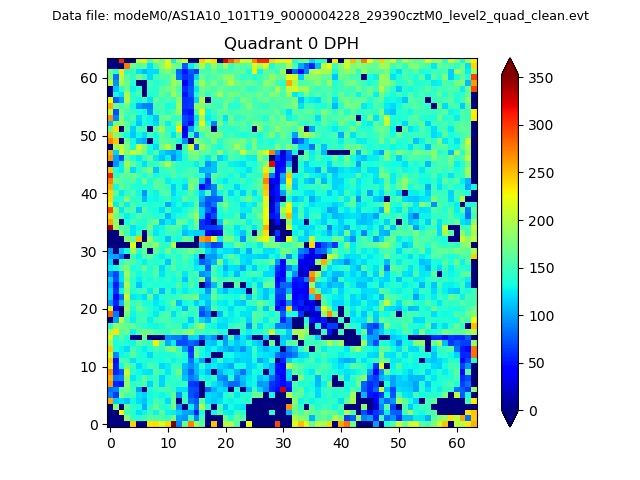 |
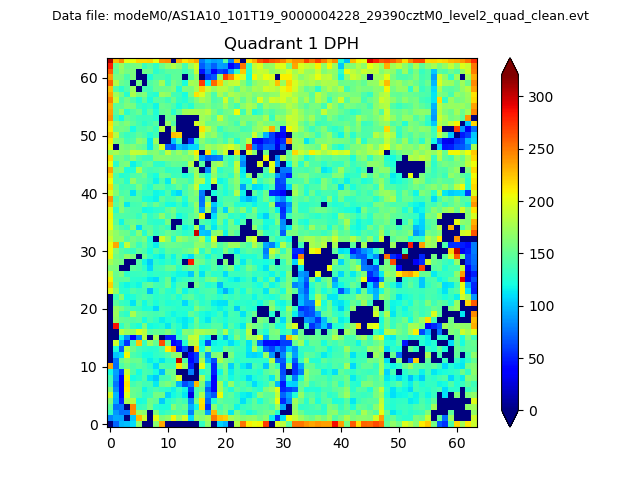 |
Quadrant B |
|---|---|---|---|
| Quadrant D | 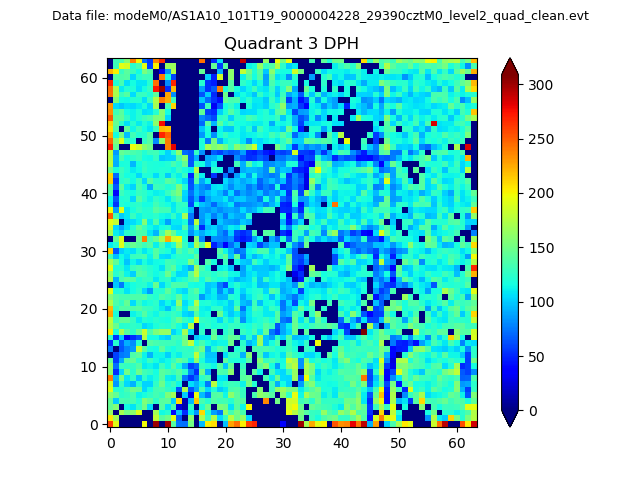 |
 |
Quadrant C |
| Plot type | Count rate plots | Images |
|---|---|---|
| Comparison with Poisson distribution Blue bars denote a histogram of data divided into 1 sec bins. Red curve is a Poisson curve with rate = median count rate of data. |
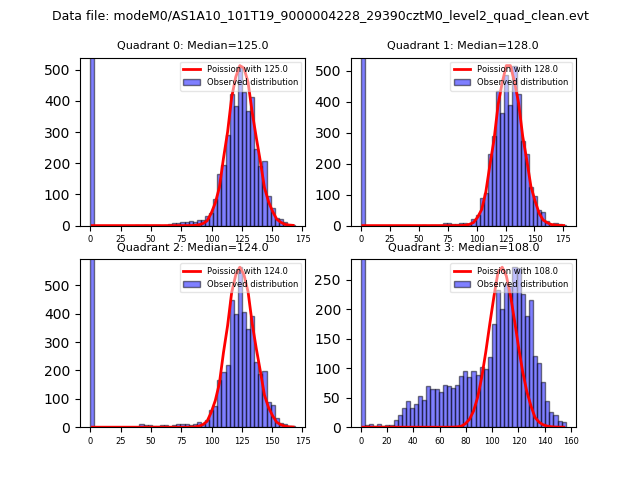 |
 |
| Quadrant-wise count rates Data is divided into 100 sec bins |
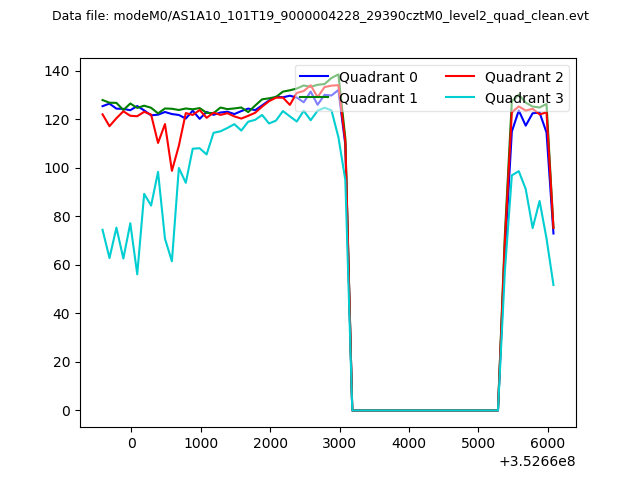 |
|
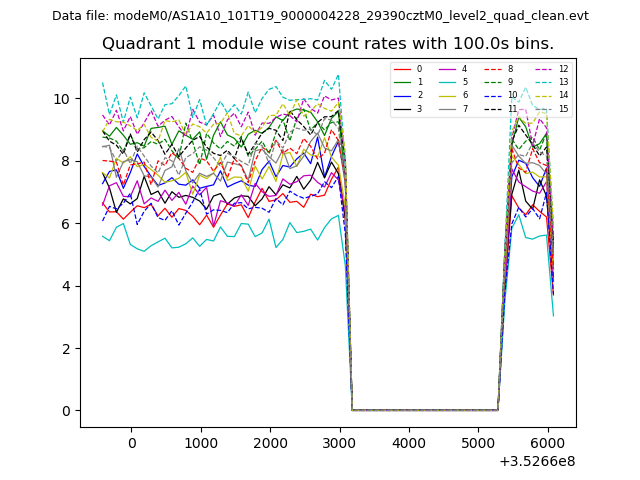
| Module-wise count rates for Quadrant A Data is divided into 100 sec bins |
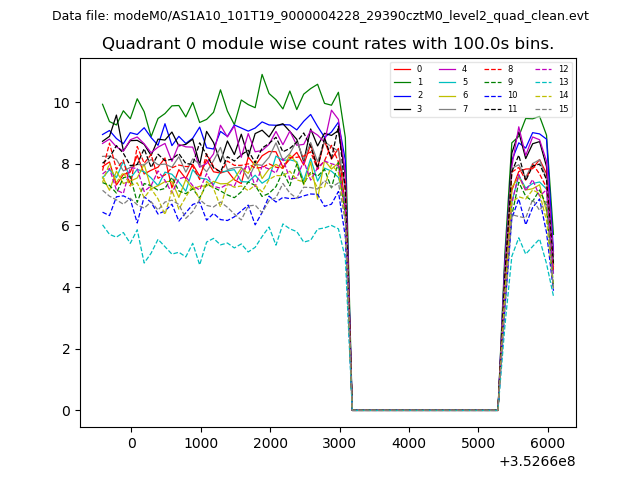 |
 |
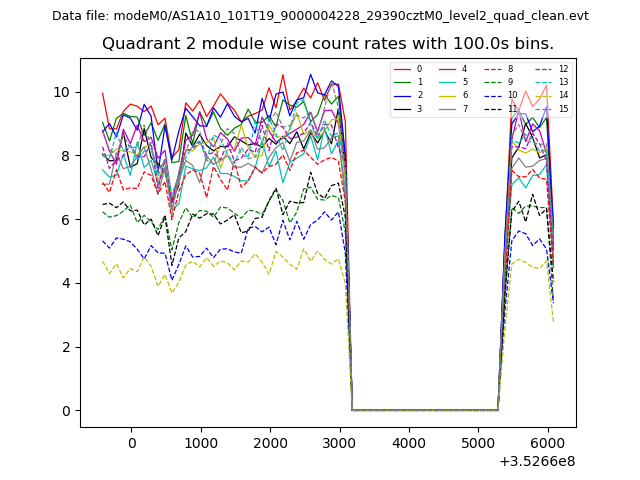
| Module-wise count rates for Quadrant B Data is divided into 100 sec bins |
 |
 |
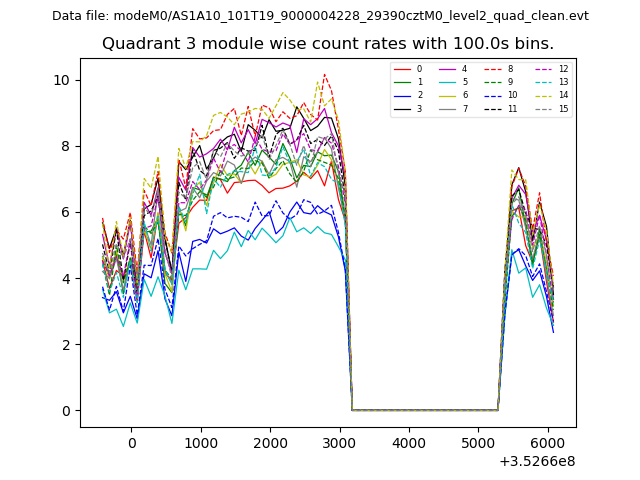
| Module-wise count rates for Quadrant C Data is divided into 100 sec bins |
 |
 |
| Module-wise count rates for Quadrant D Data is divided into 100 sec bins |
 |
 |
| Parameter | Plot |
|---|---|
| CZT HV Monitor | 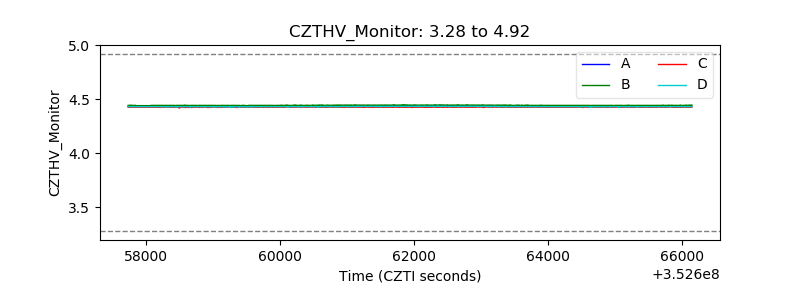 |
| D_VDD | 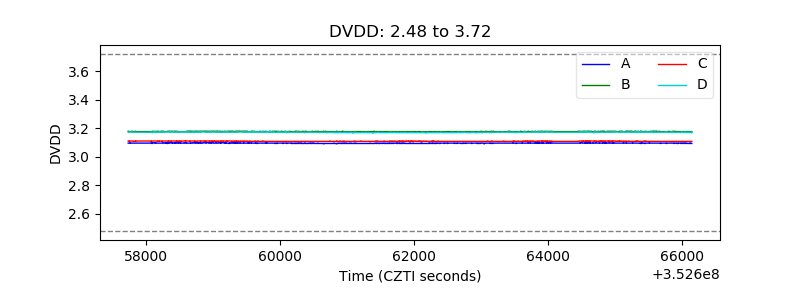 |
| Temperature 1 | 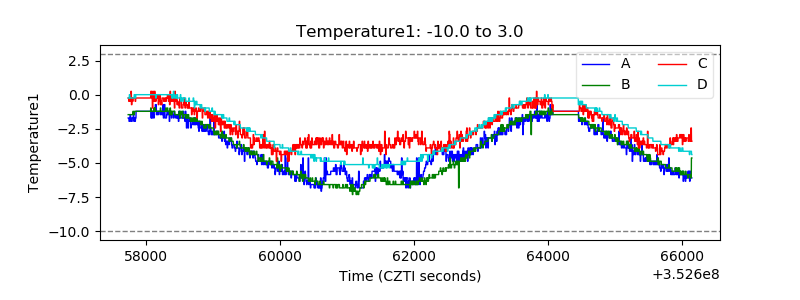 |
| Veto HV Monitor |  |
| Veto LLD | 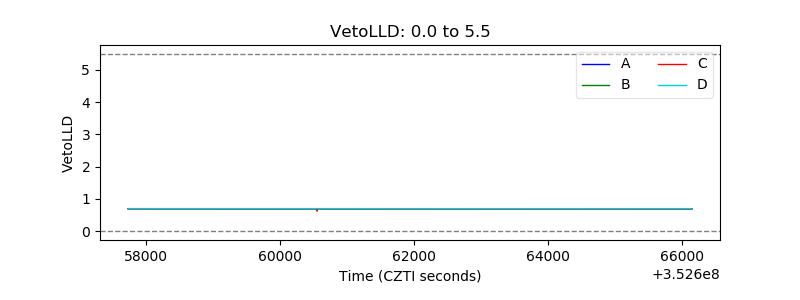 |
| Alpha Counter | 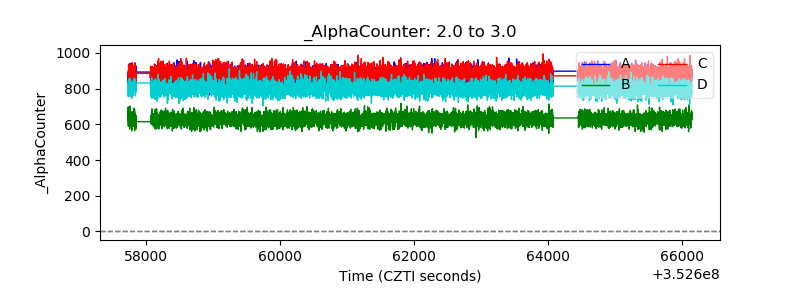 |
| _CPM_Rate | 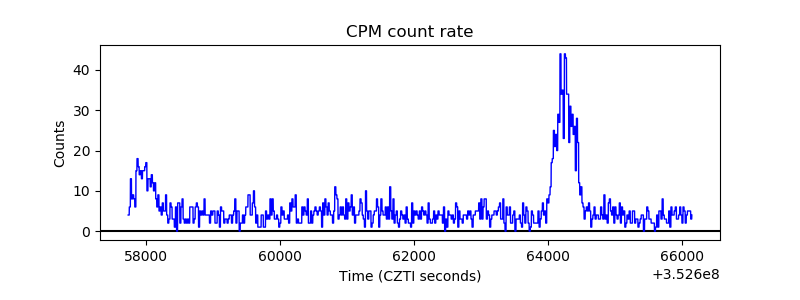 |
| CZT Counter | 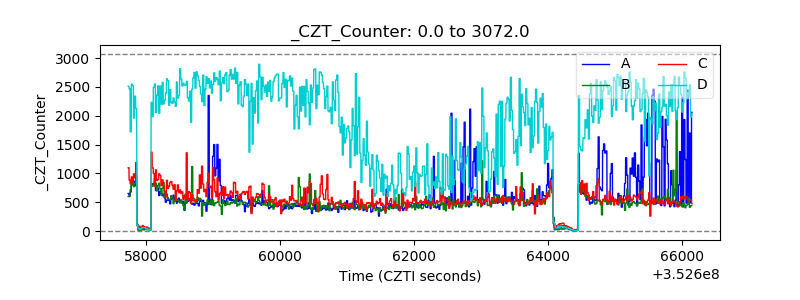 |
| +2.5 Volts monitor | 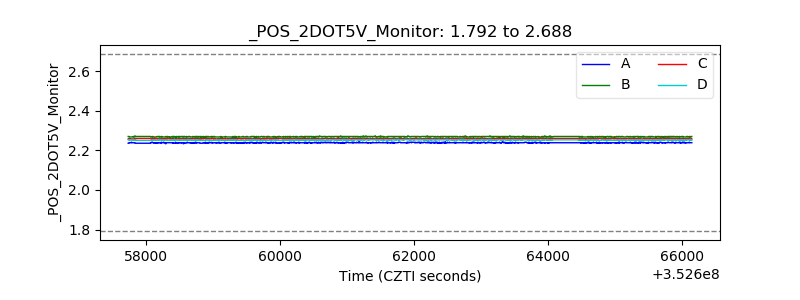 |
| +5 Volts monitor |  |
| _ROLL_ROT | 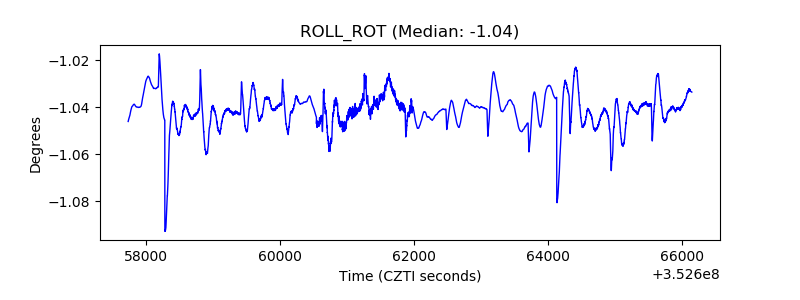 |
| _Roll_DEC | 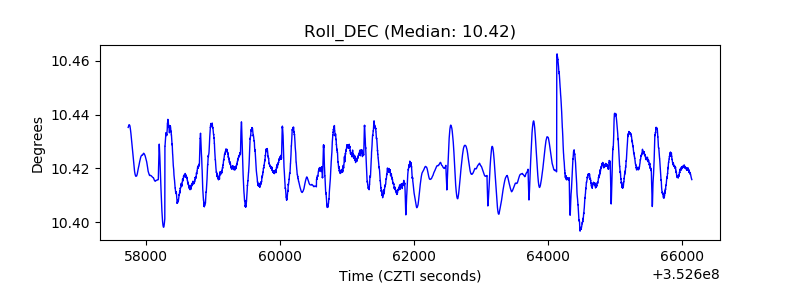 |
| _Roll_RA | 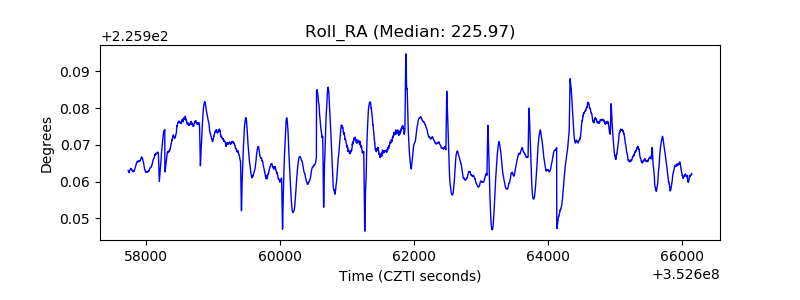 |
| Veto Counter | 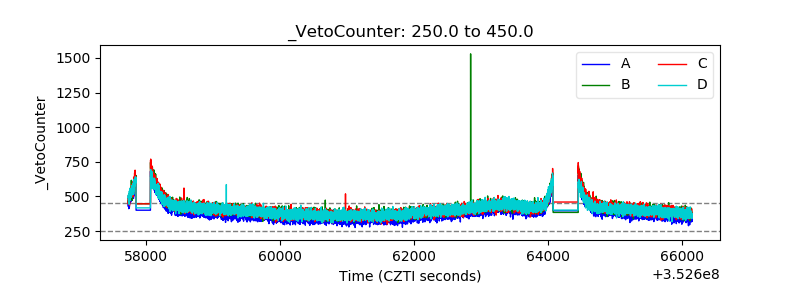 |