| Param | Original file | Final file |
|---|---|---|
| Filename | modeM0/AS1A10_101T19_9000004228_29392cztM0_level2.evt | modeM0/AS1A10_101T19_9000004228_29392cztM0_level2_quad_clean.evt |
| Size (bytes) | 254,931,840 | 16,441,920 |
| Size | 243.1 MB | 15.7 MB |
| Events in quadrant A | 1,740,457 | 95,855 |
| Events in quadrant B | 930,464 | 102,598 |
| Events in quadrant C | 987,714 | 100,103 |
| Events in quadrant D | 3,941,176 | 69,985 |
| Mode SS | |||
|---|---|---|---|
| Quadrant | BADHDUFLAG | Total packets | Discarded packets |
| A | 0 | 34 | 0 |
| B | 0 | 34 | 0 |
| C | 0 | 34 | 0 |
| D | 0 | 34 | 0 |
| Mode M0 | |||
|---|---|---|---|
| Quadrant | BADHDUFLAG | Total packets | Discarded packets |
| A | 0 | 6340 | 0 |
| B | 0 | 3800 | 0 |
| C | 0 | 3932 | 0 |
| D | 0 | 12902 | 0 |
| Quadrant | Total seconds | Saturated seconds | Saturation percentage |
|---|---|---|---|
| A | 1755 | 156 | 8.888889% |
| B | 1756 | 10 | 0.569476% |
| C | 1756 | 79 | 4.498861% |
| D | 1756 | 1459 | 83.086560% |
Noise dominated data is calculated using 1-second bins in cleaned event files. If a bin has >2000 counts, and if more than 50% of those come from <1% of pixels, then it is considered to be noise-dominated and hence unusable.
| Quadrant | # 1 sec bins | Bins with >0 counts | Bins with >2000 counts | High rate bins dominated by noise | Noise dominated (total time) | Noise dominated (detector-on time) | Marked lightcurve |
|---|---|---|---|---|---|---|---|
| A | 1755 | 1755 | 115 | 115 | 6.55% | 6.55% | 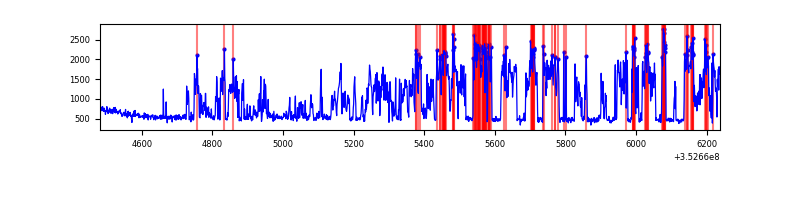 |
| B | 1756 | 1756 | 1 | 1 | 0.06% | 0.06% | 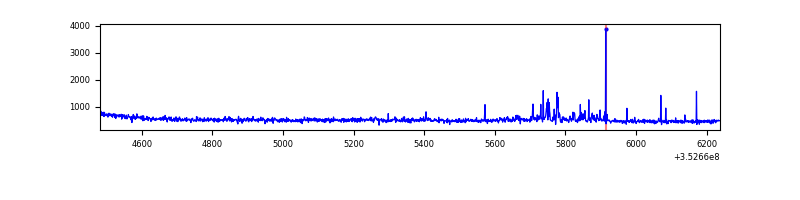 |
| C | 1756 | 1756 | 0 | 0 | 0.00% | 0.00% | 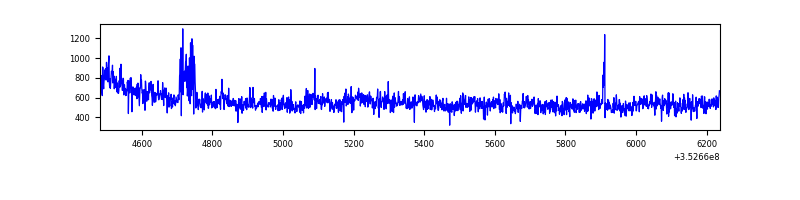 |
| D | 1756 | 1756 | 1206 | 1206 | 68.68% | 68.68% | 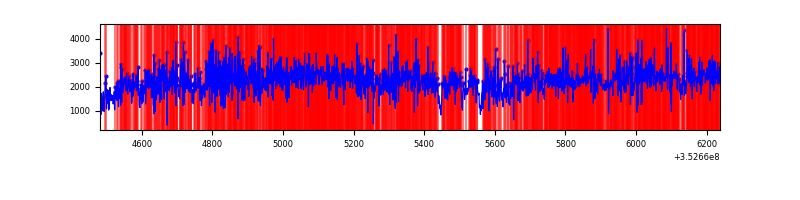 |
Top three noisy pixels from each quadrant. If the there are fewer than three noisy pixels in the level2.evt file, extra rows are filled as -1
| Pixel properties | Quadrant properties | ||||||
|---|---|---|---|---|---|---|---|
| Quadrant | DetID | PixID | Counts | Sigma | Mean | Median | Sigma |
| A | 1 | 113 | 884517 | 18648.92 | 221 | 215 | 47.4 |
| A | 13 | 254 | 3930 | 78.35 | 221 | 215 | 47.4 |
| A | 3 | 137 | 2233 | 42.56 | 221 | 215 | 47.4 |
| B | 10 | 245 | 31660 | 690.99 | 224 | 219 | 45.5 |
| B | 0 | 190 | 9079 | 194.72 | 224 | 219 | 45.5 |
| B | 5 | 255 | 6507 | 138.19 | 224 | 219 | 45.5 |
| C | 3 | 233 | 54195 | 1030.64 | 213 | 213 | 52.4 |
| C | 14 | 238 | 44391 | 843.46 | 213 | 213 | 52.4 |
| C | 10 | 9 | 38175 | 724.78 | 213 | 213 | 52.4 |
| D | 8 | 195 | 2172229 | 55708.7 | 156 | 152 | 39.0 |
| D | 1 | 52 | 999308 | 25626.02 | 156 | 152 | 39.0 |
| D | 2 | 250 | 71580 | 1831.96 | 156 | 152 | 39.0 |
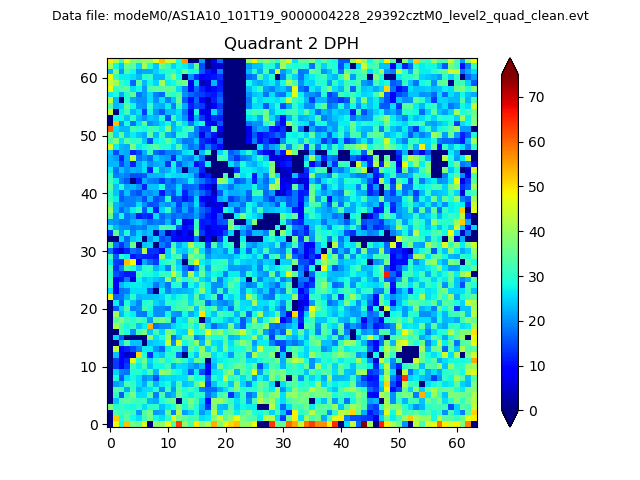
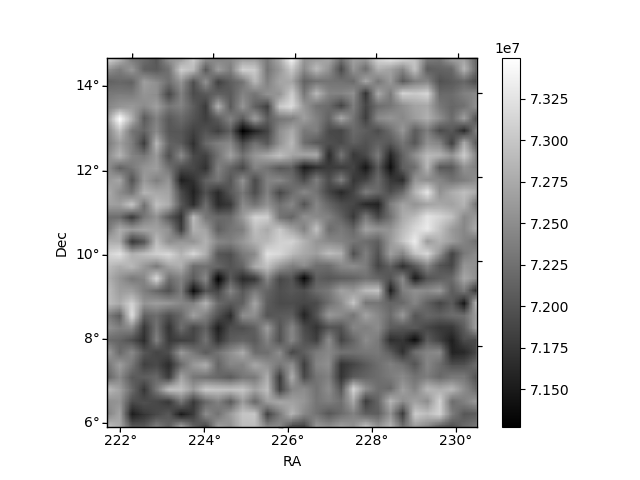
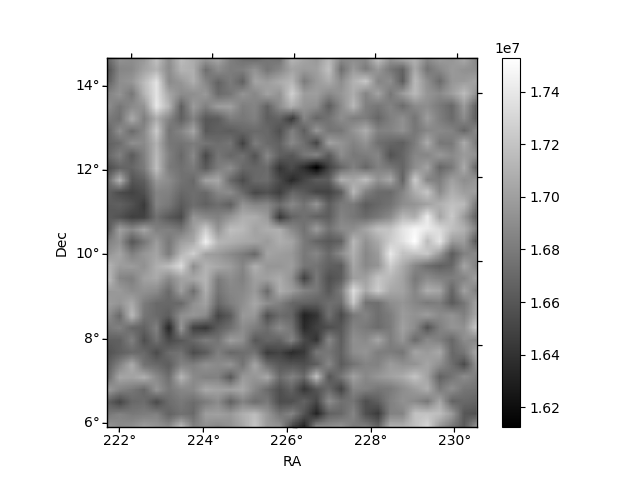
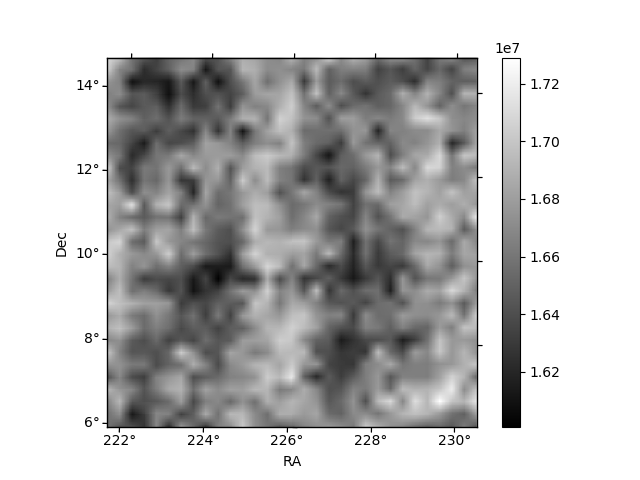
Histogram calculated using DETX and DETY for each event in the final _common_clean file
| Quadrant A | 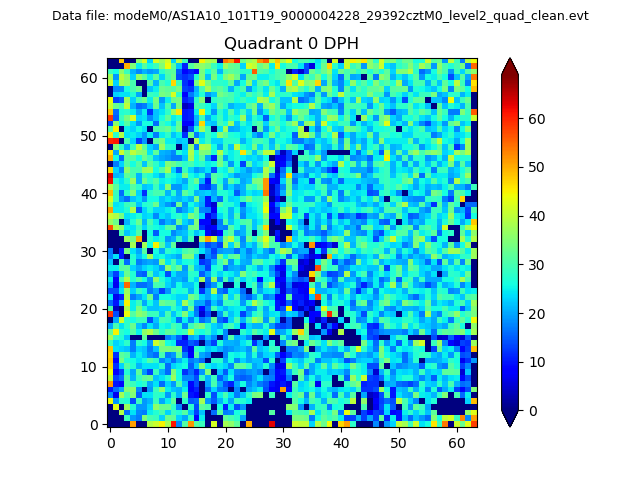 |
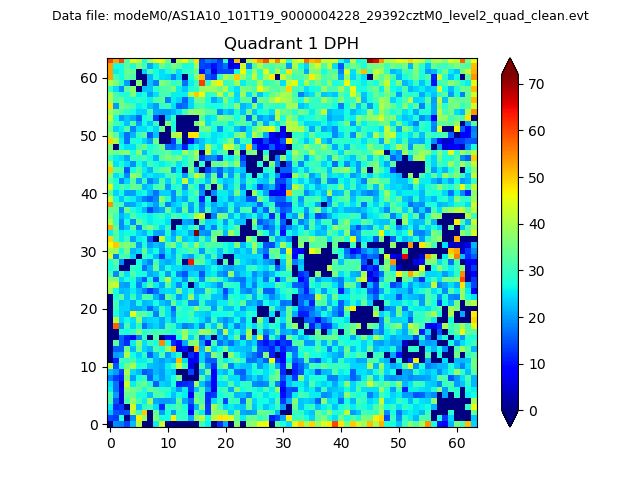 |
Quadrant B |
|---|---|---|---|
| Quadrant D | 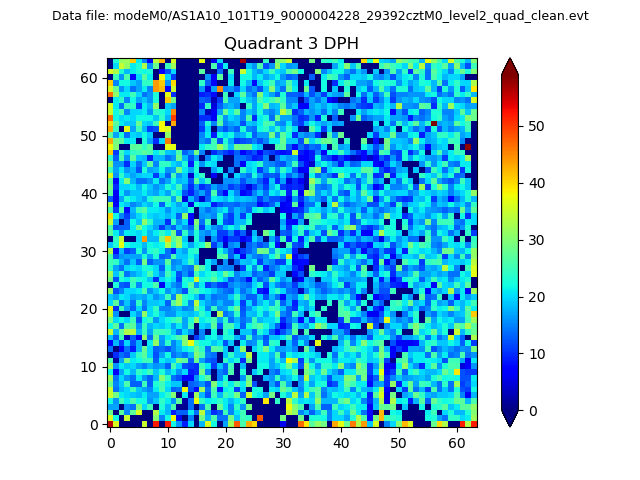 |
 |
Quadrant C |
| Plot type | Count rate plots | Images |
|---|---|---|
| Comparison with Poisson distribution Blue bars denote a histogram of data divided into 1 sec bins. Red curve is a Poisson curve with rate = median count rate of data. |
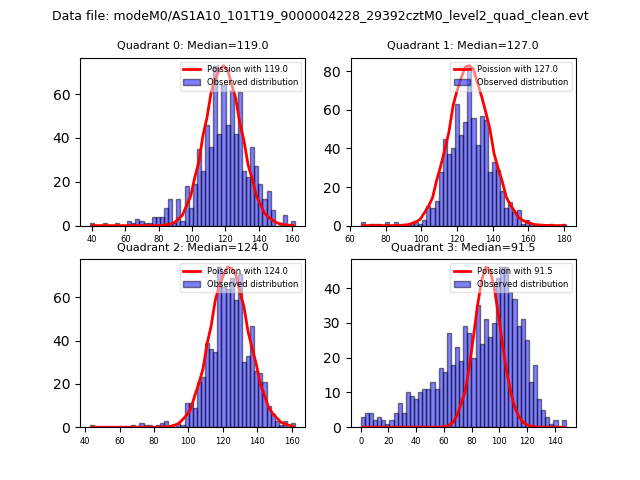 |
 |
| Quadrant-wise count rates Data is divided into 100 sec bins |
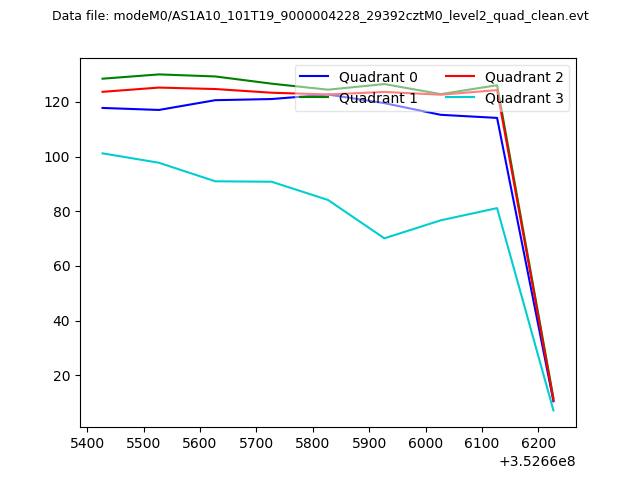 |
|
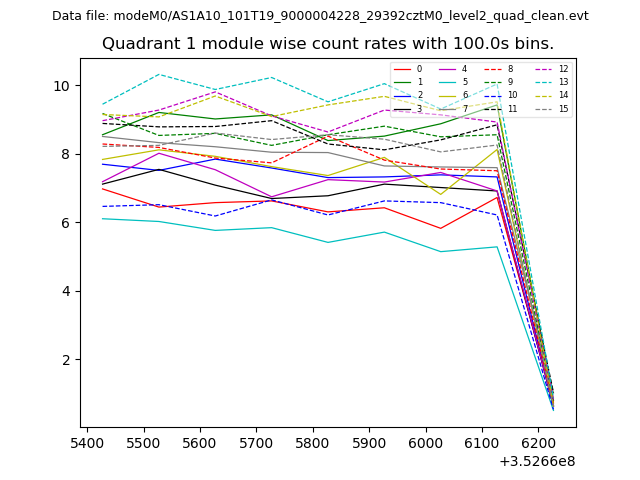
| Module-wise count rates for Quadrant A Data is divided into 100 sec bins |
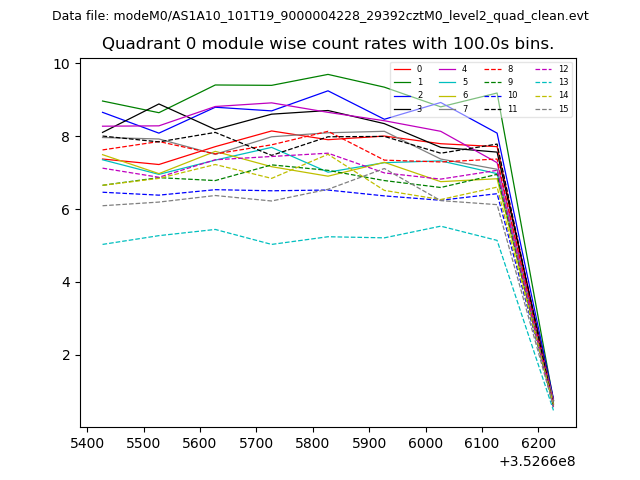 |
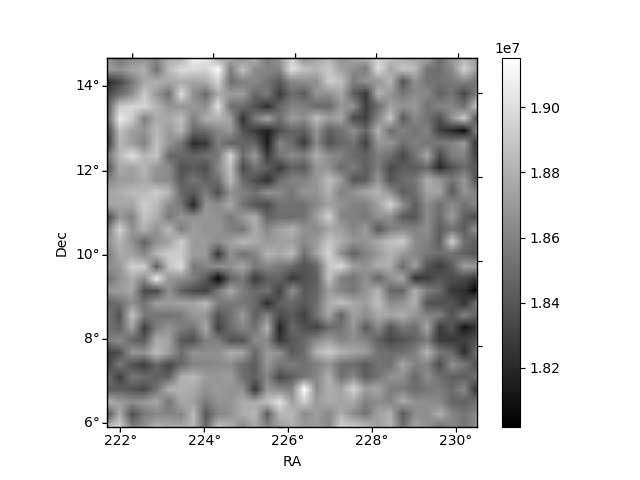 |
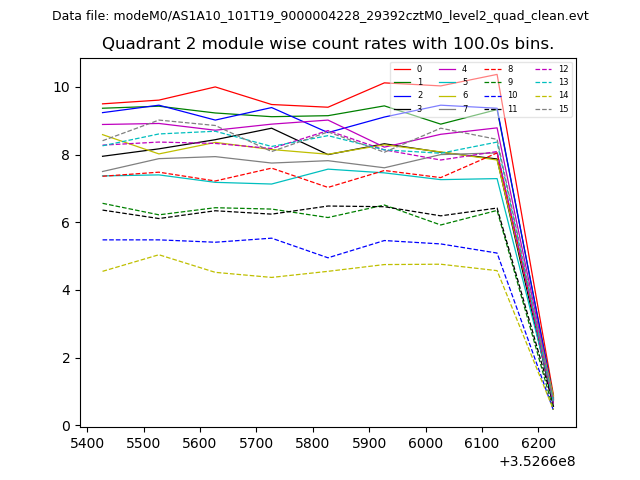
| Module-wise count rates for Quadrant B Data is divided into 100 sec bins |
 |
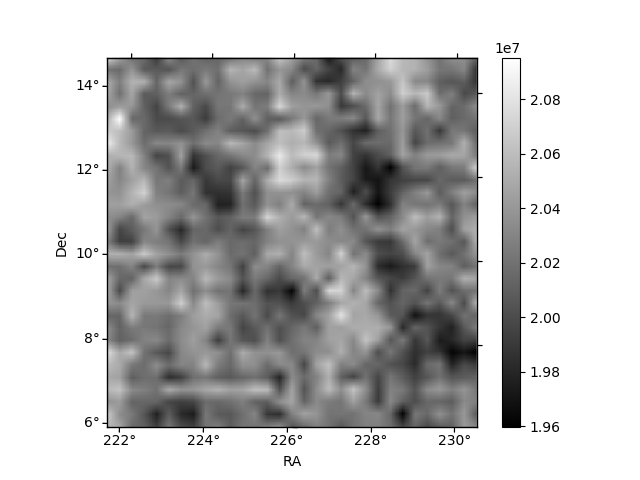 |
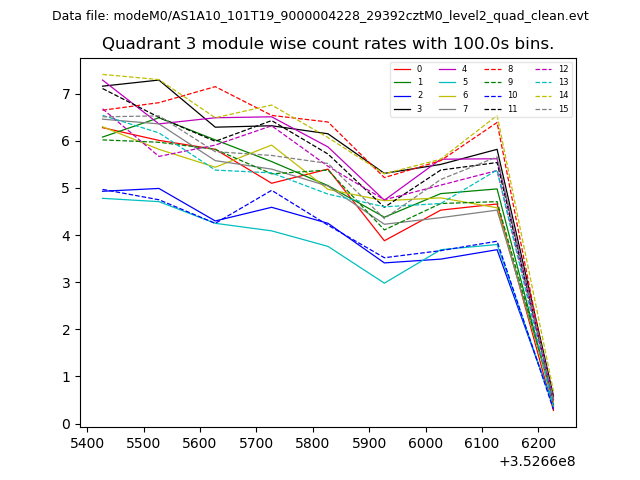
| Module-wise count rates for Quadrant C Data is divided into 100 sec bins |
 |
 |
| Module-wise count rates for Quadrant D Data is divided into 100 sec bins |
 |
 |
| Parameter | Plot |
|---|---|
| CZT HV Monitor | 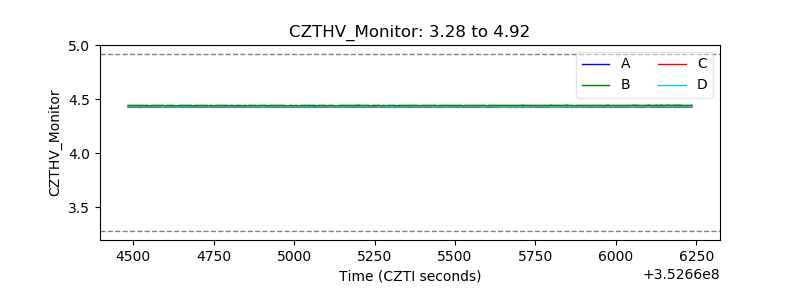 |
| D_VDD | 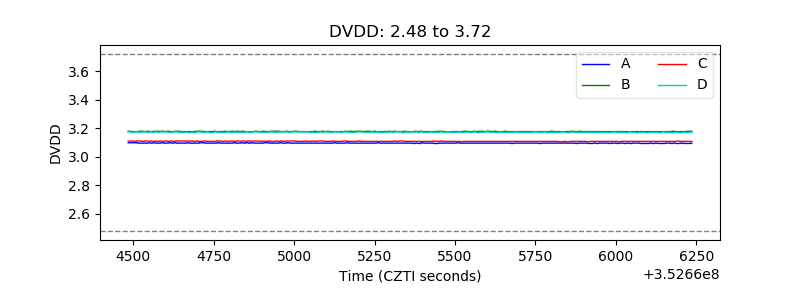 |
| Temperature 1 | 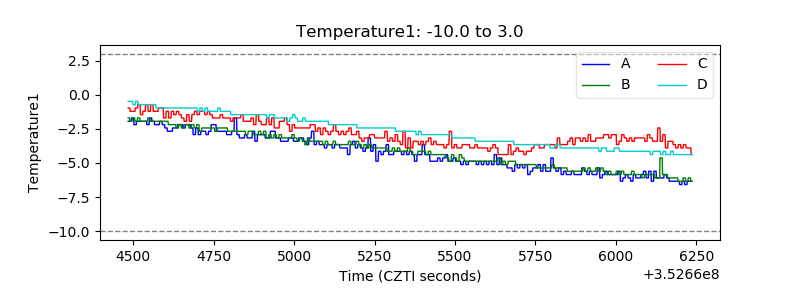 |
| Veto HV Monitor | 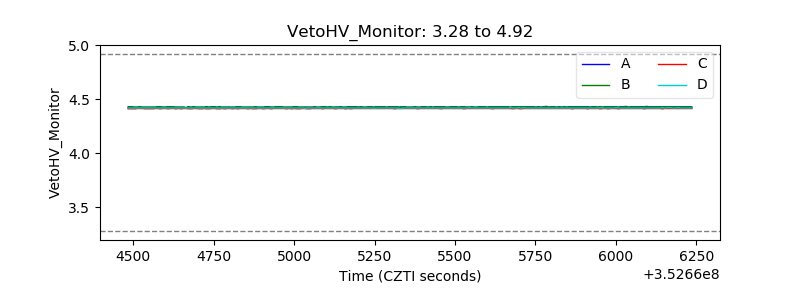 |
| Veto LLD | 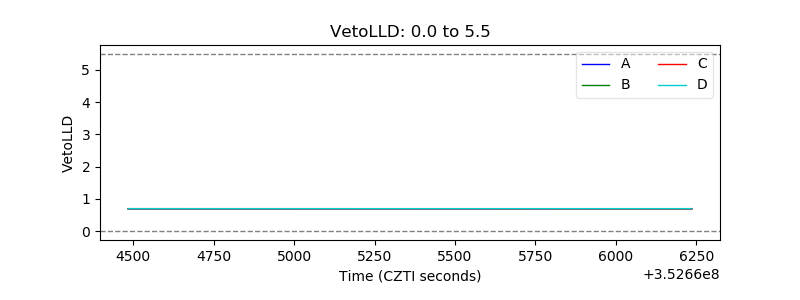 |
| Alpha Counter |  |
| _CPM_Rate | 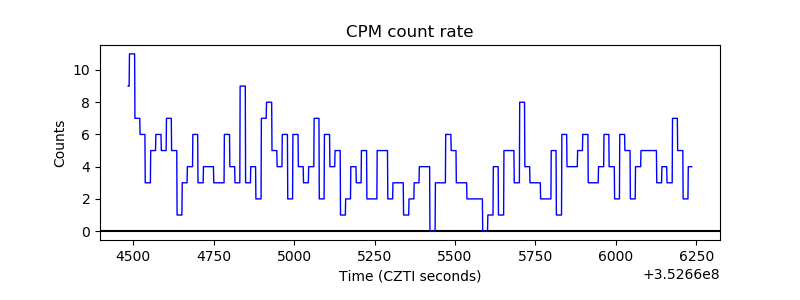 |
| CZT Counter | 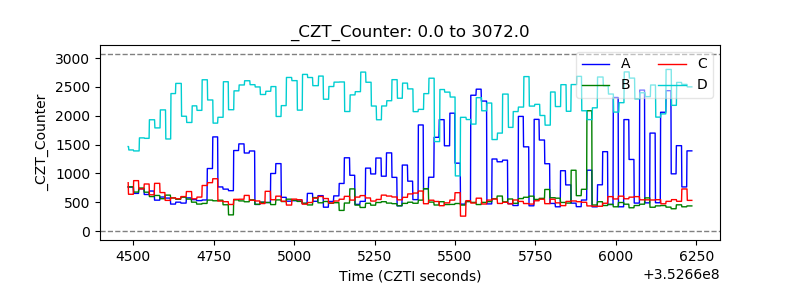 |
| +2.5 Volts monitor | 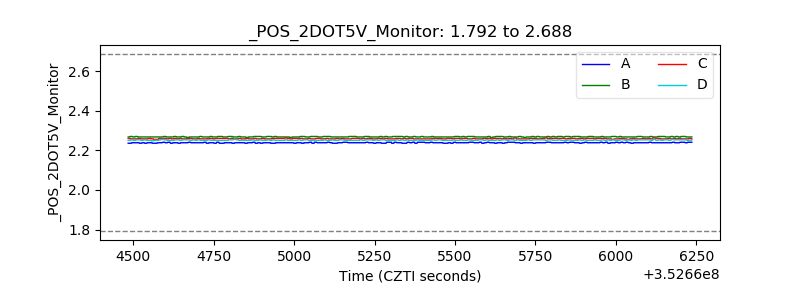 |
| +5 Volts monitor |  |
| _ROLL_ROT | 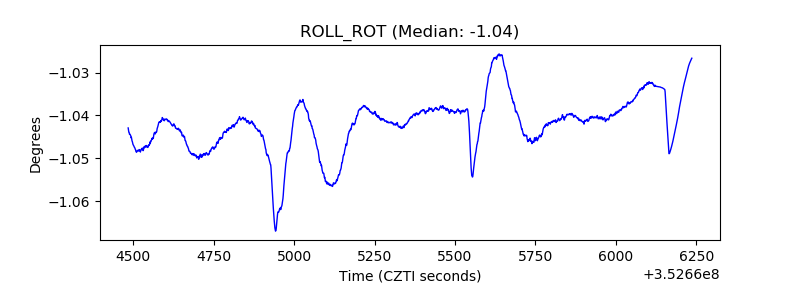 |
| _Roll_DEC | 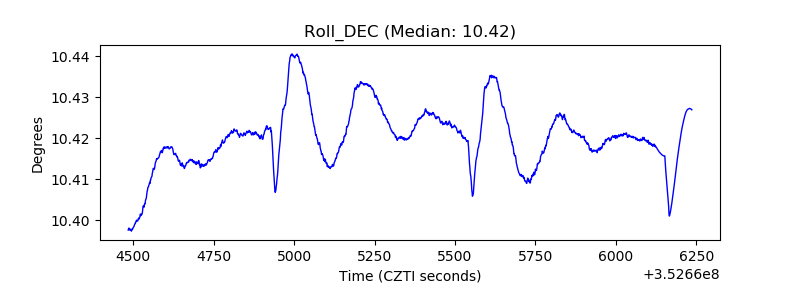 |
| _Roll_RA | 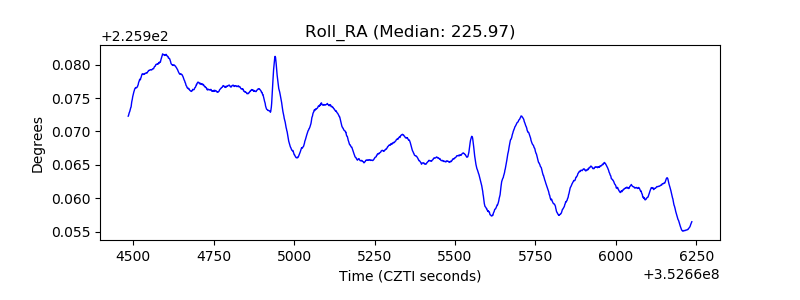 |
| Veto Counter | 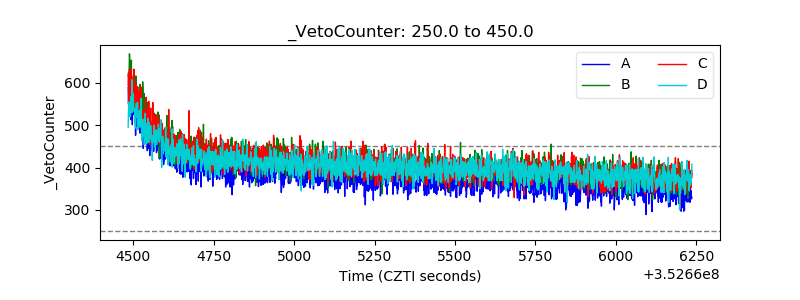 |