| Param | Original file | Final file |
|---|---|---|
| Filename | modeM0/AS1A10_101T19_9000004228_29394cztM0_level2.evt | modeM0/AS1A10_101T19_9000004228_29394cztM0_level2_quad_clean.evt |
| Size (bytes) | 1,228,979,520 | 115,306,560 |
| Size | 1.1 GB | 110.0 MB |
| Events in quadrant A | 5,749,471 | 745,322 |
| Events in quadrant B | 4,718,425 | 771,048 |
| Events in quadrant C | 5,693,682 | 738,206 |
| Events in quadrant D | 20,419,803 | 578,930 |
| Mode SS | |||
|---|---|---|---|
| Quadrant | BADHDUFLAG | Total packets | Discarded packets |
| A | 0 | 196 | 0 |
| B | 0 | 196 | 0 |
| C | 0 | 196 | 0 |
| D | 0 | 196 | 0 |
| Mode M9 | |||
|---|---|---|---|
| Quadrant | BADHDUFLAG | Total packets | Discarded packets |
| A | 0 | 19 | 0 |
| B | 0 | 19 | 0 |
| C | 0 | 19 | 0 |
| D | 0 | 19 | 0 |
| Mode M0 | |||
|---|---|---|---|
| Quadrant | BADHDUFLAG | Total packets | Discarded packets |
| A | 0 | 23316 | 2 |
| B | 0 | 19936 | 2 |
| C | 0 | 23192 | 2 |
| D | 0 | 67101 | 2 |
| Quadrant | Total seconds | Saturated seconds | Saturation percentage |
|---|---|---|---|
| A | 9467 | 395 | 4.172388% |
| B | 9468 | 102 | 1.077313% |
| C | 9468 | 199 | 2.101817% |
| D | 9468 | 6361 | 67.184199% |
Noise dominated data is calculated using 1-second bins in cleaned event files. If a bin has >2000 counts, and if more than 50% of those come from <1% of pixels, then it is considered to be noise-dominated and hence unusable.
| Quadrant | # 1 sec bins | Bins with >0 counts | Bins with >2000 counts | High rate bins dominated by noise | Noise dominated (total time) | Noise dominated (detector-on time) | Marked lightcurve |
|---|---|---|---|---|---|---|---|
| A | 11428 | 9469 | 173 | 173 | 1.51% | 1.83% | 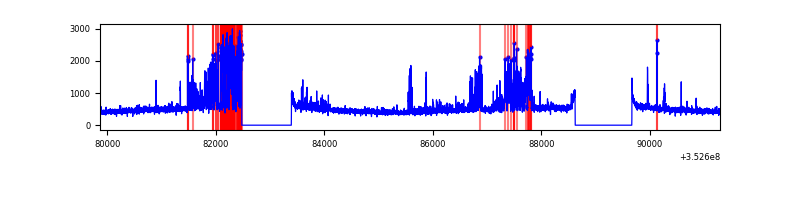 |
| B | 11429 | 9470 | 14 | 14 | 0.12% | 0.15% | 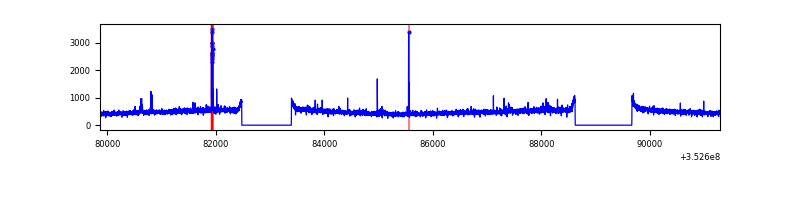 |
| C | 11429 | 9470 | 1 | 1 | 0.01% | 0.01% | 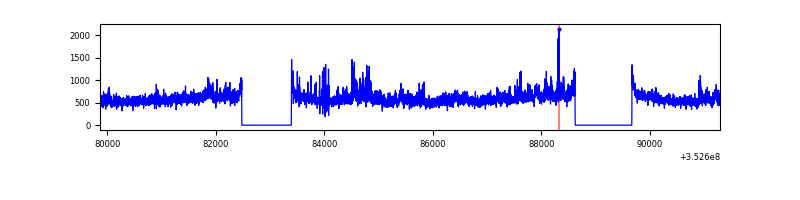 |
| D | 11429 | 9469 | 6277 | 6277 | 54.92% | 66.29% | 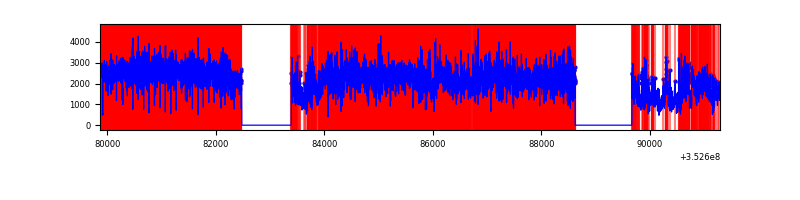 |
Top three noisy pixels from each quadrant. If the there are fewer than three noisy pixels in the level2.evt file, extra rows are filled as -1
| Pixel properties | Quadrant properties | ||||||
|---|---|---|---|---|---|---|---|
| Quadrant | DetID | PixID | Counts | Sigma | Mean | Median | Sigma |
| A | 1 | 113 | 1246802 | 5325.54 | 1166 | 1145 | 233.9 |
| A | 13 | 254 | 17259 | 68.89 | 1166 | 1145 | 233.9 |
| A | 3 | 137 | 11464 | 44.12 | 1166 | 1145 | 233.9 |
| B | 10 | 245 | 60349 | 265.02 | 1173 | 1146 | 223.4 |
| B | 0 | 229 | 32280 | 139.37 | 1173 | 1146 | 223.4 |
| B | 12 | 111 | 28034 | 120.36 | 1173 | 1146 | 223.4 |
| C | 3 | 233 | 1047493 | 3963.2 | 1131 | 1140 | 264.0 |
| C | 14 | 238 | 192715 | 725.61 | 1131 | 1140 | 264.0 |
| C | 2 | 114 | 22354 | 80.35 | 1131 | 1140 | 264.0 |
| D | 8 | 195 | 13341236 | 64276.24 | 874 | 853 | 207.5 |
| D | 1 | 52 | 2253267 | 10852.52 | 874 | 853 | 207.5 |
| D | 12 | 33 | 1389121 | 6688.91 | 874 | 853 | 207.5 |
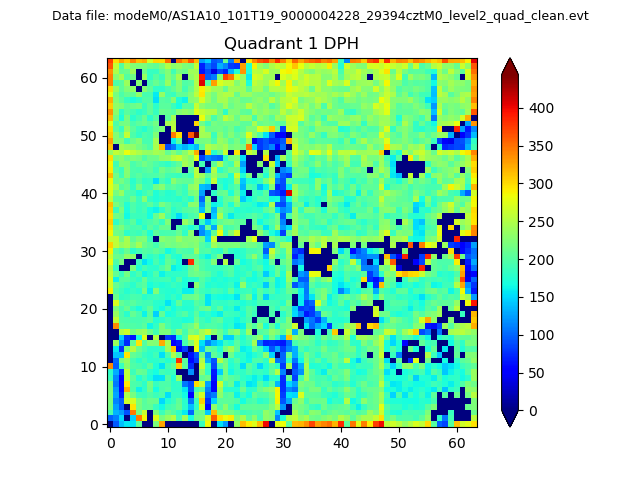
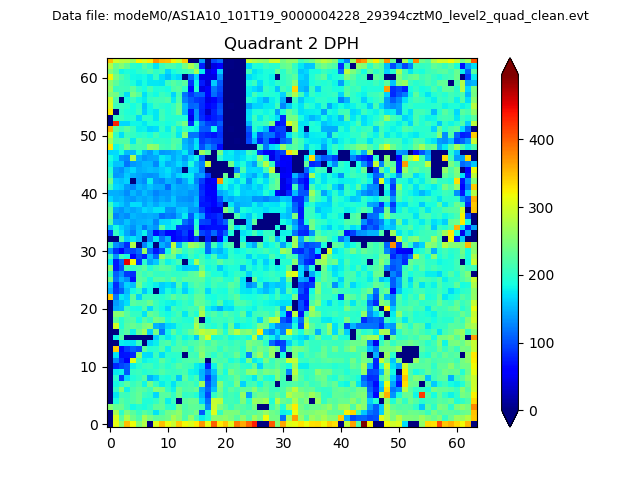
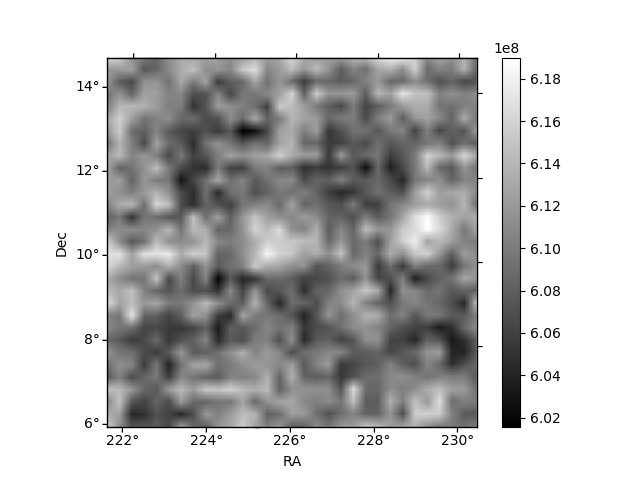
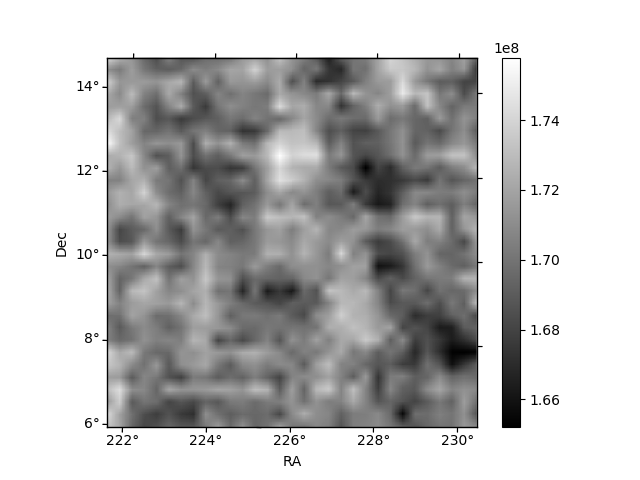
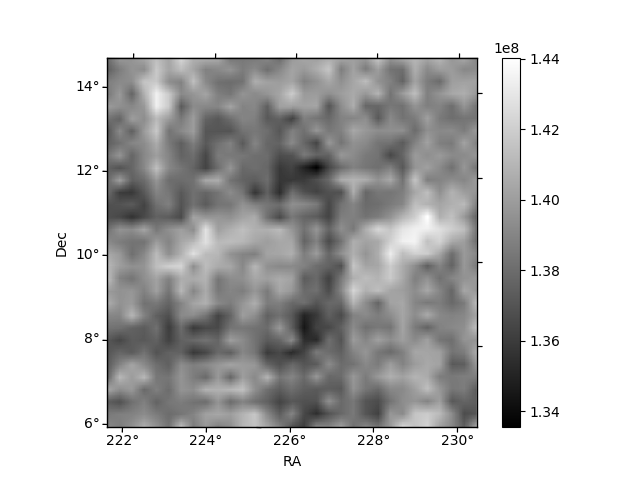
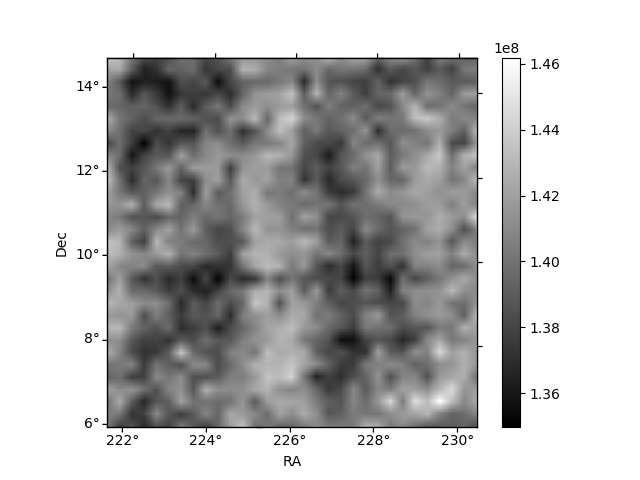
Histogram calculated using DETX and DETY for each event in the final _common_clean file
| Quadrant A |  |
 |
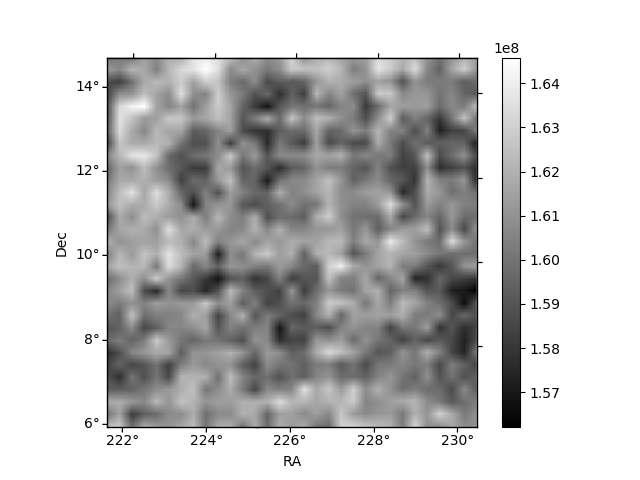
Quadrant B |
|---|---|---|---|
| Quadrant D | 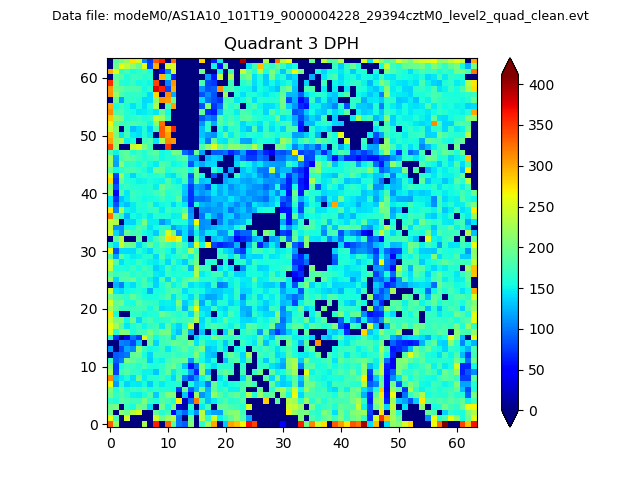 |
 |
Quadrant C |
| Plot type | Count rate plots | Images |
|---|---|---|
| Comparison with Poisson distribution Blue bars denote a histogram of data divided into 1 sec bins. Red curve is a Poisson curve with rate = median count rate of data. |
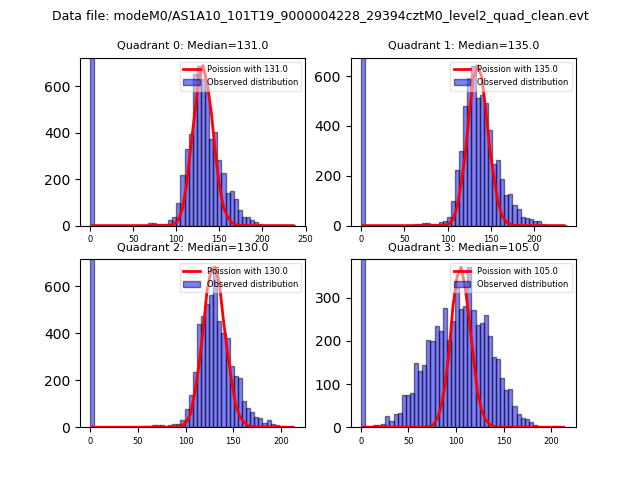 |
 |
| Quadrant-wise count rates Data is divided into 100 sec bins |
 |
|
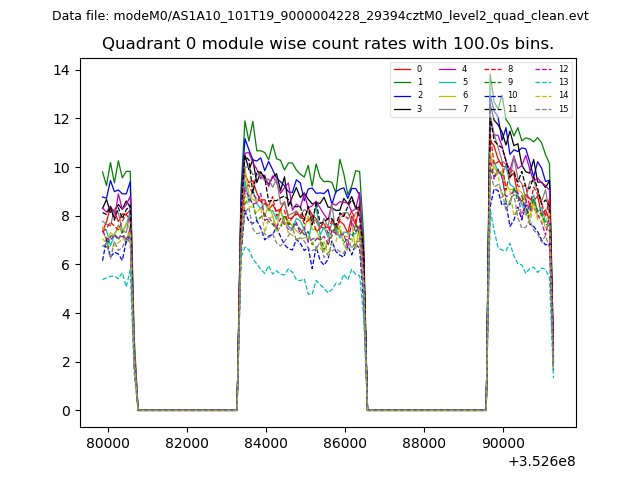
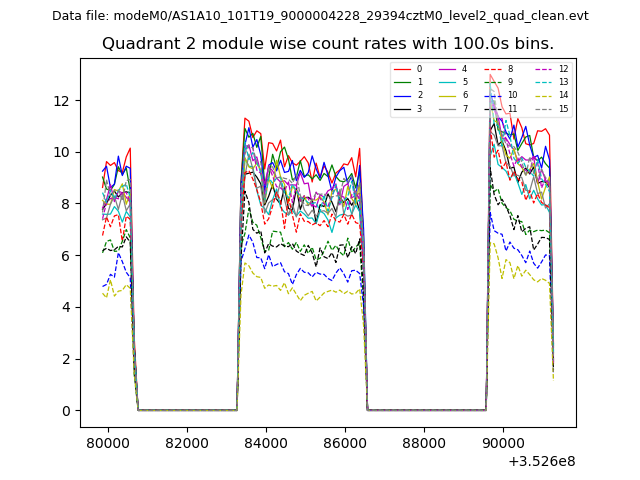
| Module-wise count rates for Quadrant A Data is divided into 100 sec bins |
 |
 |
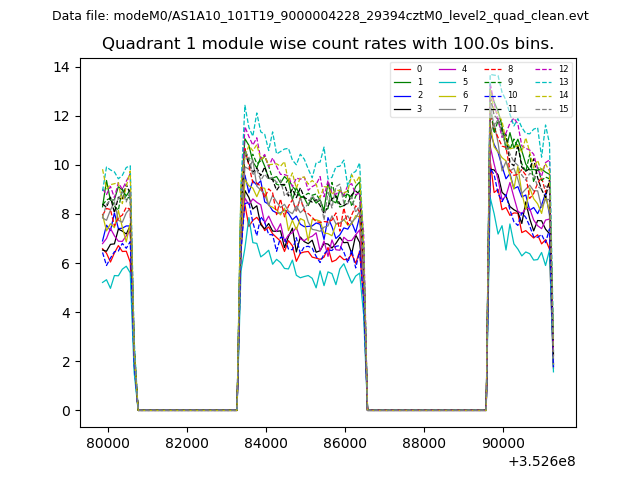
| Module-wise count rates for Quadrant B Data is divided into 100 sec bins |
 |
 |
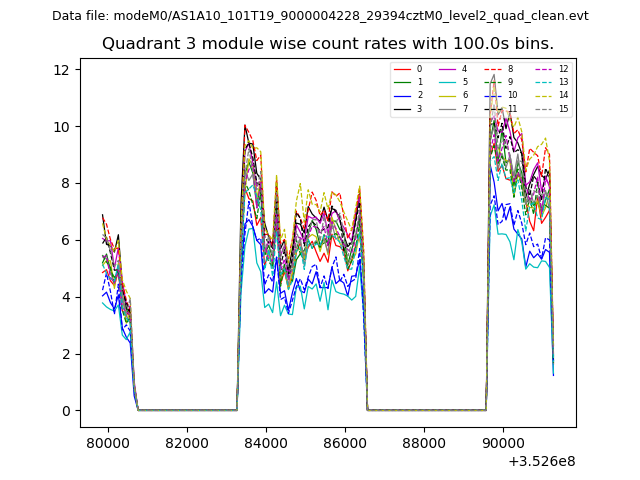
| Module-wise count rates for Quadrant C Data is divided into 100 sec bins |
 |
 |
| Module-wise count rates for Quadrant D Data is divided into 100 sec bins |
 |
 |
| Parameter | Plot |
|---|---|
| CZT HV Monitor | 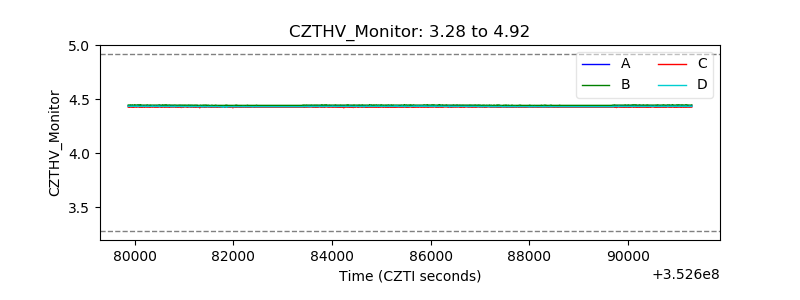 |
| D_VDD | 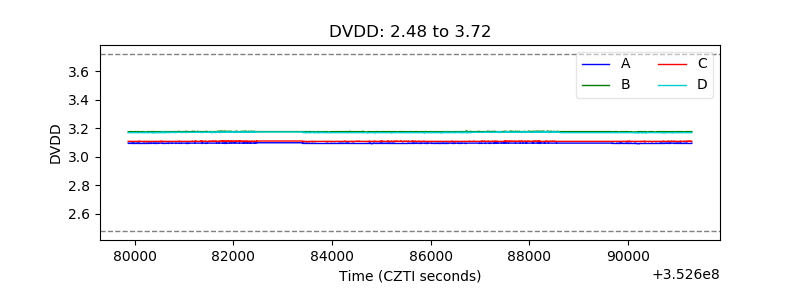 |
| Temperature 1 | 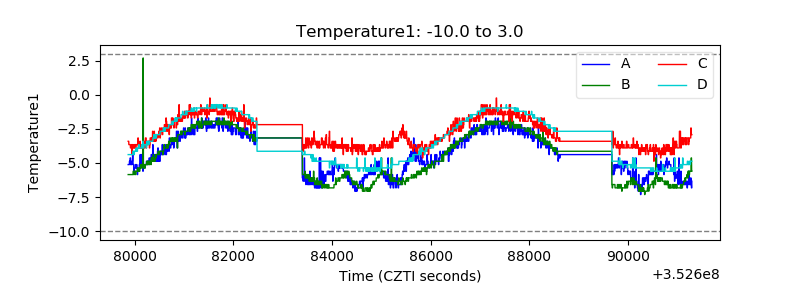 |
| Veto HV Monitor | 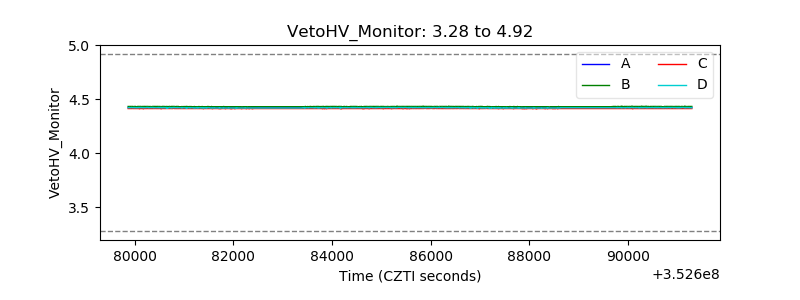 |
| Veto LLD | 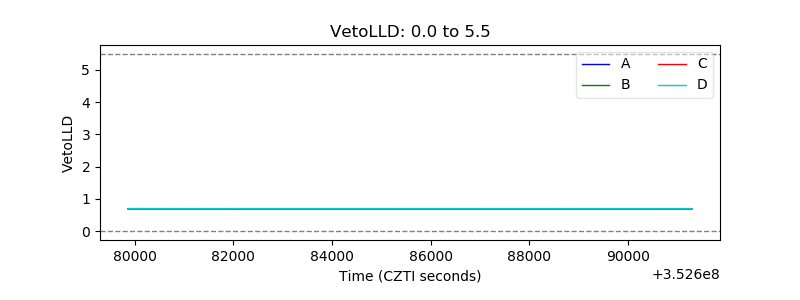 |
| Alpha Counter |  |
| _CPM_Rate |  |
| CZT Counter | 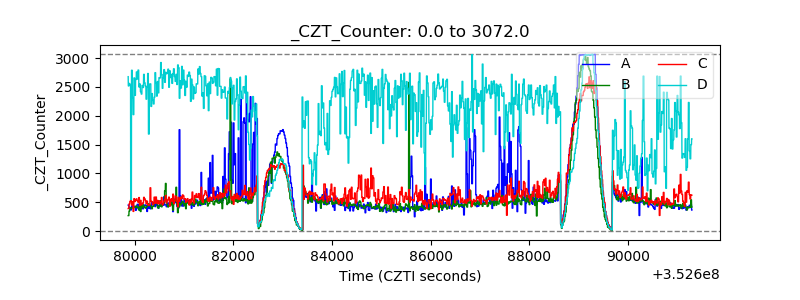 |
| +2.5 Volts monitor |  |
| +5 Volts monitor |  |
| _ROLL_ROT | 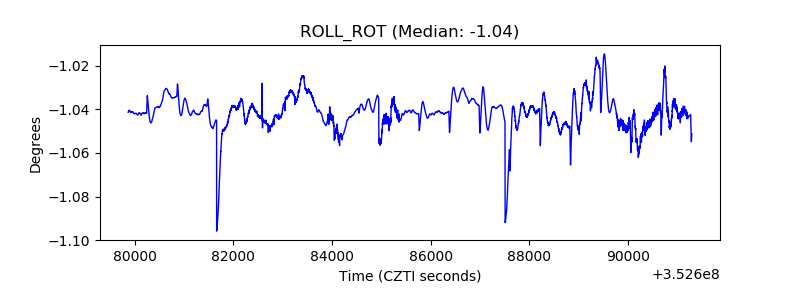 |
| _Roll_DEC | 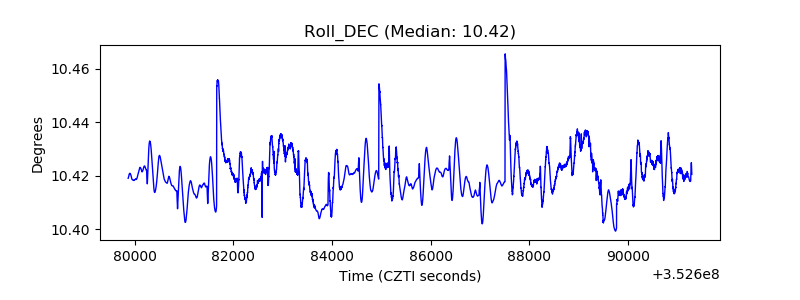 |
| _Roll_RA | 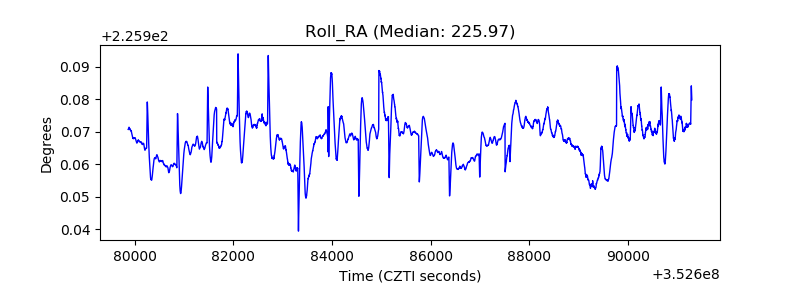 |
| Veto Counter | 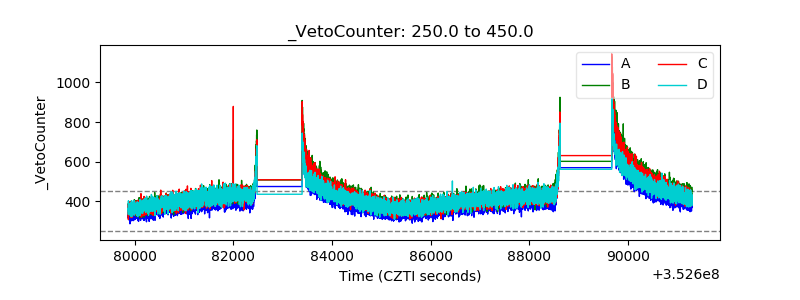 |