| Param | Original file | Final file |
|---|---|---|
| Filename | modeM0/AS1A10_101T19_9000004228_29400cztM0_level2.evt | modeM0/AS1A10_101T19_9000004228_29400cztM0_level2_quad_clean.evt |
| Size (bytes) | 688,397,760 | 83,710,080 |
| Size | 656.5 MB | 79.8 MB |
| Events in quadrant A | 3,671,819 | 537,757 |
| Events in quadrant B | 3,813,150 | 535,883 |
| Events in quadrant C | 4,490,380 | 521,050 |
| Events in quadrant D | 8,446,704 | 499,843 |
| Mode SS | |||
|---|---|---|---|
| Quadrant | BADHDUFLAG | Total packets | Discarded packets |
| A | 0 | 128 | 0 |
| B | 0 | 128 | 0 |
| C | 0 | 128 | 0 |
| D | 0 | 128 | 0 |
| Mode M9 | |||
|---|---|---|---|
| Quadrant | BADHDUFLAG | Total packets | Discarded packets |
| A | 0 | 12 | 0 |
| B | 0 | 12 | 0 |
| C | 0 | 12 | 0 |
| D | 0 | 12 | 0 |
| Mode M0 | |||
|---|---|---|---|
| Quadrant | BADHDUFLAG | Total packets | Discarded packets |
| A | 0 | 14593 | 1 |
| B | 0 | 14948 | 1 |
| C | 0 | 18044 | 1 |
| D | 0 | 29564 | 1 |
| Quadrant | Total seconds | Saturated seconds | Saturation percentage |
|---|---|---|---|
| A | 6305 | 142 | 2.252181% |
| B | 6305 | 282 | 4.472641% |
| C | 6305 | 227 | 3.600317% |
| D | 6305 | 1758 | 27.882633% |
Noise dominated data is calculated using 1-second bins in cleaned event files. If a bin has >2000 counts, and if more than 50% of those come from <1% of pixels, then it is considered to be noise-dominated and hence unusable.
| Quadrant | # 1 sec bins | Bins with >0 counts | Bins with >2000 counts | High rate bins dominated by noise | Noise dominated (total time) | Noise dominated (detector-on time) | Marked lightcurve |
|---|---|---|---|---|---|---|---|
| A | 7430 | 6306 | 7 | 7 | 0.09% | 0.11% | 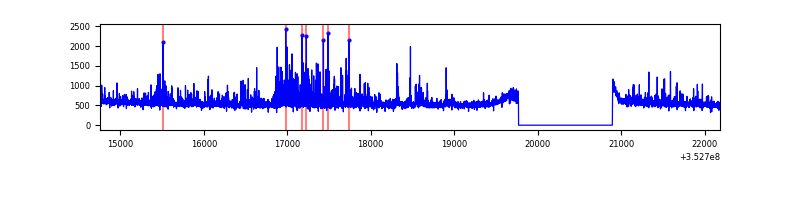 |
| B | 7430 | 6305 | 106 | 106 | 1.43% | 1.68% | 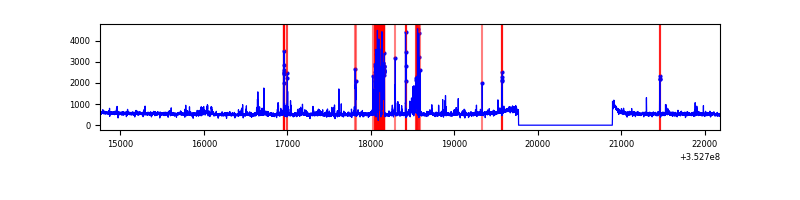 |
| C | 7430 | 6306 | 2 | 2 | 0.03% | 0.03% | 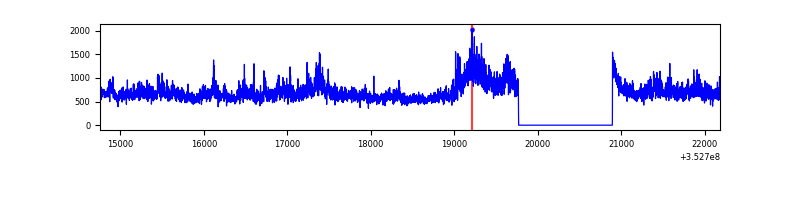 |
| D | 7430 | 6306 | 1448 | 1448 | 19.49% | 22.96% | 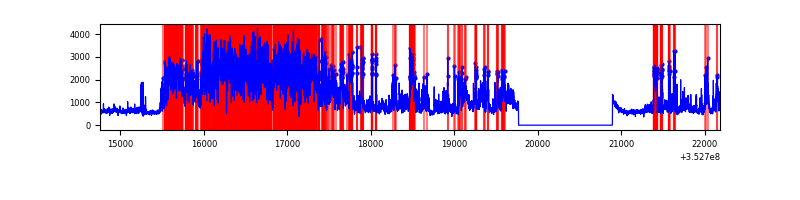 |
Top three noisy pixels from each quadrant. If the there are fewer than three noisy pixels in the level2.evt file, extra rows are filled as -1
| Pixel properties | Quadrant properties | ||||||
|---|---|---|---|---|---|---|---|
| Quadrant | DetID | PixID | Counts | Sigma | Mean | Median | Sigma |
| A | 1 | 113 | 327256 | 1892.92 | 865 | 851 | 172.4 |
| A | 13 | 254 | 12414 | 67.06 | 865 | 851 | 172.4 |
| A | 0 | 13 | 9389 | 49.51 | 865 | 851 | 172.4 |
| B | 0 | 229 | 378757 | 2372.4 | 835 | 814 | 159.3 |
| B | 5 | 255 | 73549 | 456.57 | 835 | 814 | 159.3 |
| B | 10 | 245 | 37921 | 232.93 | 835 | 814 | 159.3 |
| C | 3 | 233 | 1142574 | 6065.12 | 818 | 823 | 188.2 |
| C | 14 | 238 | 131723 | 695.36 | 818 | 823 | 188.2 |
| C | 2 | 114 | 15147 | 76.09 | 818 | 823 | 188.2 |
| D | 12 | 33 | 2829340 | 15770.77 | 757 | 739 | 179.4 |
| D | 8 | 195 | 2471956 | 13778.19 | 757 | 739 | 179.4 |
| D | 1 | 52 | 173448 | 962.93 | 757 | 739 | 179.4 |
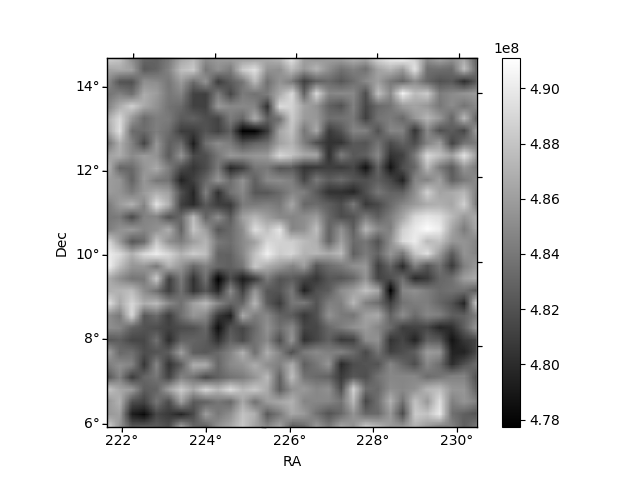
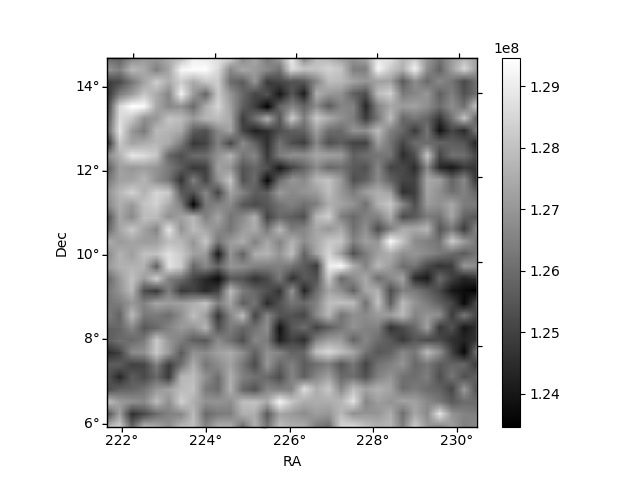
Histogram calculated using DETX and DETY for each event in the final _common_clean file
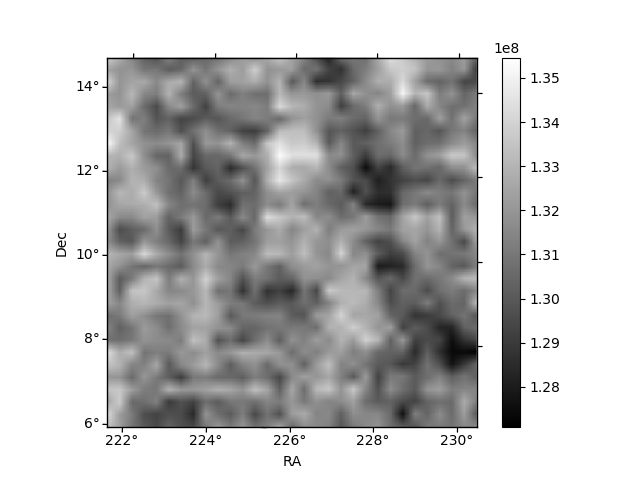
| Quadrant A | 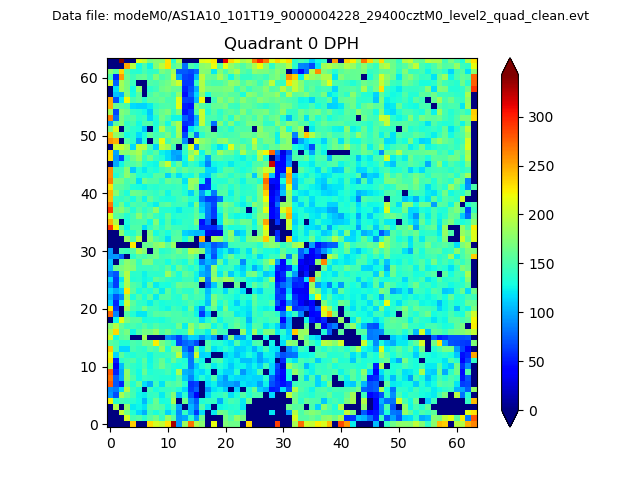 |
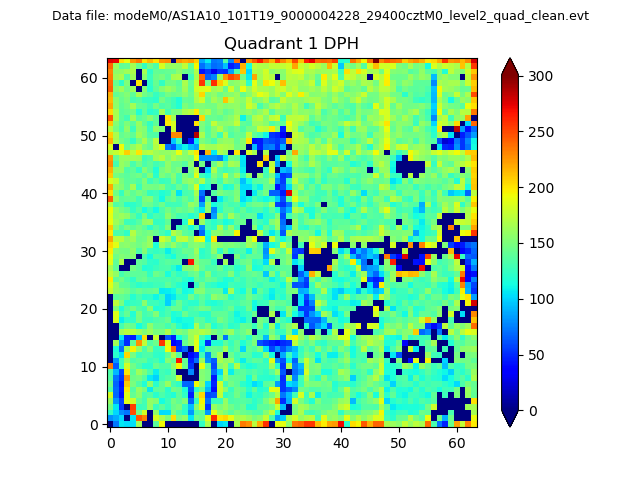 |
Quadrant B |
|---|---|---|---|
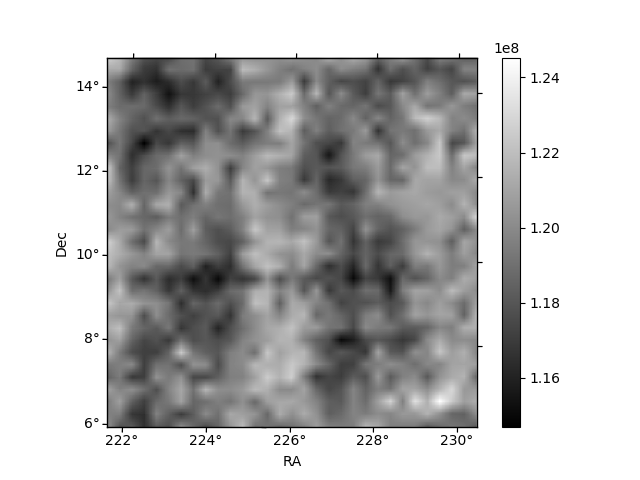
| Quadrant D | 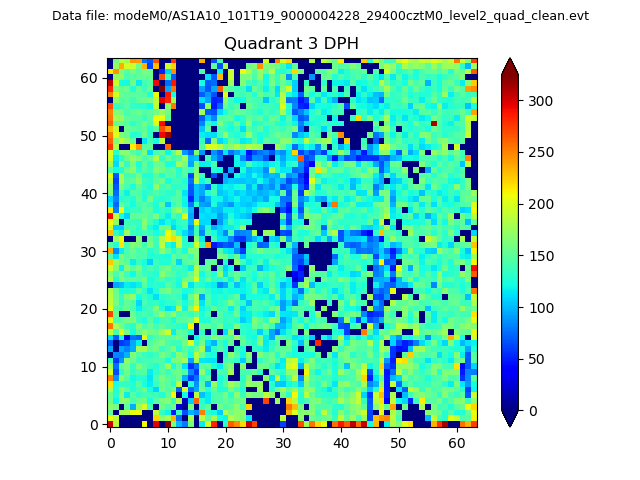 |
 |
Quadrant C |
| Plot type | Count rate plots | Images |
|---|---|---|
| Comparison with Poisson distribution Blue bars denote a histogram of data divided into 1 sec bins. Red curve is a Poisson curve with rate = median count rate of data. |
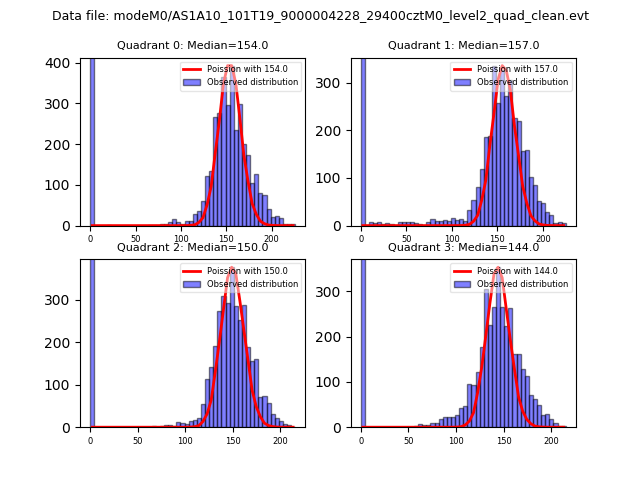 |
 |
| Quadrant-wise count rates Data is divided into 100 sec bins |
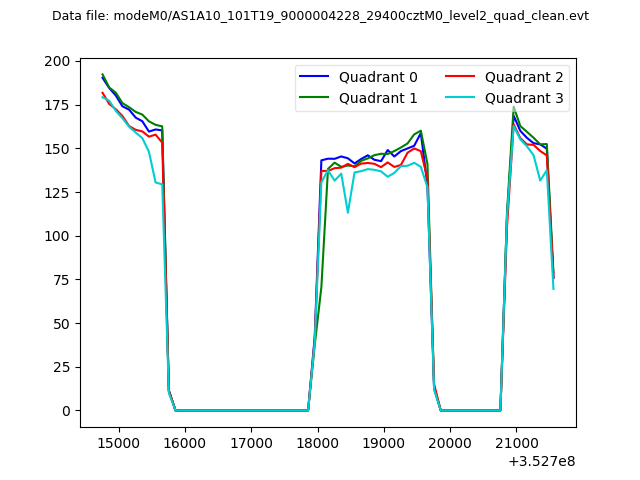 |
|
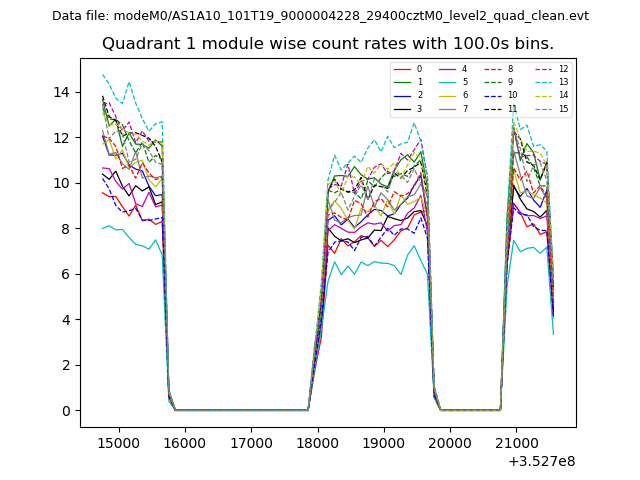
| Module-wise count rates for Quadrant A Data is divided into 100 sec bins |
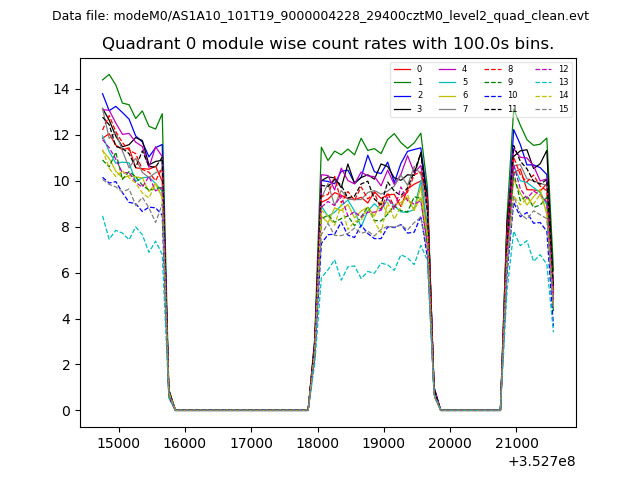 |
 |
| Module-wise count rates for Quadrant B Data is divided into 100 sec bins |
 |
 |
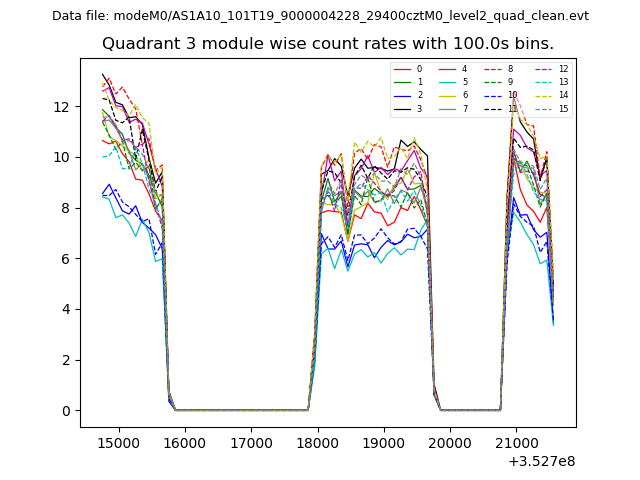
| Module-wise count rates for Quadrant C Data is divided into 100 sec bins |
 |
 |
| Module-wise count rates for Quadrant D Data is divided into 100 sec bins |
 |
 |
| Parameter | Plot |
|---|---|
| CZT HV Monitor | 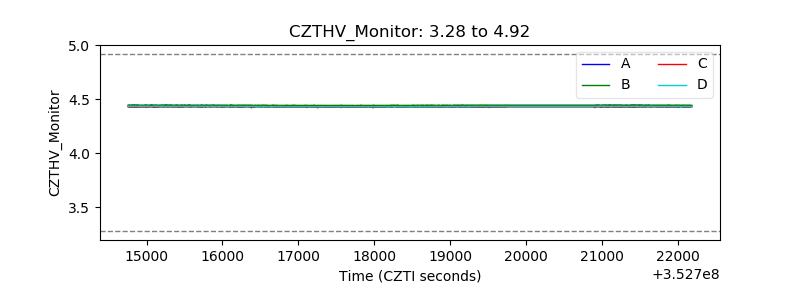 |
| D_VDD | 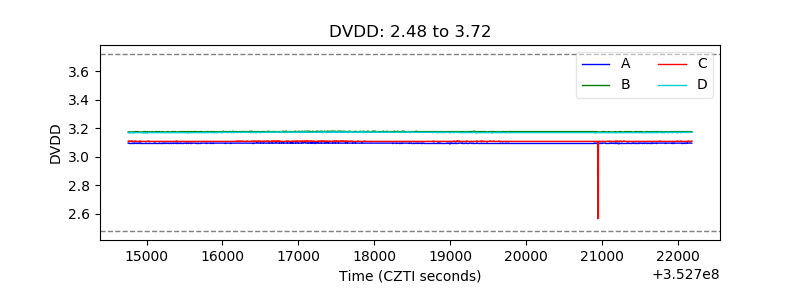 |
| Temperature 1 | 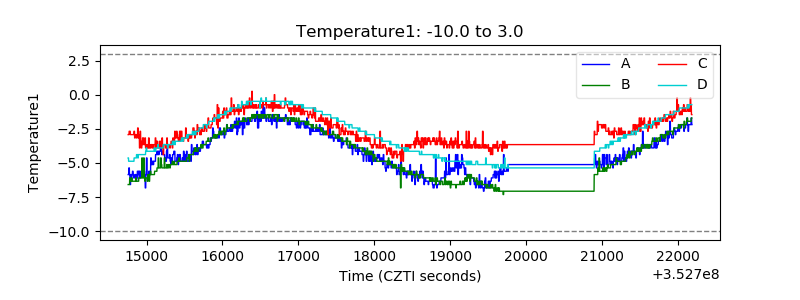 |
| Veto HV Monitor | 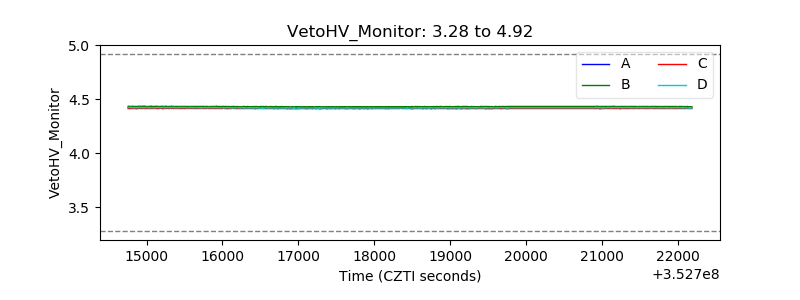 |
| Veto LLD | 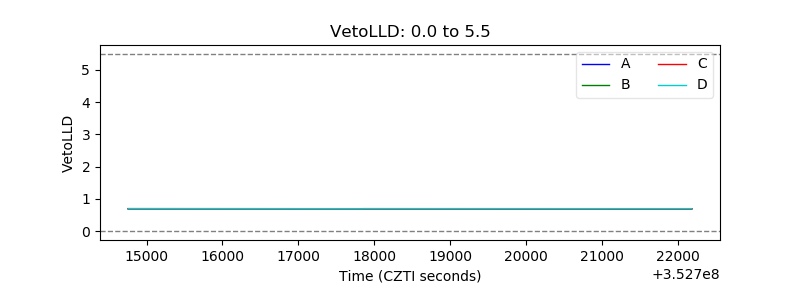 |
| Alpha Counter |  |
| _CPM_Rate | 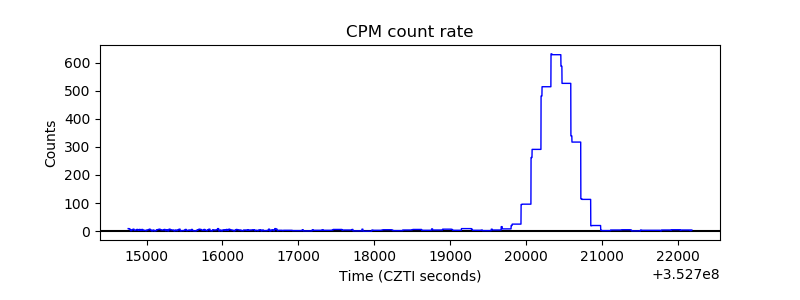 |
| CZT Counter | 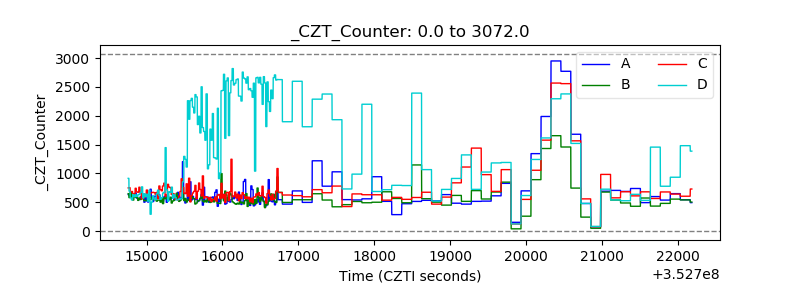 |
| +2.5 Volts monitor | 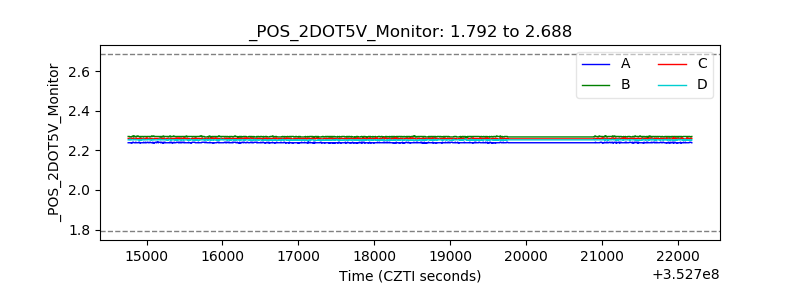 |
| +5 Volts monitor | 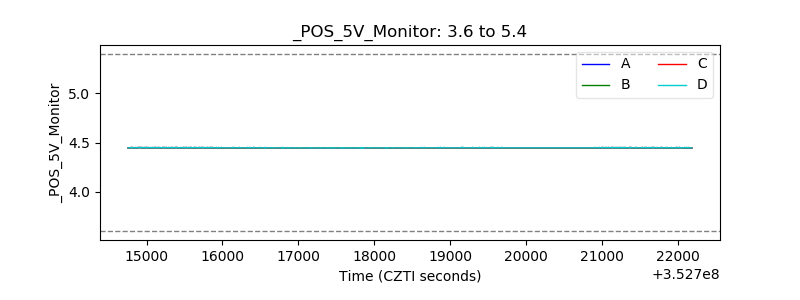 |
| _ROLL_ROT | 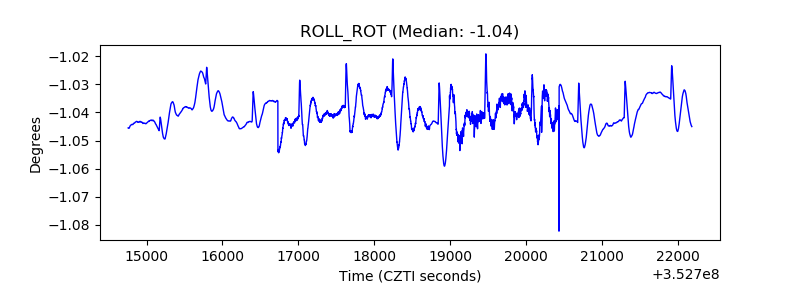 |
| _Roll_DEC | 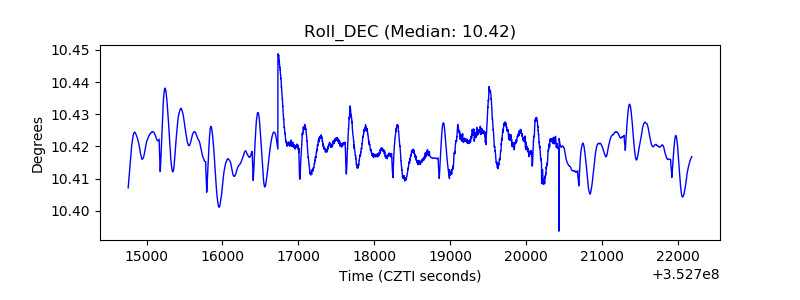 |
| _Roll_RA | 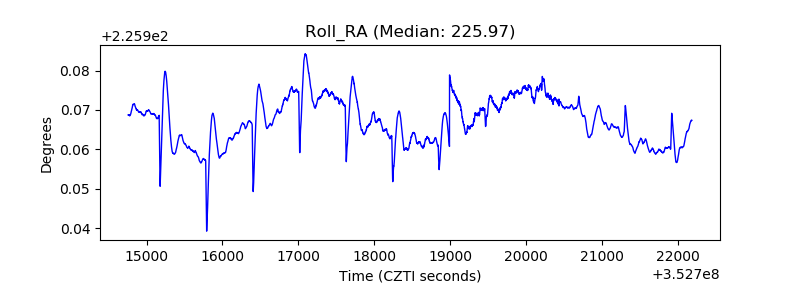 |
| Veto Counter | 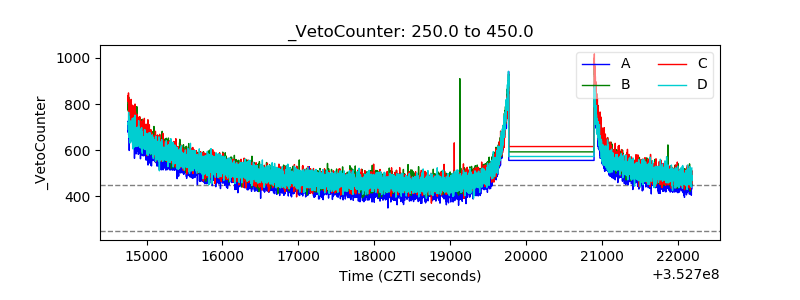 |