| Param | Original file | Final file |
|---|---|---|
| Filename | modeM0/AS1A10_101T19_9000004228_29401cztM0_level2.evt | modeM0/AS1A10_101T19_9000004228_29401cztM0_level2_quad_clean.evt |
| Size (bytes) | 712,010,880 | 76,078,080 |
| Size | 679.0 MB | 72.6 MB |
| Events in quadrant A | 3,740,159 | 466,717 |
| Events in quadrant B | 3,658,894 | 474,964 |
| Events in quadrant C | 4,802,200 | 458,252 |
| Events in quadrant D | 8,897,165 | 423,869 |
| Mode SS | |||
|---|---|---|---|
| Quadrant | BADHDUFLAG | Total packets | Discarded packets |
| A | 0 | 140 | 0 |
| B | 0 | 140 | 0 |
| C | 0 | 140 | 0 |
| D | 0 | 140 | 0 |
| Mode M9 | |||
|---|---|---|---|
| Quadrant | BADHDUFLAG | Total packets | Discarded packets |
| A | 0 | 9 | 0 |
| B | 0 | 9 | 0 |
| C | 0 | 9 | 0 |
| D | 0 | 9 | 0 |
| Mode M0 | |||
|---|---|---|---|
| Quadrant | BADHDUFLAG | Total packets | Discarded packets |
| A | 0 | 15108 | 1 |
| B | 0 | 14784 | 1 |
| C | 0 | 19079 | 1 |
| D | 0 | 31358 | 1 |
| Quadrant | Total seconds | Saturated seconds | Saturation percentage |
|---|---|---|---|
| A | 6881 | 127 | 1.845662% |
| B | 6882 | 123 | 1.787271% |
| C | 6882 | 182 | 2.644580% |
| D | 6882 | 1527 | 22.188317% |
Noise dominated data is calculated using 1-second bins in cleaned event files. If a bin has >2000 counts, and if more than 50% of those come from <1% of pixels, then it is considered to be noise-dominated and hence unusable.
| Quadrant | # 1 sec bins | Bins with >0 counts | Bins with >2000 counts | High rate bins dominated by noise | Noise dominated (total time) | Noise dominated (detector-on time) | Marked lightcurve |
|---|---|---|---|---|---|---|---|
| A | 7751 | 6882 | 4 | 4 | 0.05% | 0.06% | 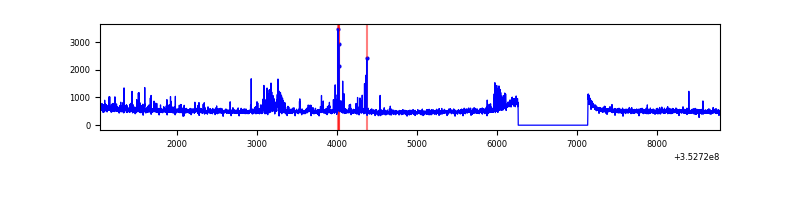 |
| B | 7752 | 6883 | 8 | 8 | 0.10% | 0.12% | 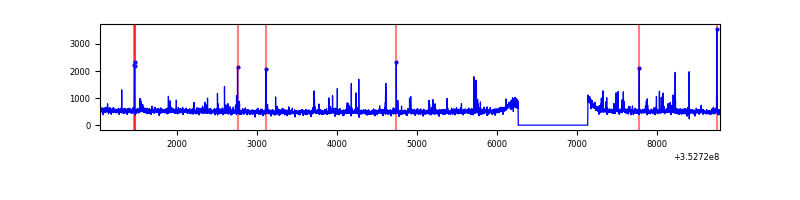 |
| C | 7752 | 6883 | 0 | 0 | 0.00% | 0.00% | 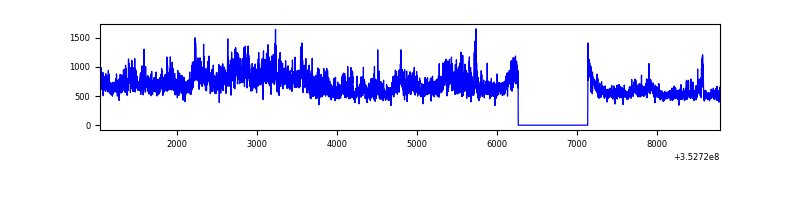 |
| D | 7752 | 6883 | 1184 | 1184 | 15.27% | 17.20% | 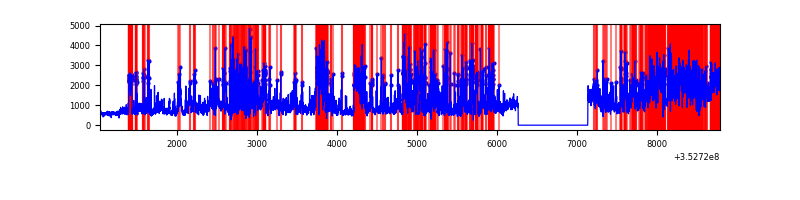 |
Top three noisy pixels from each quadrant. If the there are fewer than three noisy pixels in the level2.evt file, extra rows are filled as -1
| Pixel properties | Quadrant properties | ||||||
|---|---|---|---|---|---|---|---|
| Quadrant | DetID | PixID | Counts | Sigma | Mean | Median | Sigma |
| A | 0 | 13 | 134883 | 739.42 | 900 | 882 | 181.2 |
| A | 1 | 113 | 129862 | 711.71 | 900 | 882 | 181.2 |
| A | 13 | 254 | 14142 | 73.17 | 900 | 882 | 181.2 |
| B | 0 | 229 | 91282 | 528.77 | 885 | 865 | 171.0 |
| B | 10 | 245 | 44528 | 255.35 | 885 | 865 | 171.0 |
| B | 12 | 111 | 20867 | 116.97 | 885 | 865 | 171.0 |
| C | 3 | 233 | 1288698 | 6454.56 | 856 | 860 | 199.5 |
| C | 14 | 238 | 139299 | 693.85 | 856 | 860 | 199.5 |
| C | 4 | 222 | 18848 | 90.15 | 856 | 860 | 199.5 |
| D | 8 | 195 | 2772108 | 14108.62 | 815 | 793 | 196.4 |
| D | 12 | 33 | 1736277 | 8835.26 | 815 | 793 | 196.4 |
| D | 1 | 52 | 594729 | 3023.7 | 815 | 793 | 196.4 |
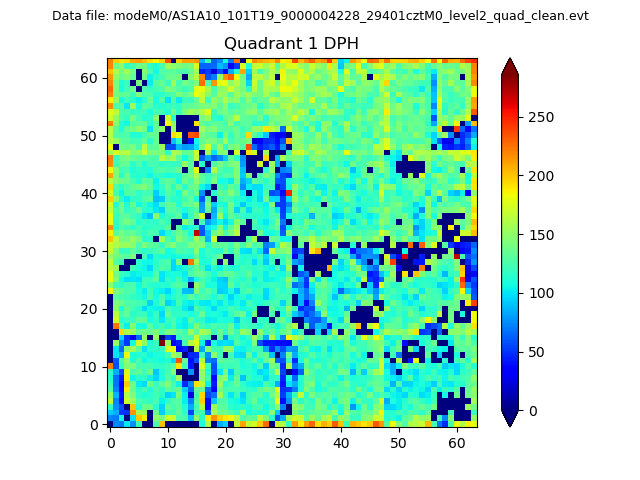
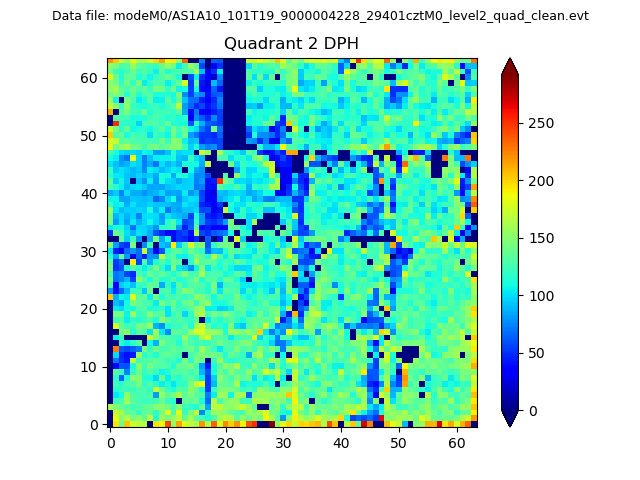
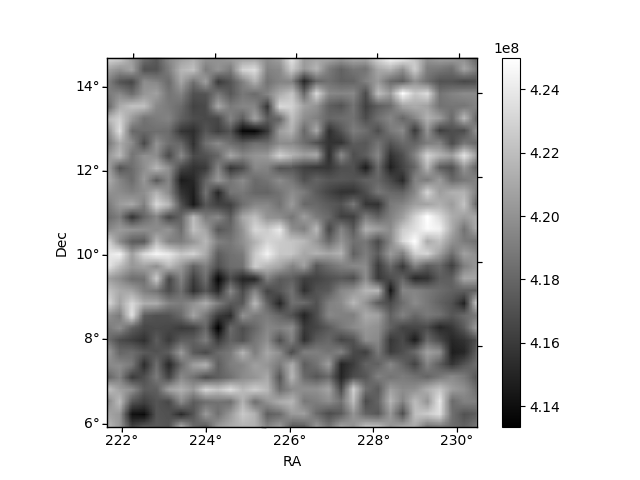
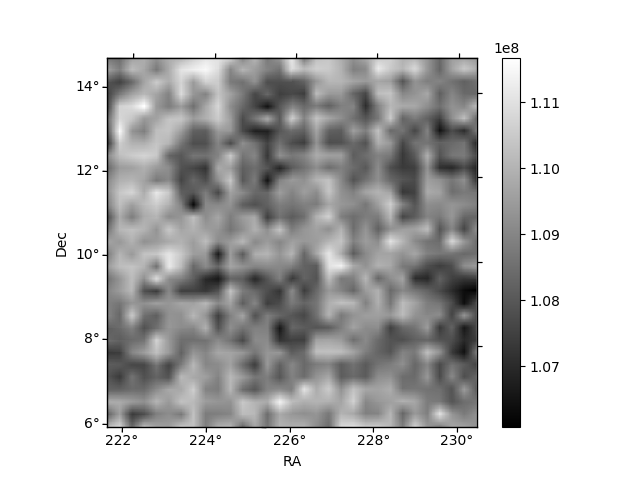
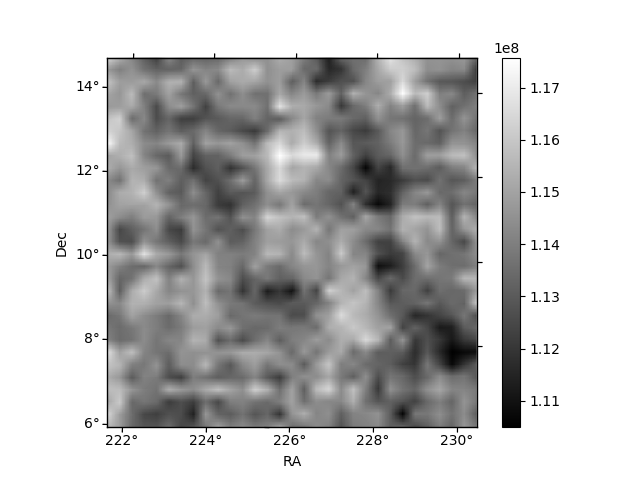
Histogram calculated using DETX and DETY for each event in the final _common_clean file
| Quadrant A |  |
 |
Quadrant B |
|---|---|---|---|
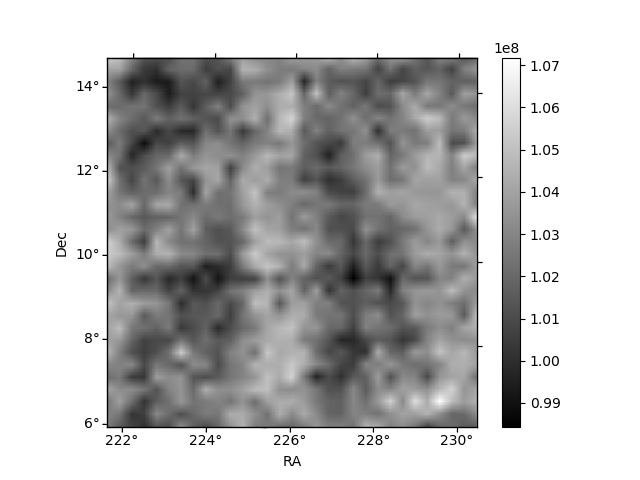
| Quadrant D | 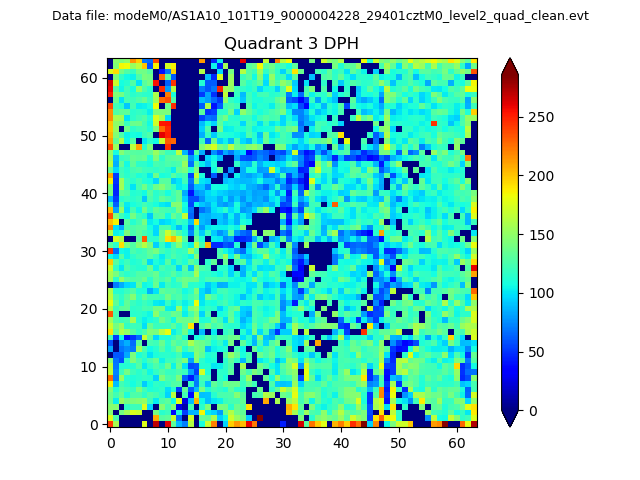 |
 |
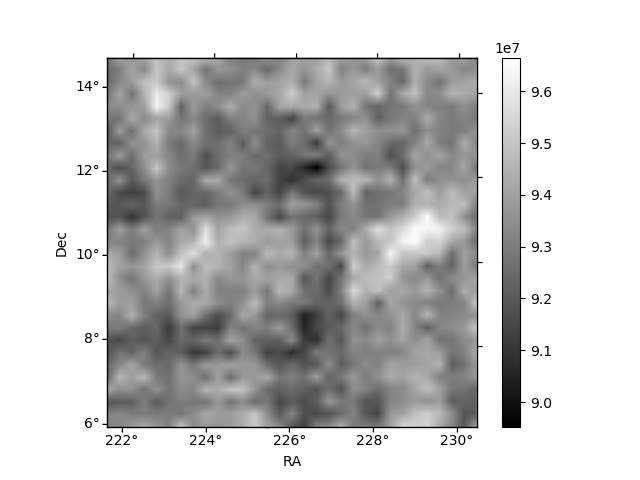
Quadrant C |
| Plot type | Count rate plots | Images |
|---|---|---|
| Comparison with Poisson distribution Blue bars denote a histogram of data divided into 1 sec bins. Red curve is a Poisson curve with rate = median count rate of data. |
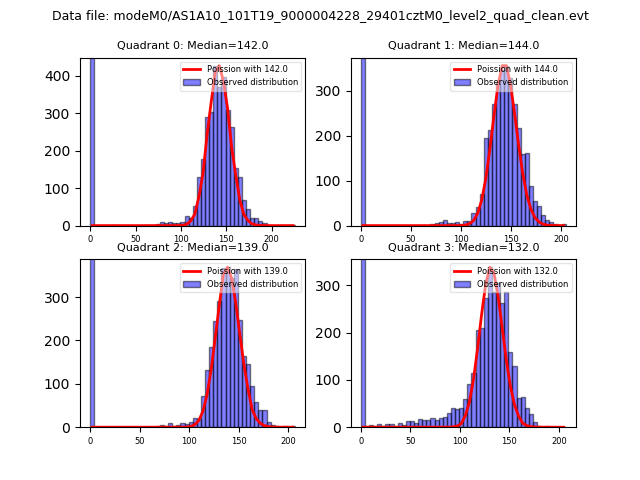 |
 |
| Quadrant-wise count rates Data is divided into 100 sec bins |
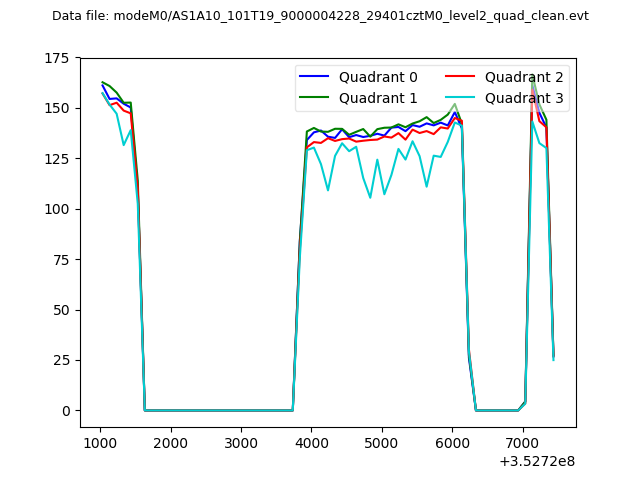 |
|
| Module-wise count rates for Quadrant A Data is divided into 100 sec bins |
 |
 |
| Module-wise count rates for Quadrant B Data is divided into 100 sec bins |
 |
 |
| Module-wise count rates for Quadrant C Data is divided into 100 sec bins |
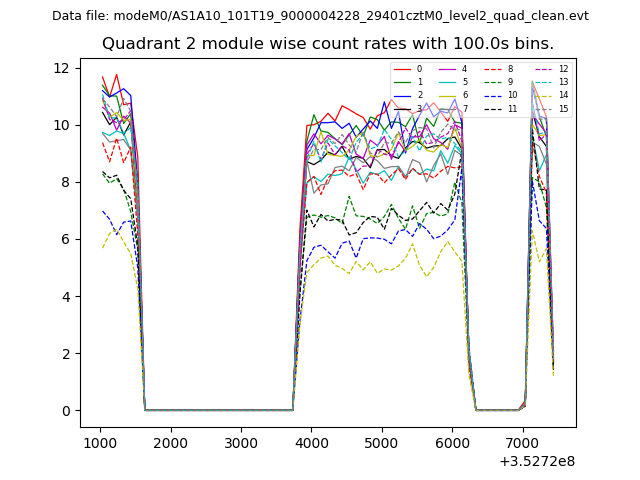 |
 |
| Module-wise count rates for Quadrant D Data is divided into 100 sec bins |
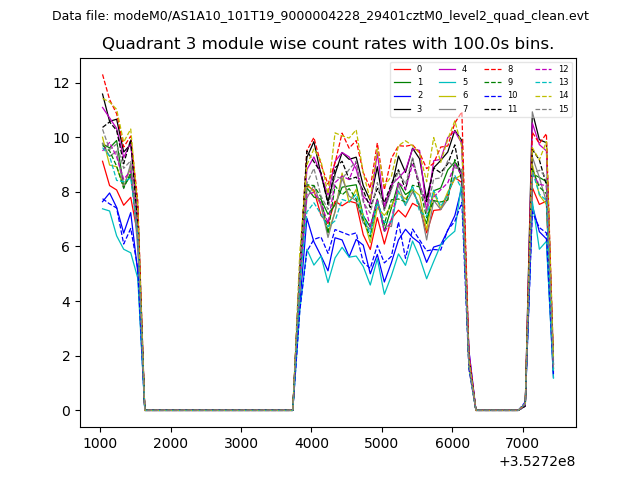 |
 |
| Parameter | Plot |
|---|---|
| CZT HV Monitor | 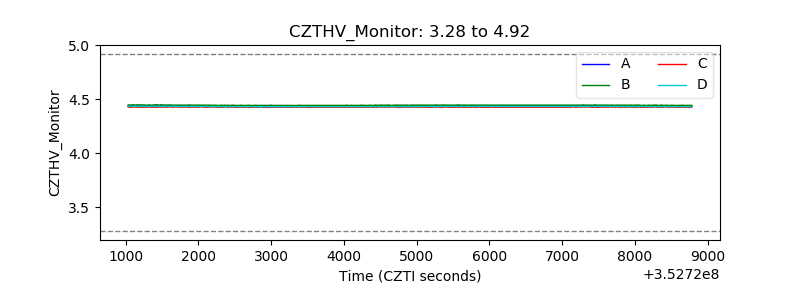 |
| D_VDD | 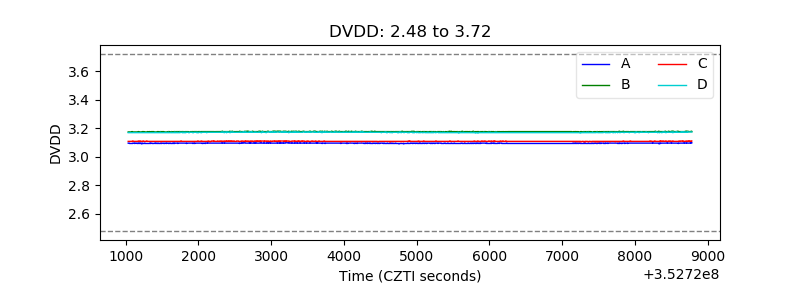 |
| Temperature 1 | 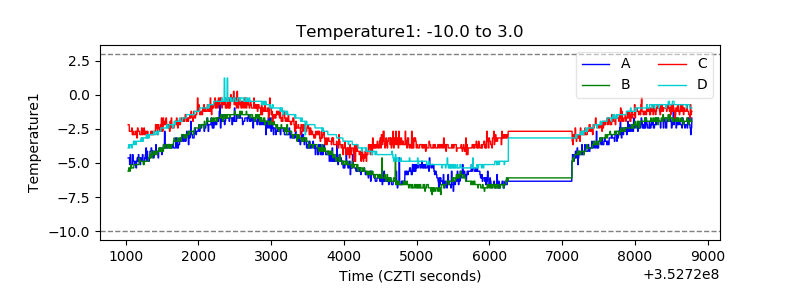 |
| Veto HV Monitor | 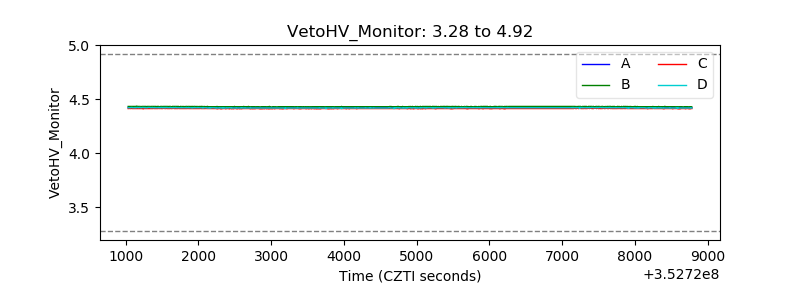 |
| Veto LLD |  |
| Alpha Counter | 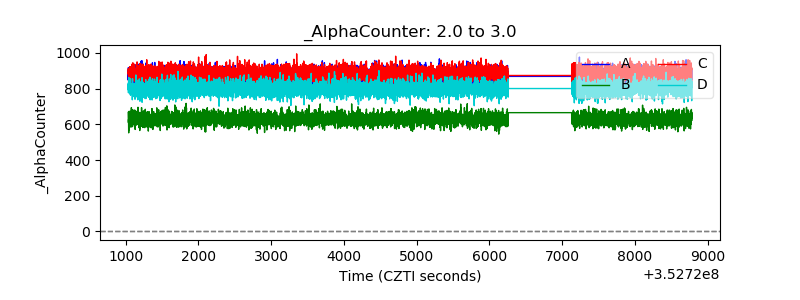 |
| _CPM_Rate | 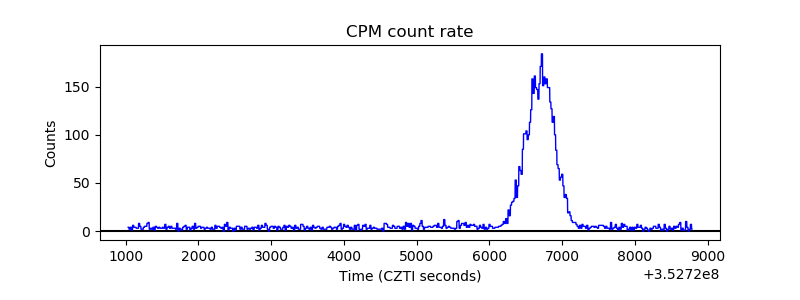 |
| CZT Counter | 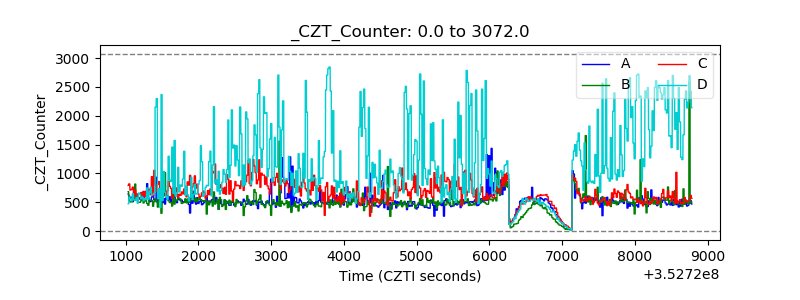 |
| +2.5 Volts monitor |  |
| +5 Volts monitor |  |
| _ROLL_ROT | 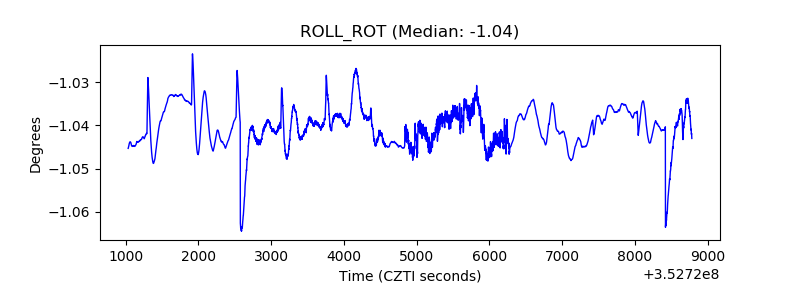 |
| _Roll_DEC | 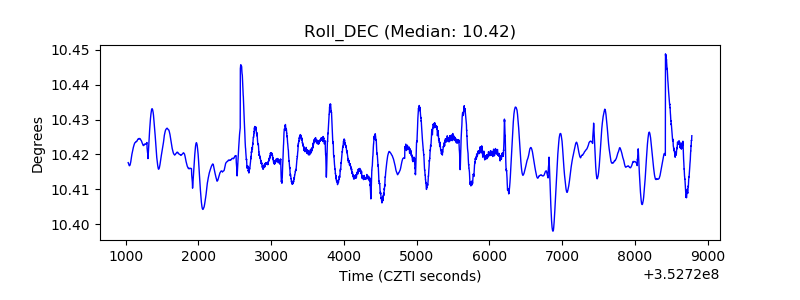 |
| _Roll_RA | 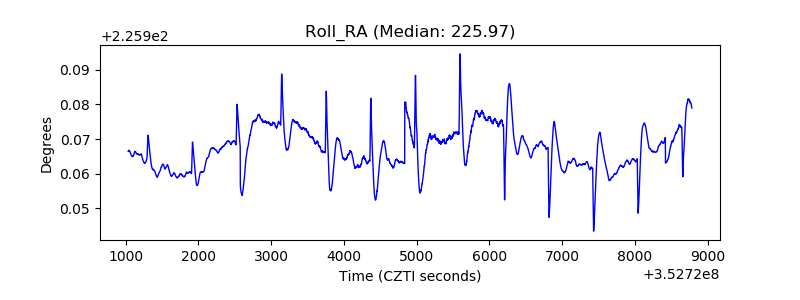 |
| Veto Counter | 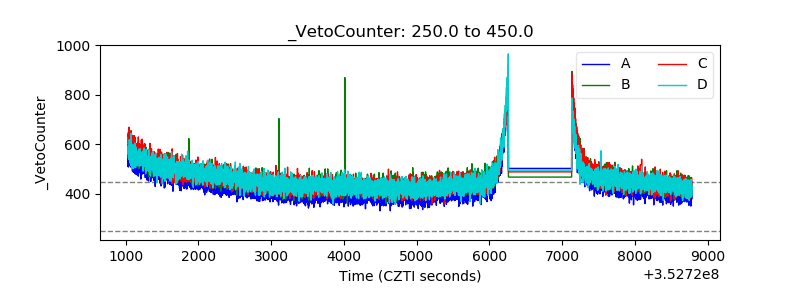 |