| Param | Original file | Final file |
|---|---|---|
| Filename | modeM0/AS1A10_101T19_9000004228_29402cztM0_level2.evt | modeM0/AS1A10_101T19_9000004228_29402cztM0_level2_quad_clean.evt |
| Size (bytes) | 840,467,520 | 76,803,840 |
| Size | 801.5 MB | 73.2 MB |
| Events in quadrant A | 4,771,282 | 461,535 |
| Events in quadrant B | 4,187,338 | 474,646 |
| Events in quadrant C | 4,898,196 | 458,771 |
| Events in quadrant D | 11,093,557 | 411,010 |
| Mode SS | |||
|---|---|---|---|
| Quadrant | BADHDUFLAG | Total packets | Discarded packets |
| A | 0 | 150 | 0 |
| B | 0 | 150 | 0 |
| C | 0 | 150 | 0 |
| D | 0 | 150 | 0 |
| Mode M9 | |||
|---|---|---|---|
| Quadrant | BADHDUFLAG | Total packets | Discarded packets |
| A | 0 | 7 | 0 |
| B | 0 | 8 | 0 |
| C | 0 | 8 | 0 |
| D | 0 | 8 | 0 |
| Mode M0 | |||
|---|---|---|---|
| Quadrant | BADHDUFLAG | Total packets | Discarded packets |
| A | 0 | 18760 | 2 |
| B | 0 | 16990 | 2 |
| C | 0 | 19498 | 2 |
| D | 0 | 38181 | 2 |
| Quadrant | Total seconds | Saturated seconds | Saturation percentage |
|---|---|---|---|
| A | 7465 | 368 | 4.929672% |
| B | 7465 | 229 | 3.067649% |
| C | 7465 | 250 | 3.348962% |
| D | 7465 | 2397 | 32.109846% |
Noise dominated data is calculated using 1-second bins in cleaned event files. If a bin has >2000 counts, and if more than 50% of those come from <1% of pixels, then it is considered to be noise-dominated and hence unusable.
| Quadrant | # 1 sec bins | Bins with >0 counts | Bins with >2000 counts | High rate bins dominated by noise | Noise dominated (total time) | Noise dominated (detector-on time) | Marked lightcurve |
|---|---|---|---|---|---|---|---|
| A | 7915 | 7467 | 217 | 217 | 2.74% | 2.91% | 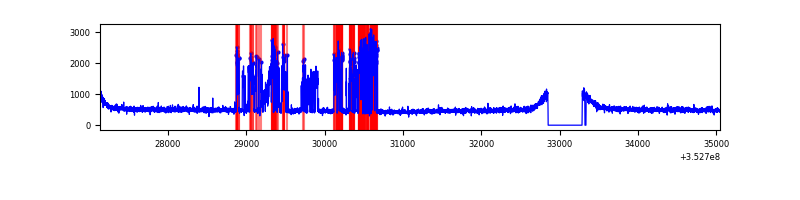 |
| B | 7915 | 7467 | 46 | 46 | 0.58% | 0.62% | 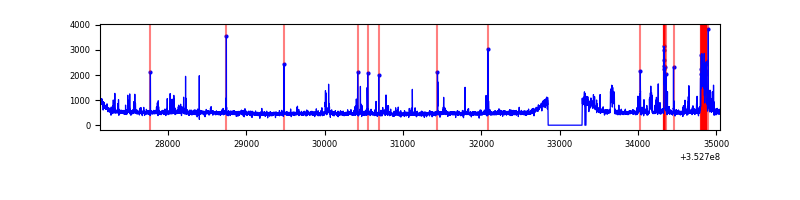 |
| C | 7915 | 7467 | 0 | 0 | 0.00% | 0.00% | 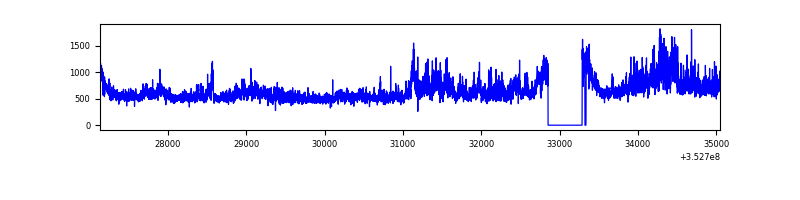 |
| D | 7915 | 7467 | 1908 | 1908 | 24.11% | 25.55% | 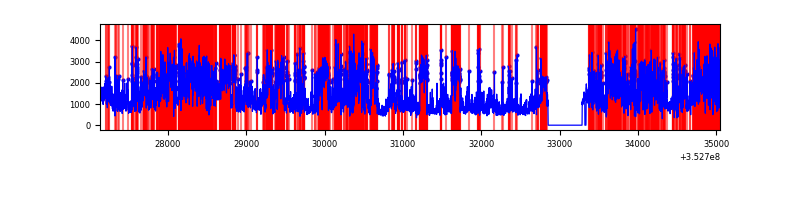 |
Top three noisy pixels from each quadrant. If the there are fewer than three noisy pixels in the level2.evt file, extra rows are filled as -1
| Pixel properties | Quadrant properties | ||||||
|---|---|---|---|---|---|---|---|
| Quadrant | DetID | PixID | Counts | Sigma | Mean | Median | Sigma |
| A | 1 | 113 | 1070446 | 5512.91 | 959 | 939 | 194.0 |
| A | 13 | 254 | 13878 | 66.7 | 959 | 939 | 194.0 |
| A | 3 | 137 | 9438 | 43.81 | 959 | 939 | 194.0 |
| B | 5 | 255 | 234491 | 1264.2 | 945 | 919 | 184.8 |
| B | 0 | 229 | 135842 | 730.27 | 945 | 919 | 184.8 |
| B | 10 | 245 | 64142 | 342.19 | 945 | 919 | 184.8 |
| C | 3 | 233 | 1138677 | 5238.13 | 916 | 921 | 217.2 |
| C | 14 | 238 | 146160 | 668.67 | 916 | 921 | 217.2 |
| C | 4 | 222 | 19471 | 85.4 | 916 | 921 | 217.2 |
| D | 8 | 195 | 4785845 | 23529.99 | 840 | 818 | 203.4 |
| D | 1 | 52 | 1472343 | 7236.11 | 840 | 818 | 203.4 |
| D | 12 | 33 | 1435045 | 7052.7 | 840 | 818 | 203.4 |
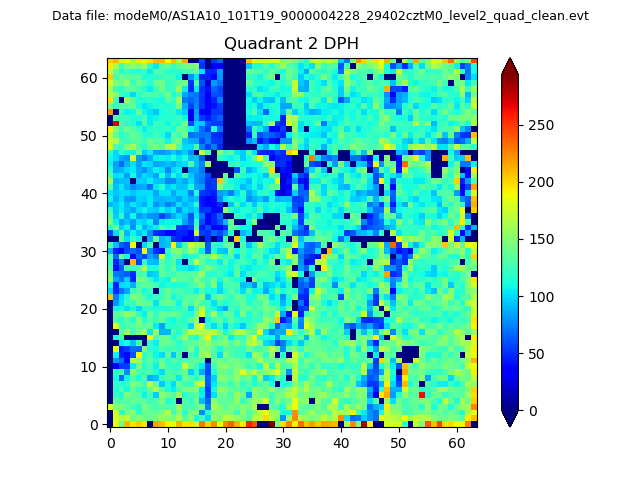
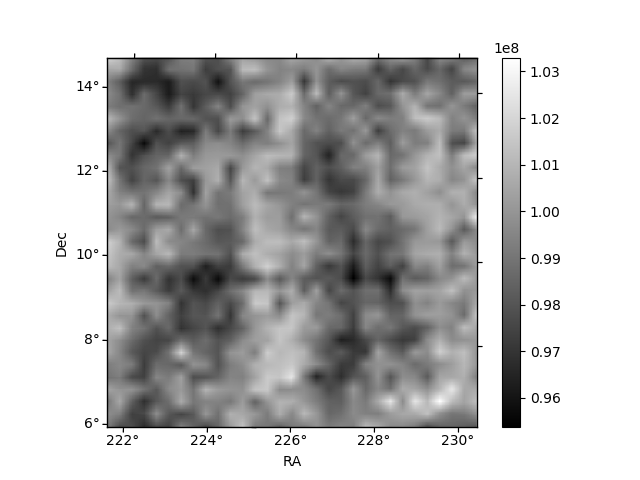
Histogram calculated using DETX and DETY for each event in the final _common_clean file
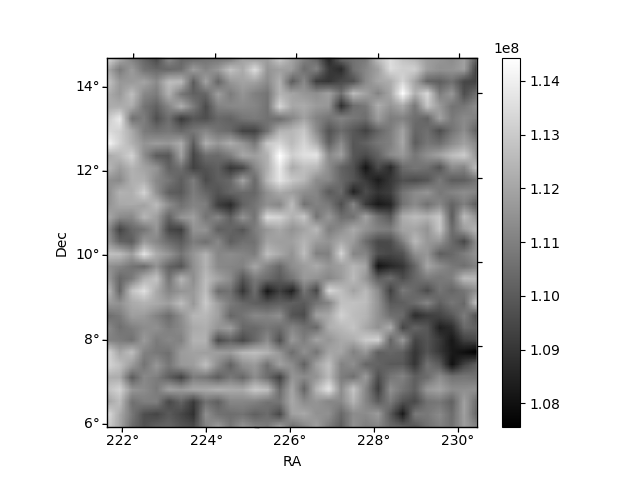
| Quadrant A | 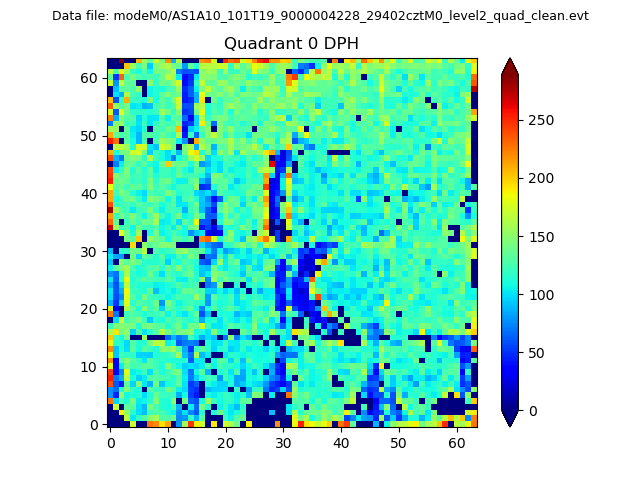 |
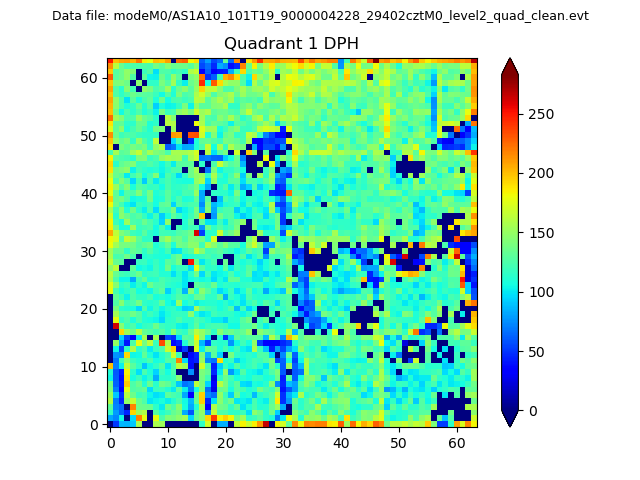 |
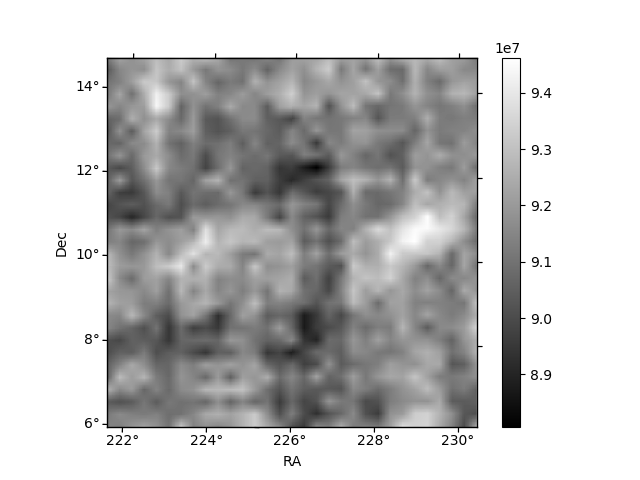
Quadrant B |
|---|---|---|---|
| Quadrant D | 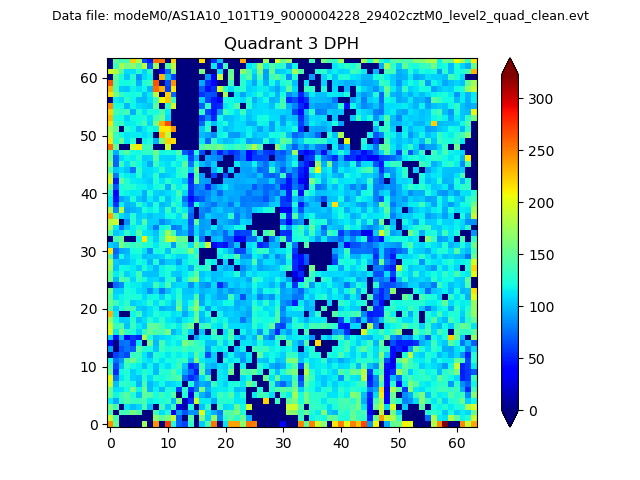 |
 |
Quadrant C |
| Plot type | Count rate plots | Images |
|---|---|---|
| Comparison with Poisson distribution Blue bars denote a histogram of data divided into 1 sec bins. Red curve is a Poisson curve with rate = median count rate of data. |
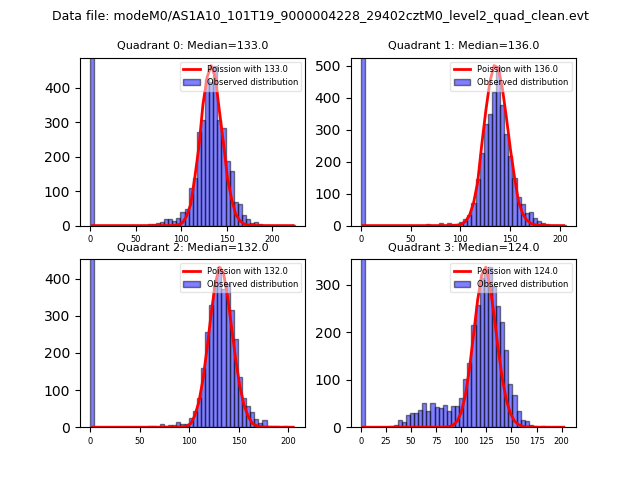 |
 |
| Quadrant-wise count rates Data is divided into 100 sec bins |
 |
|
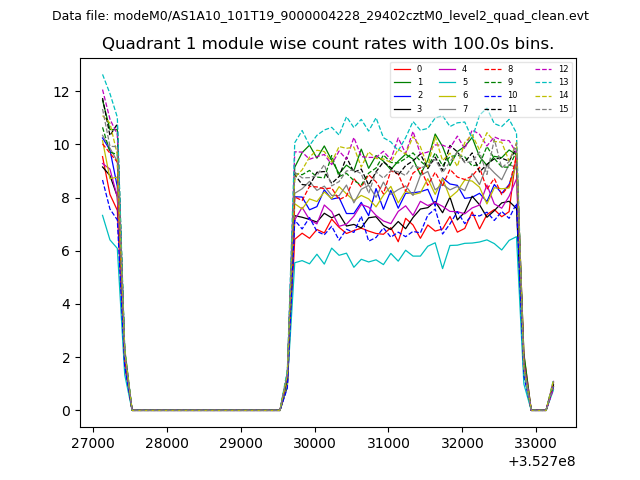
| Module-wise count rates for Quadrant A Data is divided into 100 sec bins |
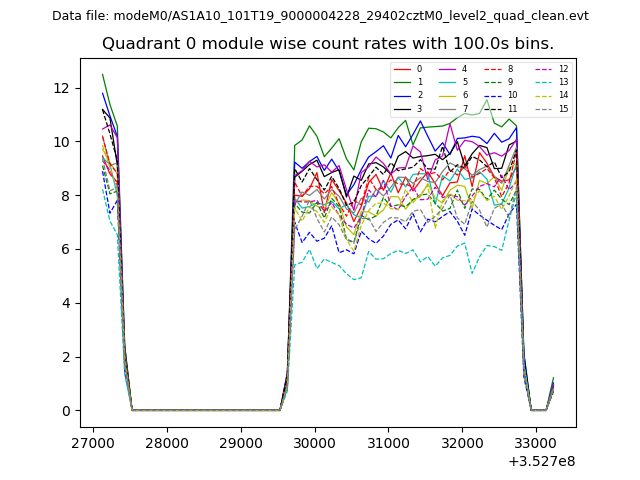 |
 |
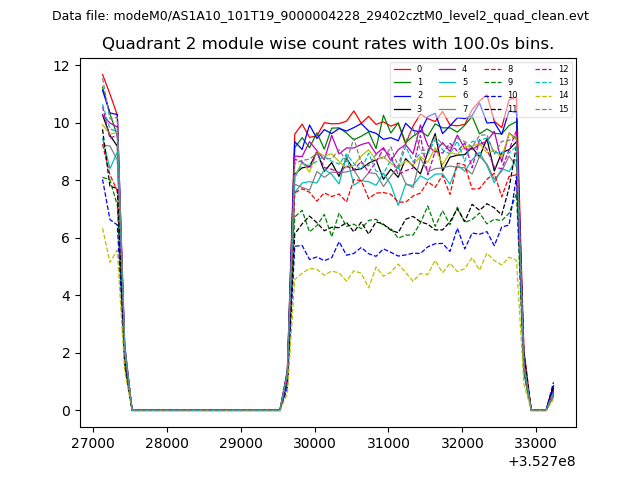
| Module-wise count rates for Quadrant B Data is divided into 100 sec bins |
 |
 |
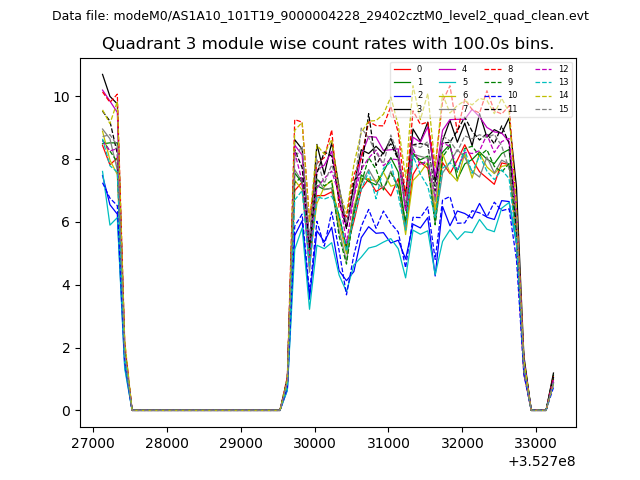
| Module-wise count rates for Quadrant C Data is divided into 100 sec bins |
 |
 |
| Module-wise count rates for Quadrant D Data is divided into 100 sec bins |
 |
 |
| Parameter | Plot |
|---|---|
| CZT HV Monitor | 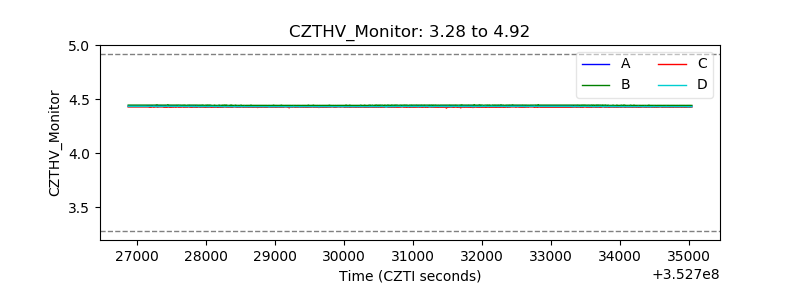 |
| D_VDD | 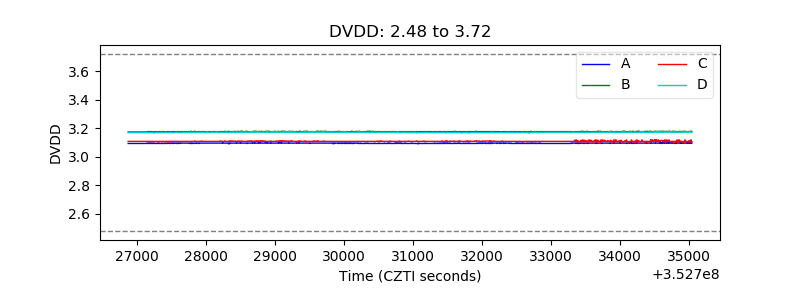 |
| Temperature 1 | 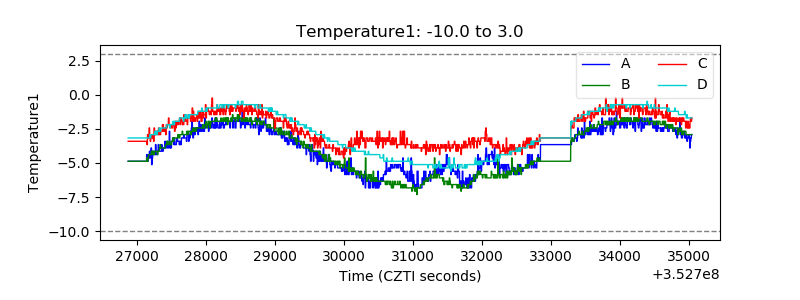 |
| Veto HV Monitor | 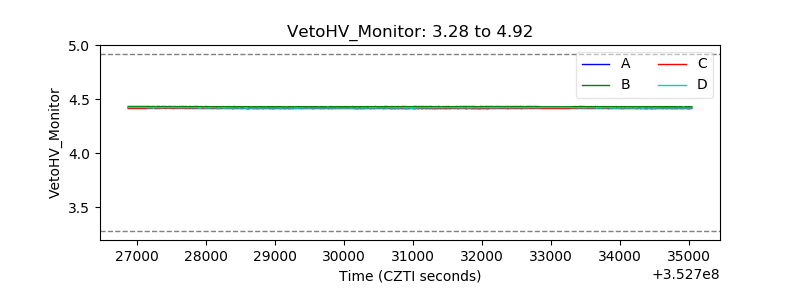 |
| Veto LLD | 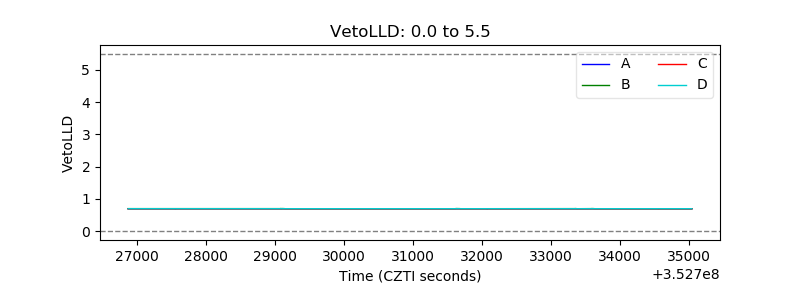 |
| Alpha Counter | 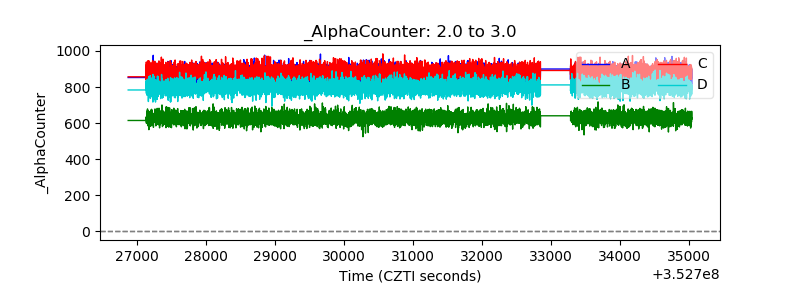 |
| _CPM_Rate |  |
| CZT Counter | 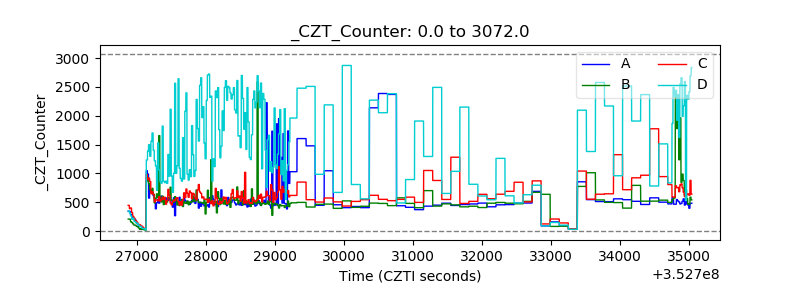 |
| +2.5 Volts monitor |  |
| +5 Volts monitor |  |
| _ROLL_ROT | 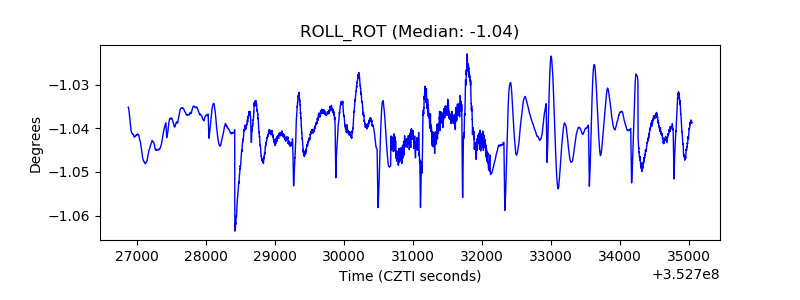 |
| _Roll_DEC | 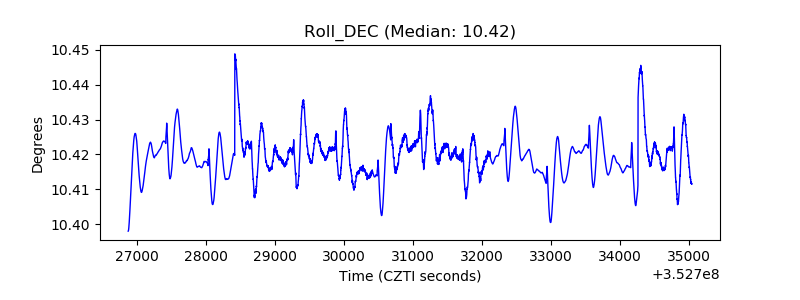 |
| _Roll_RA | 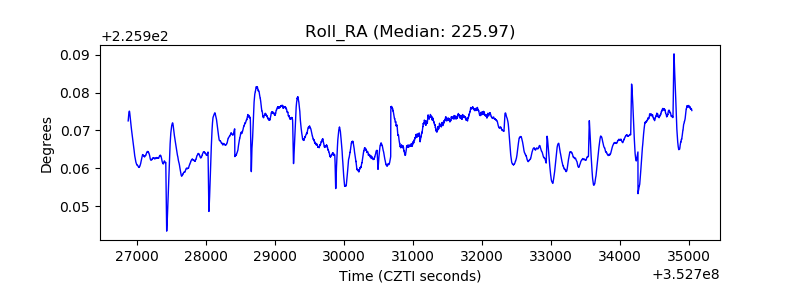 |
| Veto Counter | 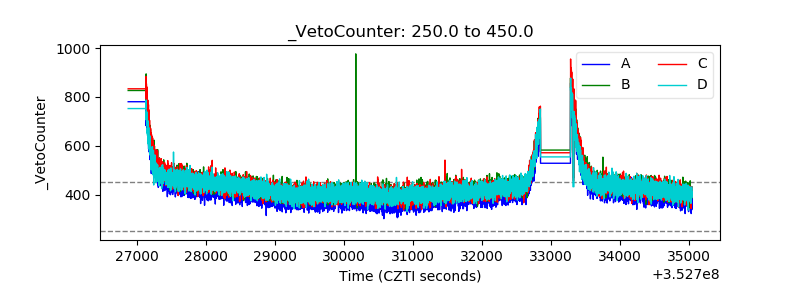 |