| Param | Original file | Final file |
|---|---|---|
| Filename | modeM0/AS1A10_101T19_9000004228_29404cztM0_level2.evt | modeM0/AS1A10_101T19_9000004228_29404cztM0_level2_quad_clean.evt |
| Size (bytes) | 212,253,120 | 15,923,520 |
| Size | 202.4 MB | 15.2 MB |
| Events in quadrant A | 1,010,774 | 85,664 |
| Events in quadrant B | 1,118,250 | 86,259 |
| Events in quadrant C | 1,119,643 | 83,109 |
| Events in quadrant D | 3,033,189 | 72,378 |
| Mode SS | |||
|---|---|---|---|
| Quadrant | BADHDUFLAG | Total packets | Discarded packets |
| A | 0 | 42 | 0 |
| B | 0 | 42 | 0 |
| C | 0 | 42 | 0 |
| D | 0 | 42 | 0 |
| Mode M0 | |||
|---|---|---|---|
| Quadrant | BADHDUFLAG | Total packets | Discarded packets |
| A | 0 | 4277 | 0 |
| B | 0 | 4603 | 0 |
| C | 0 | 4611 | 0 |
| D | 0 | 10499 | 0 |
| Quadrant | Total seconds | Saturated seconds | Saturation percentage |
|---|---|---|---|
| A | 2125 | 4 | 0.188235% |
| B | 2125 | 7 | 0.329412% |
| C | 2125 | 25 | 1.176471% |
| D | 2125 | 517 | 24.329412% |
Noise dominated data is calculated using 1-second bins in cleaned event files. If a bin has >2000 counts, and if more than 50% of those come from <1% of pixels, then it is considered to be noise-dominated and hence unusable.
| Quadrant | # 1 sec bins | Bins with >0 counts | Bins with >2000 counts | High rate bins dominated by noise | Noise dominated (total time) | Noise dominated (detector-on time) | Marked lightcurve |
|---|---|---|---|---|---|---|---|
| A | 2125 | 2125 | 0 | 0 | 0.00% | 0.00% | 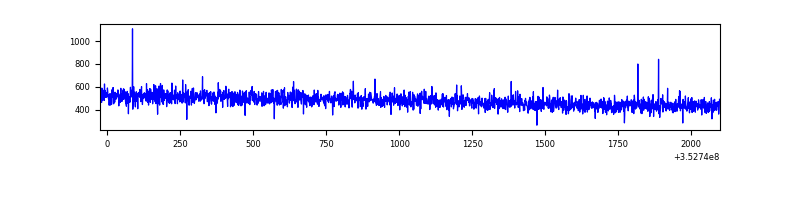 |
| B | 2125 | 2125 | 1 | 1 | 0.05% | 0.05% | 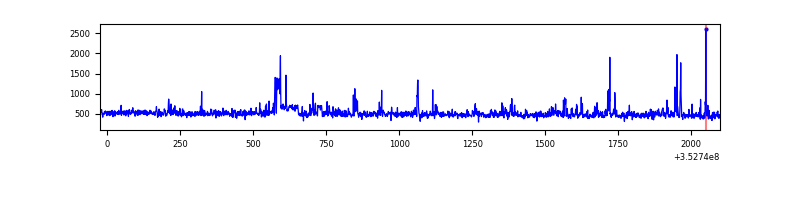 |
| C | 2125 | 2125 | 0 | 0 | 0.00% | 0.00% | 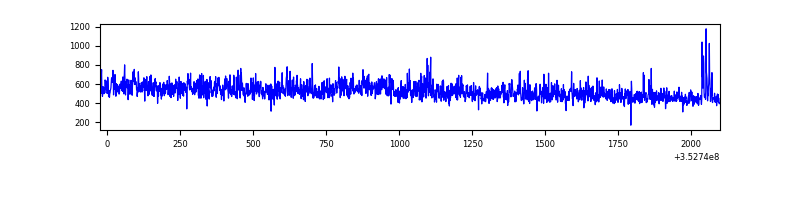 |
| D | 2125 | 2125 | 391 | 391 | 18.40% | 18.40% | 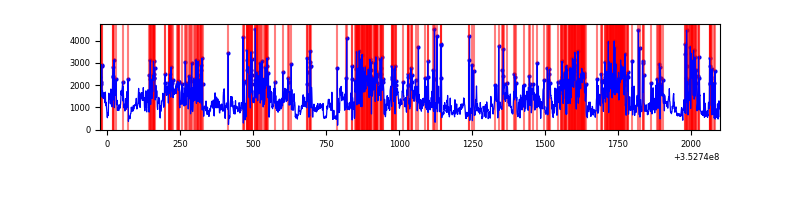 |
Top three noisy pixels from each quadrant. If the there are fewer than three noisy pixels in the level2.evt file, extra rows are filled as -1
| Pixel properties | Quadrant properties | ||||||
|---|---|---|---|---|---|---|---|
| Quadrant | DetID | PixID | Counts | Sigma | Mean | Median | Sigma |
| A | 13 | 254 | 4329 | 73.08 | 261 | 256 | 55.7 |
| A | 1 | 113 | 2911 | 47.64 | 261 | 256 | 55.7 |
| A | 3 | 137 | 2554 | 41.23 | 261 | 256 | 55.7 |
| B | 0 | 229 | 67674 | 1301.52 | 258 | 252 | 51.8 |
| B | 10 | 245 | 14629 | 277.53 | 258 | 252 | 51.8 |
| B | 3 | 209 | 6586 | 122.27 | 258 | 252 | 51.8 |
| C | 3 | 233 | 85031 | 1396.23 | 248 | 249 | 60.7 |
| C | 14 | 238 | 45486 | 744.98 | 248 | 249 | 60.7 |
| C | 4 | 222 | 10242 | 164.57 | 248 | 249 | 60.7 |
| D | 8 | 195 | 1035811 | 17918.72 | 234 | 227 | 57.8 |
| D | 1 | 52 | 853353 | 14761.65 | 234 | 227 | 57.8 |
| D | 12 | 33 | 199003 | 3439.42 | 234 | 227 | 57.8 |
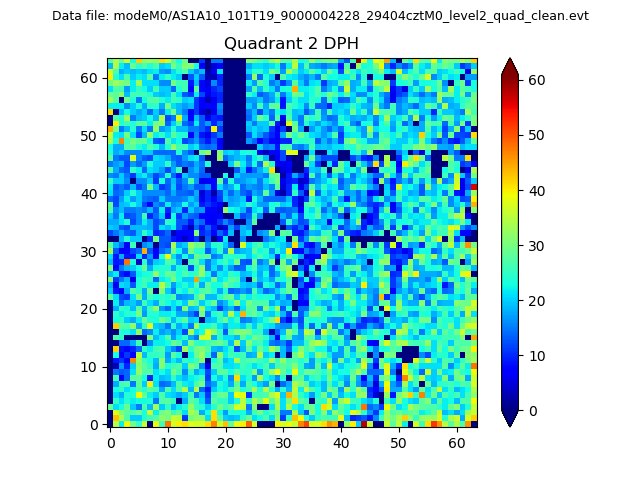
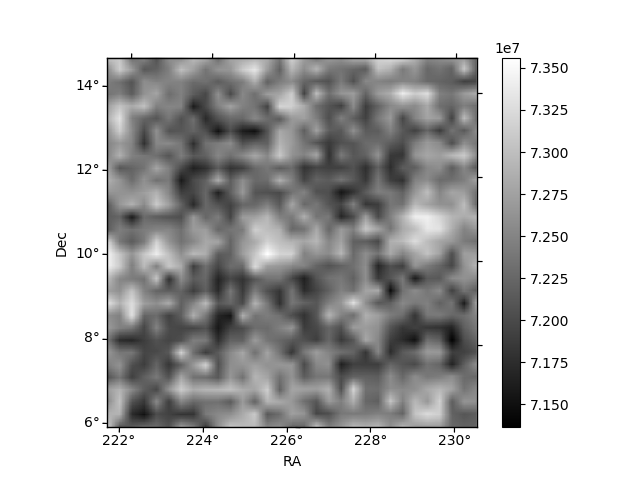
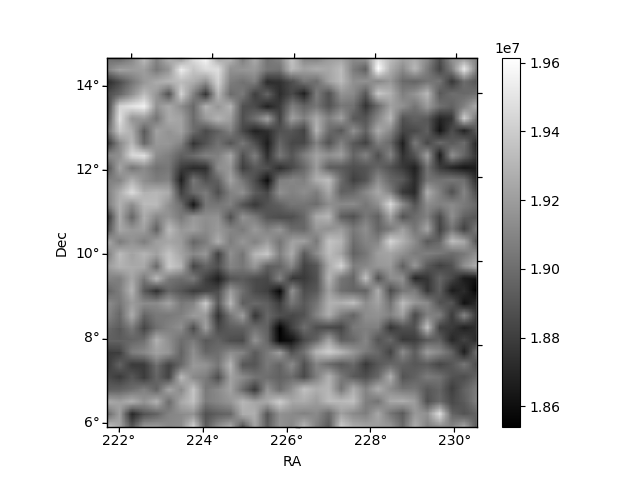
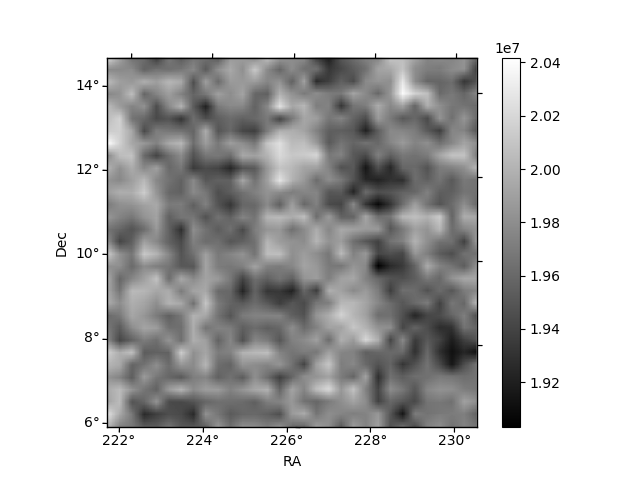
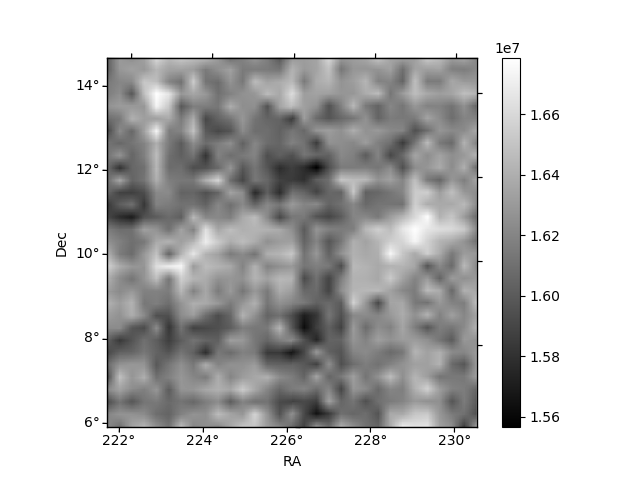
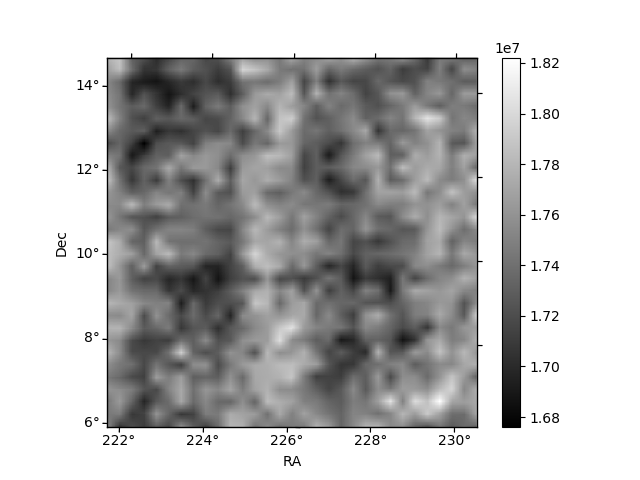
Histogram calculated using DETX and DETY for each event in the final _common_clean file
| Quadrant A | 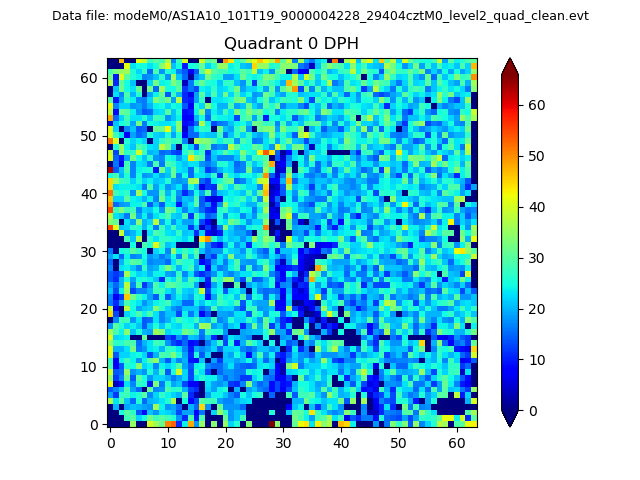 |
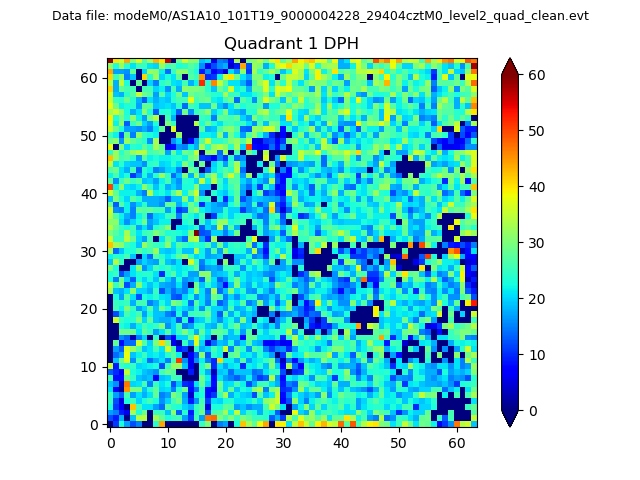 |
Quadrant B |
|---|---|---|---|
| Quadrant D | 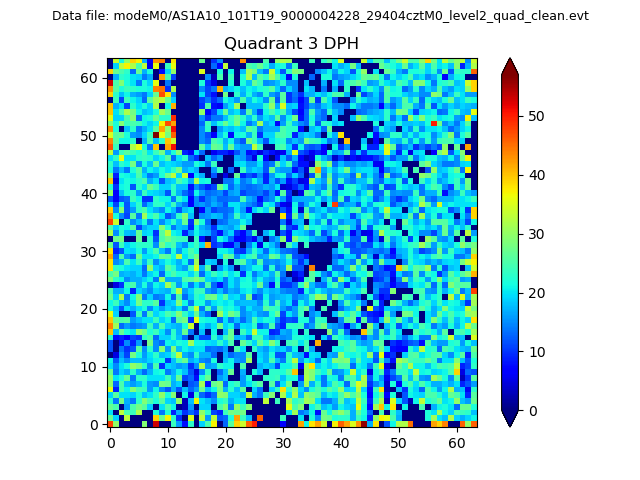 |
 |
Quadrant C |
| Plot type | Count rate plots | Images |
|---|---|---|
| Comparison with Poisson distribution Blue bars denote a histogram of data divided into 1 sec bins. Red curve is a Poisson curve with rate = median count rate of data. |
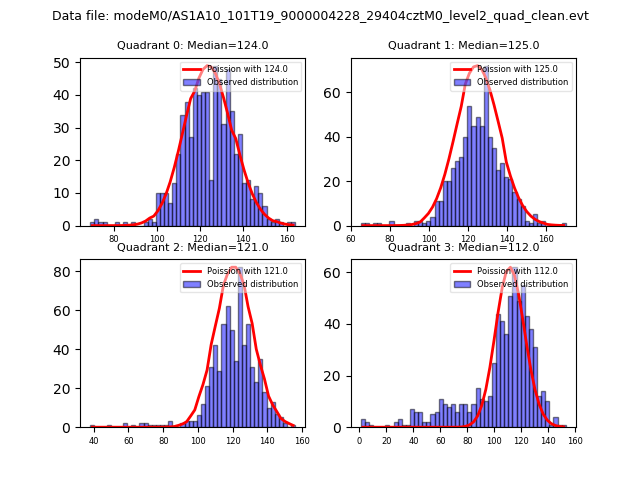 |
 |
| Quadrant-wise count rates Data is divided into 100 sec bins |
 |
|
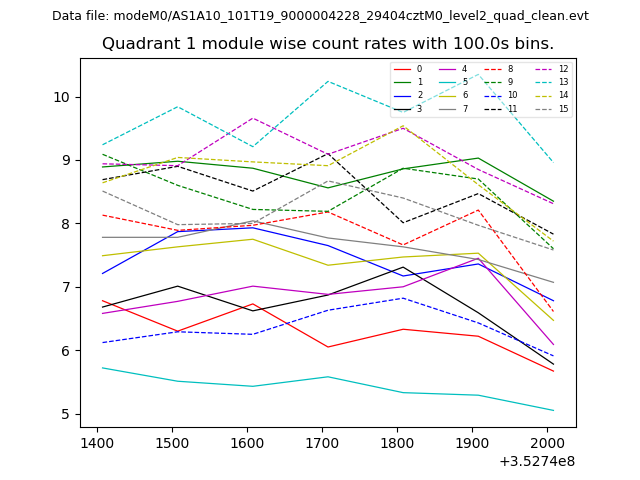
| Module-wise count rates for Quadrant A Data is divided into 100 sec bins |
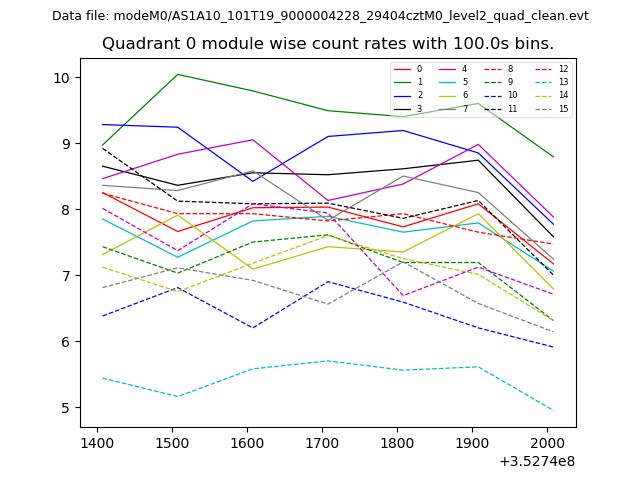 |
 |
| Module-wise count rates for Quadrant B Data is divided into 100 sec bins |
 |
 |
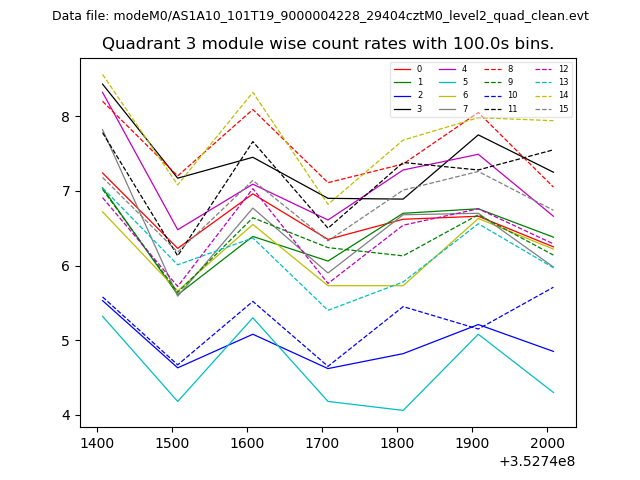
| Module-wise count rates for Quadrant C Data is divided into 100 sec bins |
 |
 |
| Module-wise count rates for Quadrant D Data is divided into 100 sec bins |
 |
 |
| Parameter | Plot |
|---|---|
| CZT HV Monitor | 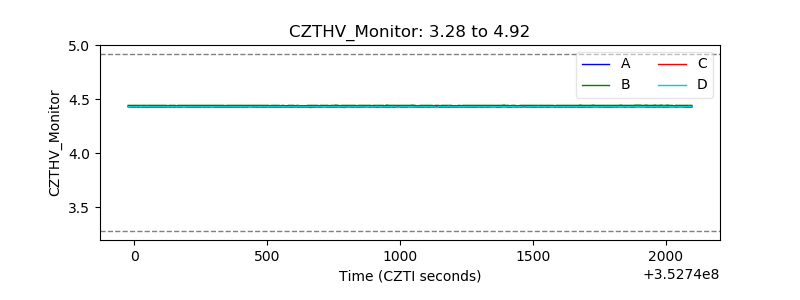 |
| D_VDD | 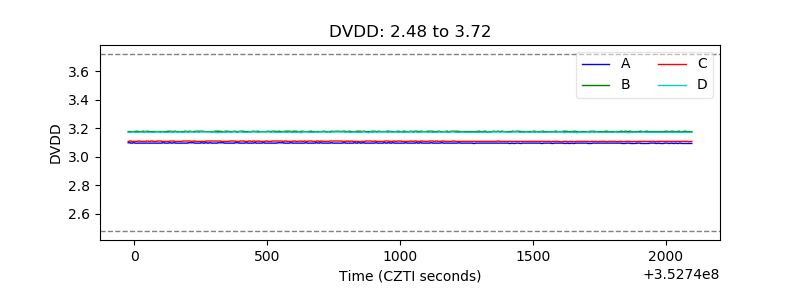 |
| Temperature 1 | 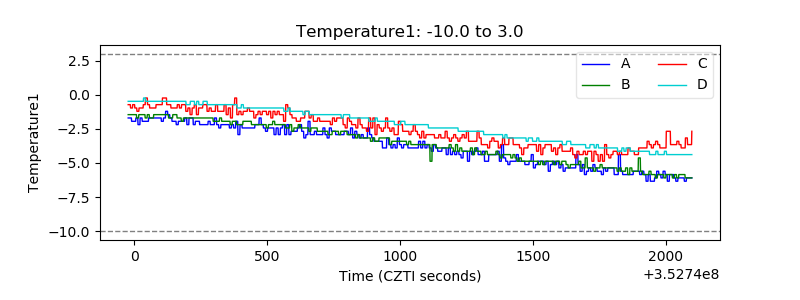 |
| Veto HV Monitor | 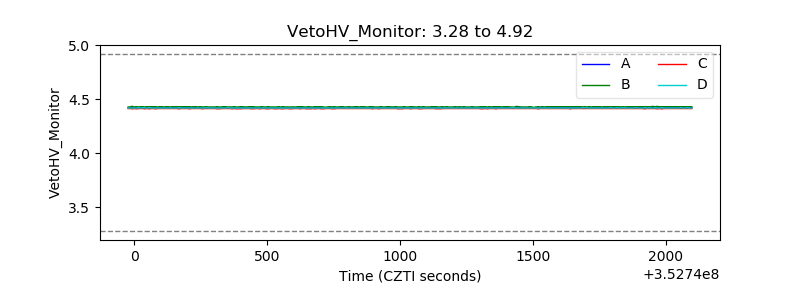 |
| Veto LLD | 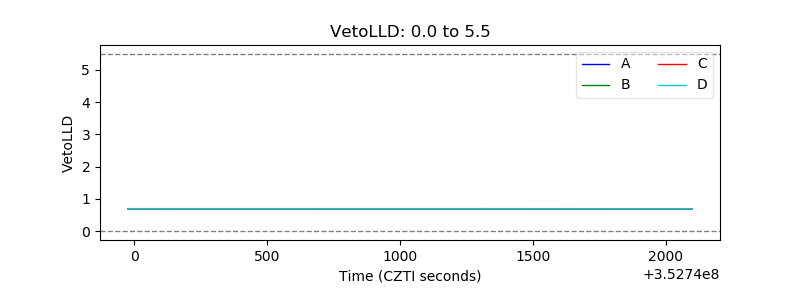 |
| Alpha Counter |  |
| _CPM_Rate | 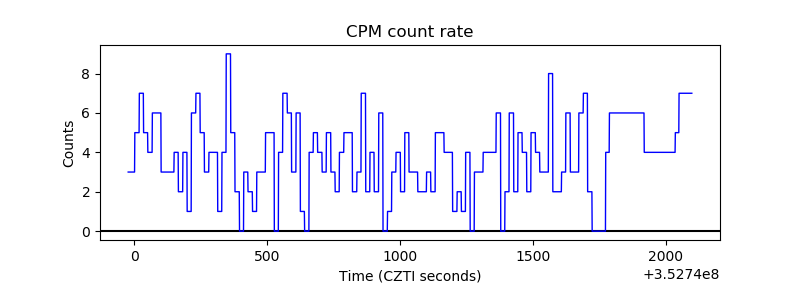 |
| CZT Counter | 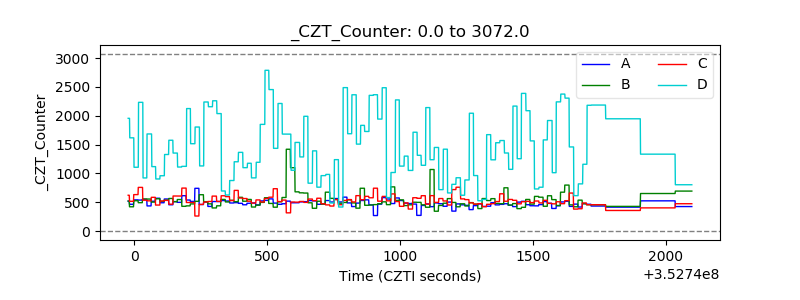 |
| +2.5 Volts monitor | 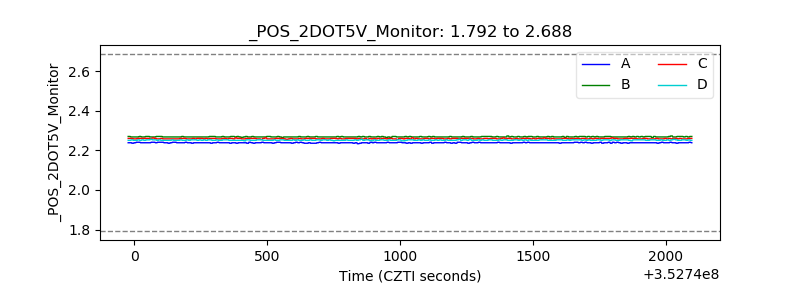 |
| +5 Volts monitor |  |
| _ROLL_ROT | 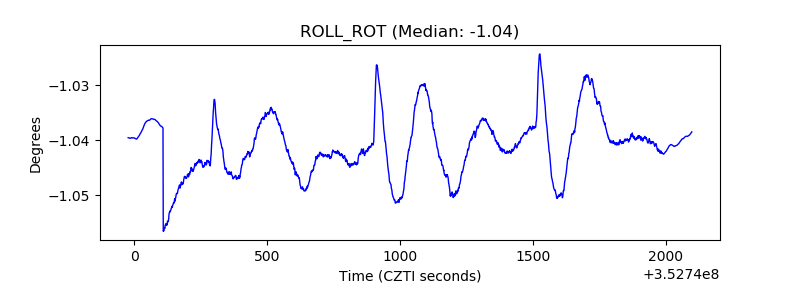 |
| _Roll_DEC | 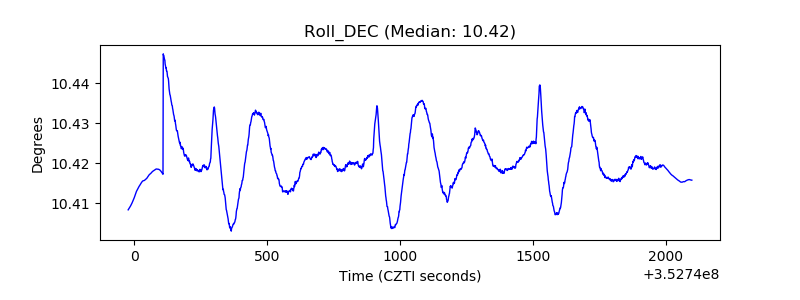 |
| _Roll_RA | 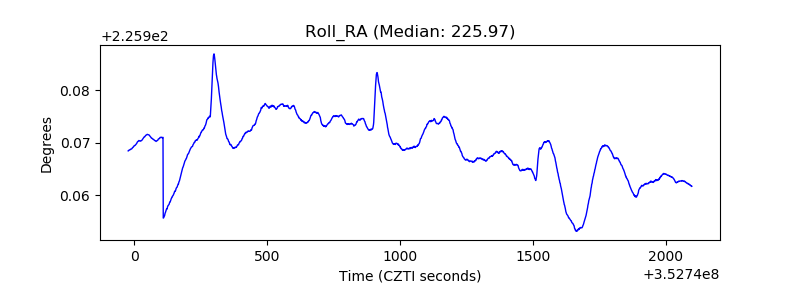 |
| Veto Counter | 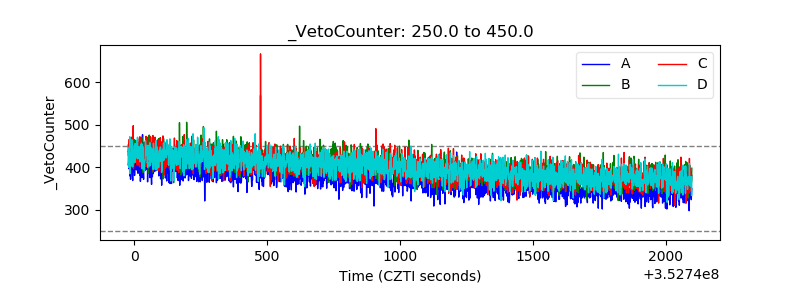 |