| Param | Original file | Final file |
|---|---|---|
| Filename | modeM0/AS1A10_101T19_9000004228_29575cztM0_level2.evt | modeM0/AS1A10_101T19_9000004228_29575cztM0_level2_quad_clean.evt |
| Size (bytes) | 25,876,800 | 8,052,480 |
| Size | 24.7 MB | 7.7 MB |
| Events in quadrant A | 180,421 | 52,217 |
| Events in quadrant B | 201,996 | 52,850 |
| Events in quadrant C | 194,242 | 50,003 |
| Events in quadrant D | 174,791 | 50,878 |
| Mode SS | |||
|---|---|---|---|
| Quadrant | BADHDUFLAG | Total packets | Discarded packets |
| A | 0 | 16 | 8 |
| B | 0 | 16 | 8 |
| C | 0 | 15 | 4 |
| D | 0 | 16 | 8 |
| Mode M0 | |||
|---|---|---|---|
| Quadrant | BADHDUFLAG | Total packets | Discarded packets |
| A | 0 | 1523 | 670 |
| B | 0 | 1847 | 976 |
| C | 0 | 1610 | 731 |
| D | 0 | 1520 | 682 |
| Quadrant | Total seconds | Saturated seconds | Saturation percentage |
|---|---|---|---|
| A | 426 | 1 | 0.234742% |
| B | 416 | 0 | 0.000000% |
| C | 417 | 25 | 5.995204% |
| D | 419 | 0 | 0.000000% |
Noise dominated data is calculated using 1-second bins in cleaned event files. If a bin has >2000 counts, and if more than 50% of those come from <1% of pixels, then it is considered to be noise-dominated and hence unusable.
| Quadrant | # 1 sec bins | Bins with >0 counts | Bins with >2000 counts | High rate bins dominated by noise | Noise dominated (total time) | Noise dominated (detector-on time) | Marked lightcurve |
|---|---|---|---|---|---|---|---|
| A | 702 | 480 | 0 | 0 | 0.00% | 0.00% | 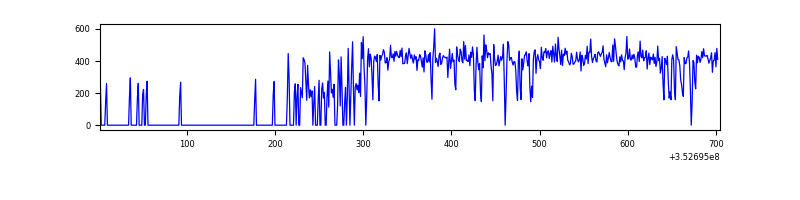 |
| B | 672 | 471 | 0 | 0 | 0.00% | 0.00% | 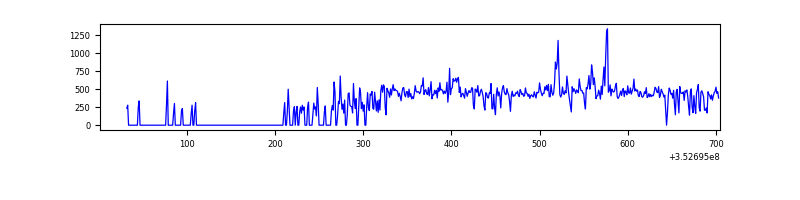 |
| C | 690 | 473 | 0 | 0 | 0.00% | 0.00% | 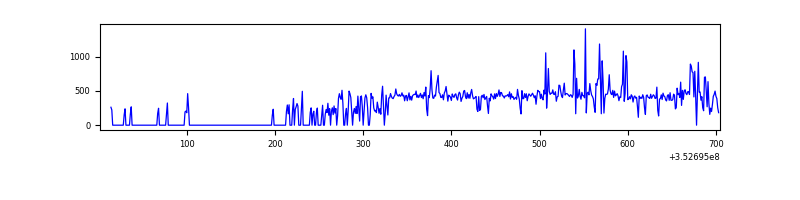 |
| D | 698 | 478 | 0 | 0 | 0.00% | 0.00% | 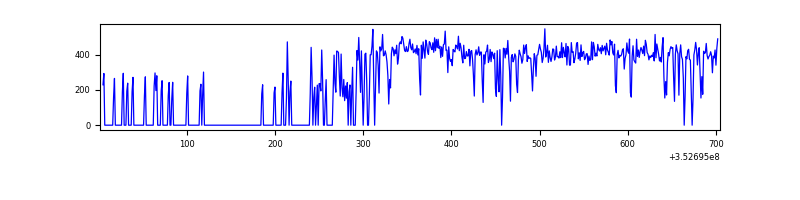 |
Top three noisy pixels from each quadrant. If the there are fewer than three noisy pixels in the level2.evt file, extra rows are filled as -1
| Pixel properties | Quadrant properties | ||||||
|---|---|---|---|---|---|---|---|
| Quadrant | DetID | PixID | Counts | Sigma | Mean | Median | Sigma |
| A | 13 | 254 | 760 | 61.82 | 46 | 45 | 11.6 |
| A | 0 | 13 | 507 | 39.95 | 46 | 45 | 11.6 |
| A | 3 | 137 | 418 | 32.25 | 46 | 45 | 11.6 |
| B | 0 | 189 | 16568 | 1540.45 | 45 | 44 | 10.7 |
| B | 15 | 33 | 8158 | 756.43 | 45 | 44 | 10.7 |
| B | 12 | 111 | 1072 | 95.84 | 45 | 44 | 10.7 |
| C | 14 | 238 | 16766 | 1463.05 | 41 | 41 | 11.4 |
| C | 14 | 254 | 12839 | 1119.53 | 41 | 41 | 11.4 |
| C | 2 | 114 | 947 | 79.25 | 41 | 41 | 11.4 |
| D | 8 | 195 | 10973 | 900.0 | 43 | 41 | 12.1 |
| D | 2 | 234 | 1307 | 104.23 | 43 | 41 | 12.1 |
| D | 12 | 33 | 1247 | 99.29 | 43 | 41 | 12.1 |
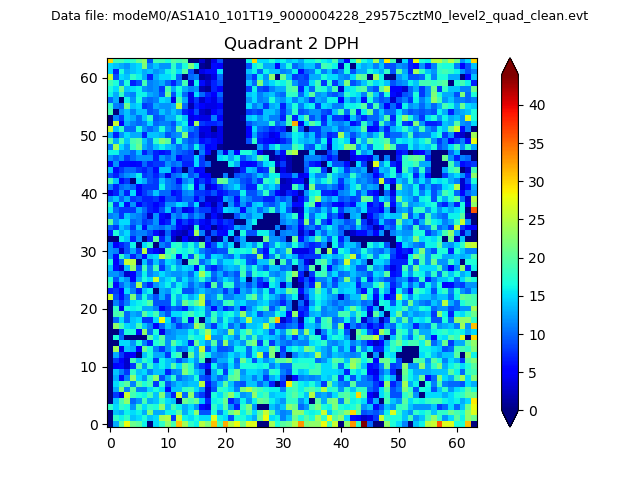
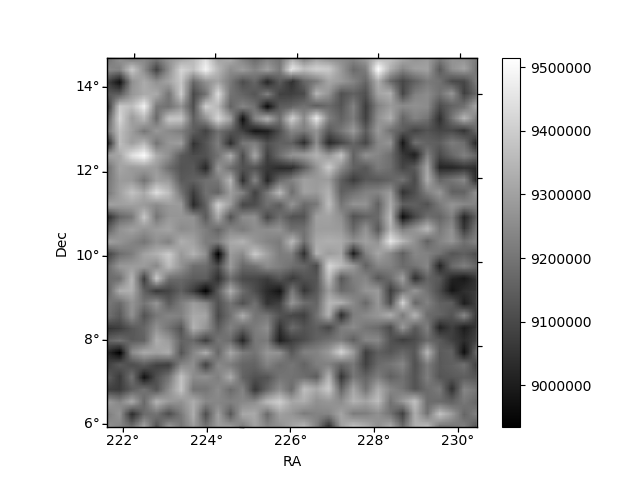
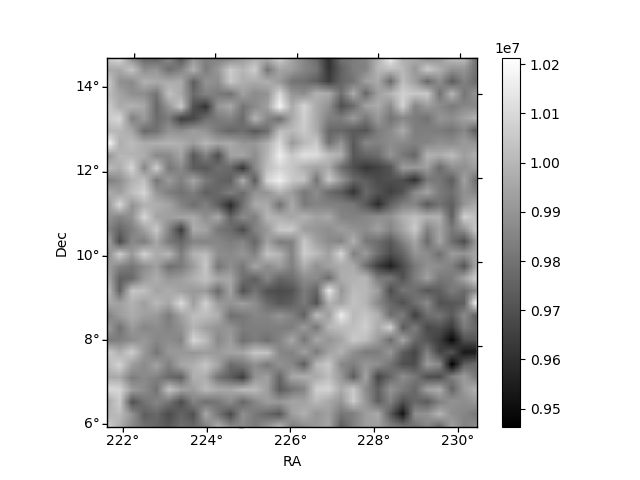
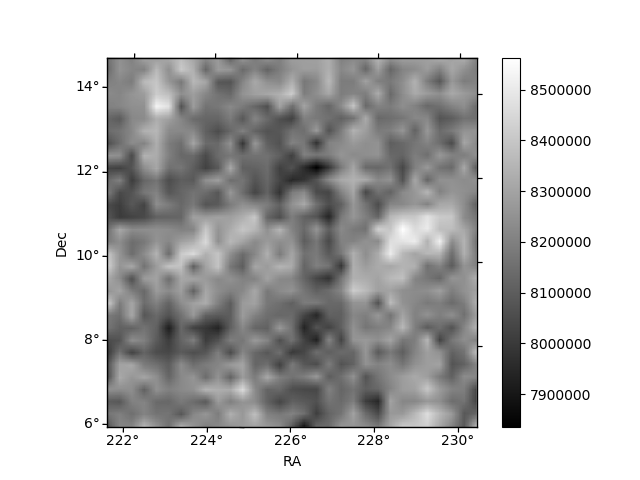
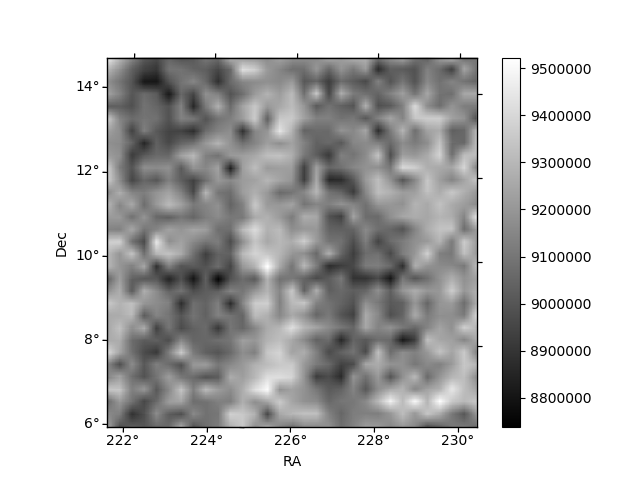
Histogram calculated using DETX and DETY for each event in the final _common_clean file
| Quadrant A | 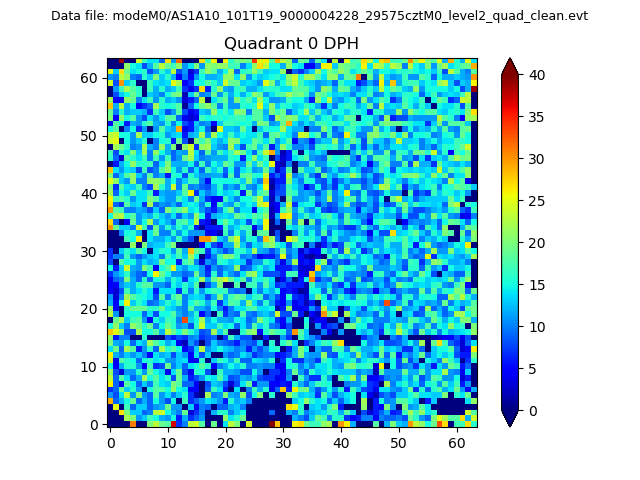 |
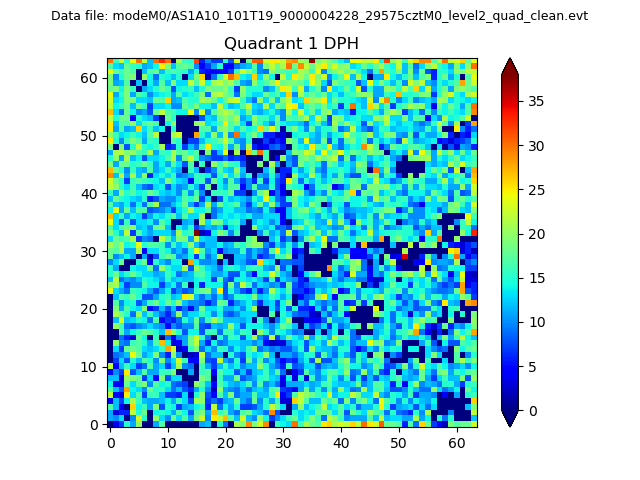 |
Quadrant B |
|---|---|---|---|
| Quadrant D | 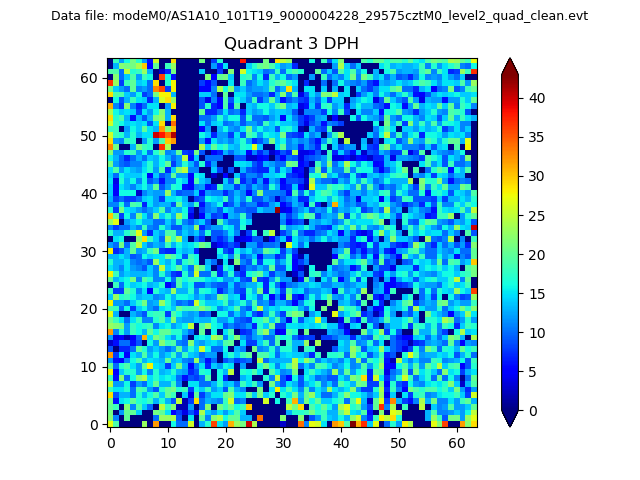 |
 |
Quadrant C |
| Plot type | Count rate plots | Images |
|---|---|---|
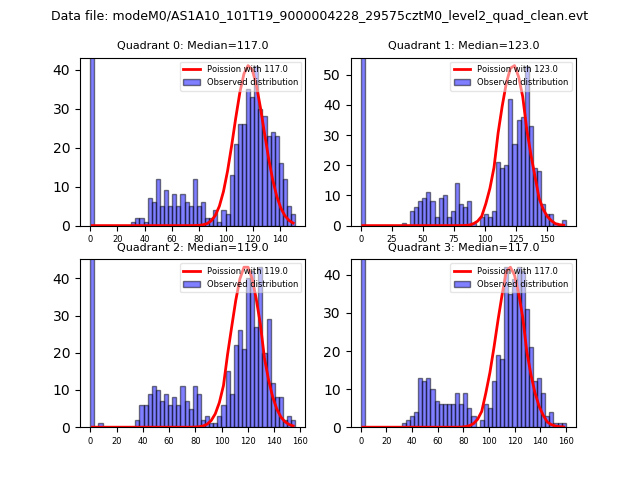
| Comparison with Poisson distribution Blue bars denote a histogram of data divided into 1 sec bins. Red curve is a Poisson curve with rate = median count rate of data. |
 |
 |
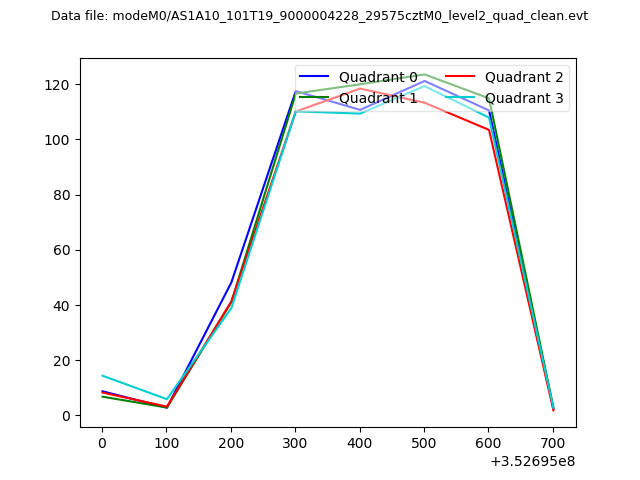
| Quadrant-wise count rates Data is divided into 100 sec bins |
 |
|
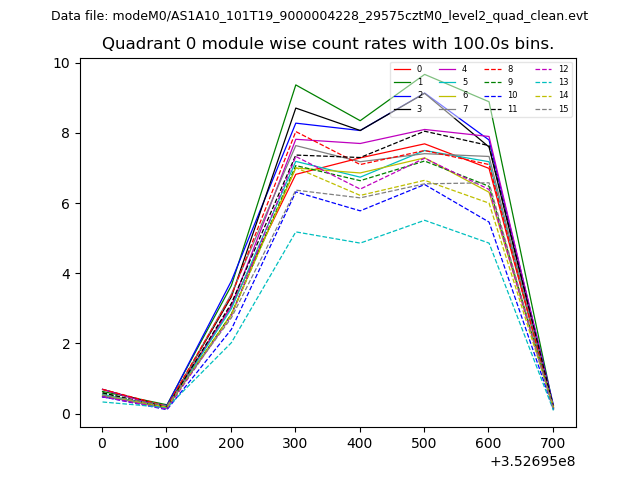
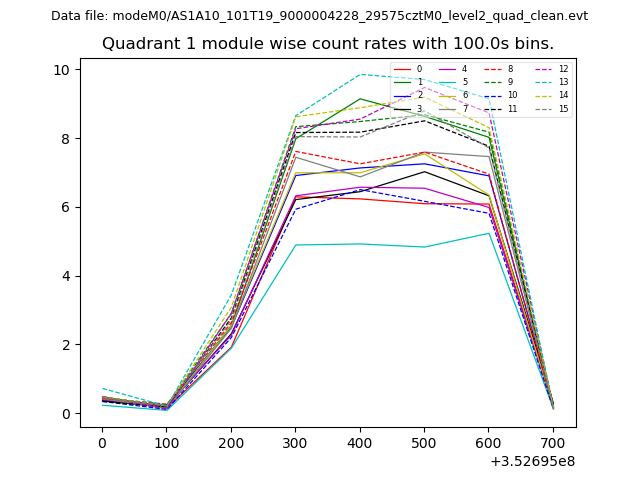
| Module-wise count rates for Quadrant A Data is divided into 100 sec bins |
 |
 |
| Module-wise count rates for Quadrant B Data is divided into 100 sec bins |
 |
 |
| Module-wise count rates for Quadrant C Data is divided into 100 sec bins |
 |
 |
| Module-wise count rates for Quadrant D Data is divided into 100 sec bins |
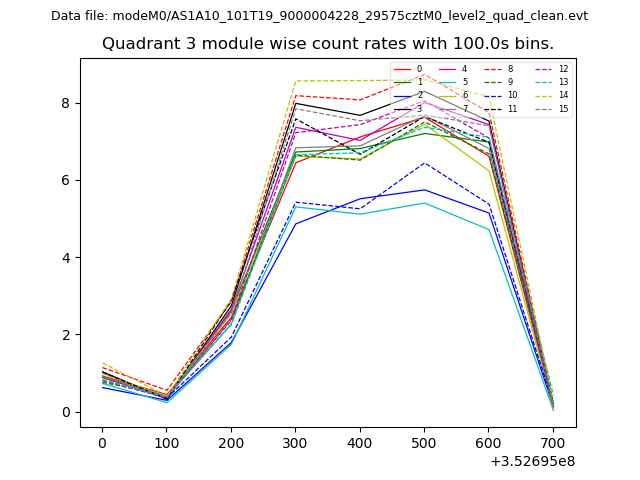 |
 |
| Parameter | Plot |
|---|---|
| CZT HV Monitor | 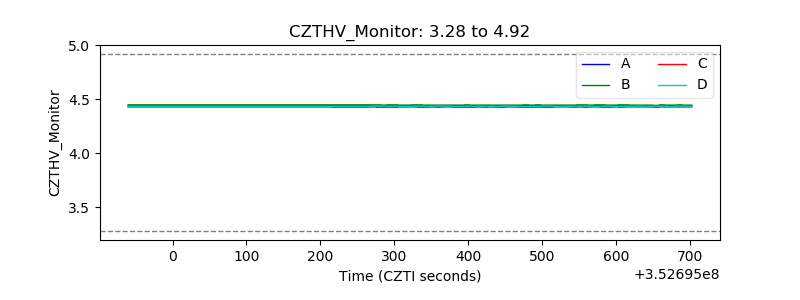 |
| D_VDD | 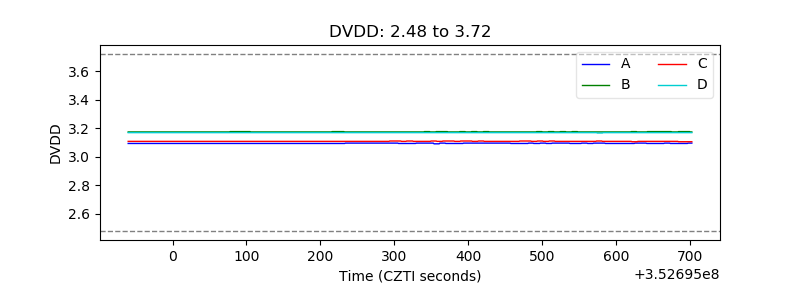 |
| Temperature 1 | 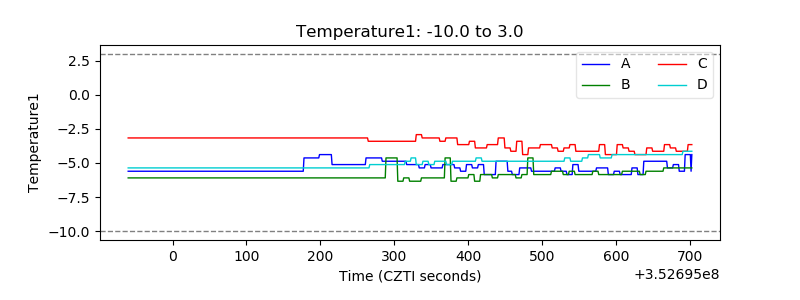 |
| Veto HV Monitor | 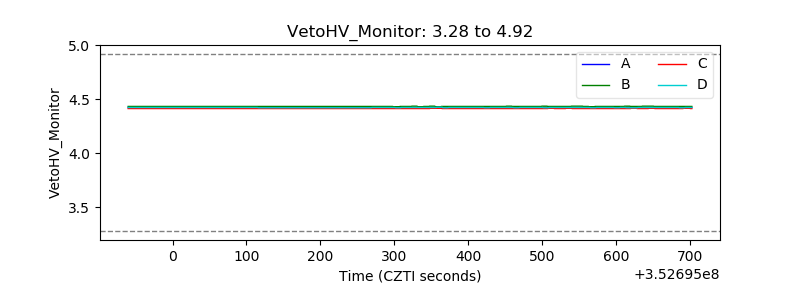 |
| Veto LLD | 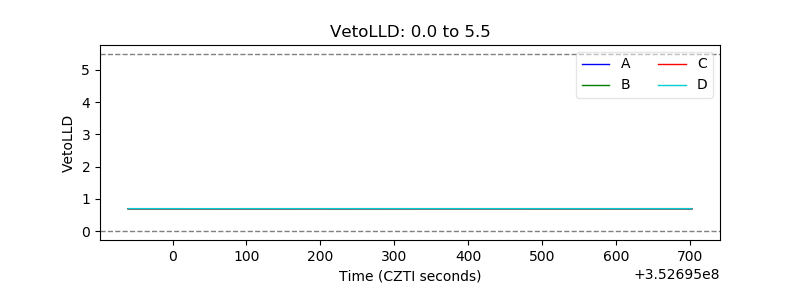 |
| Alpha Counter | 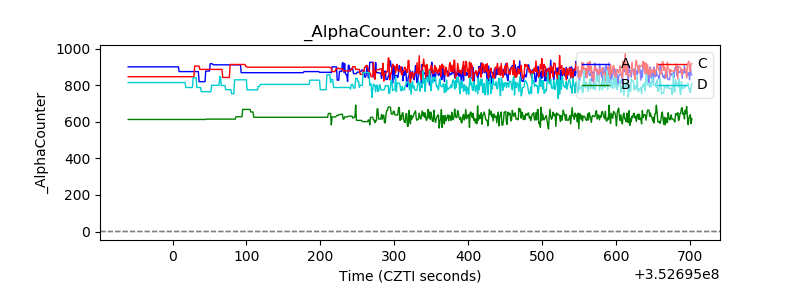 |
| _CPM_Rate | 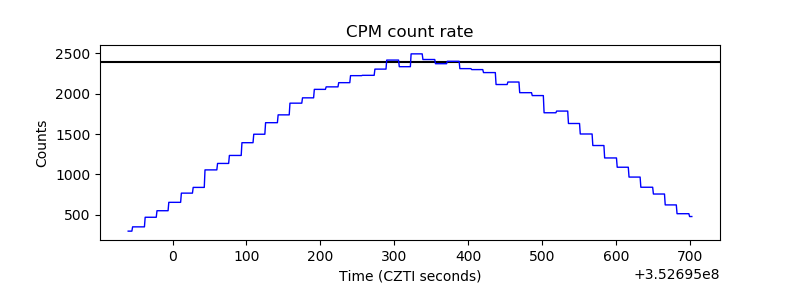 |
| CZT Counter | 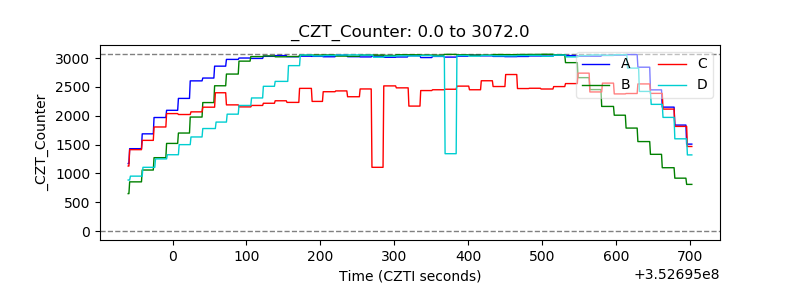 |
| +2.5 Volts monitor |  |
| +5 Volts monitor |  |
| _ROLL_ROT | 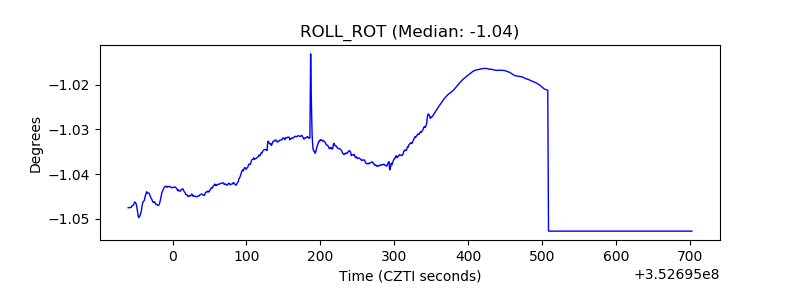 |
| _Roll_DEC | 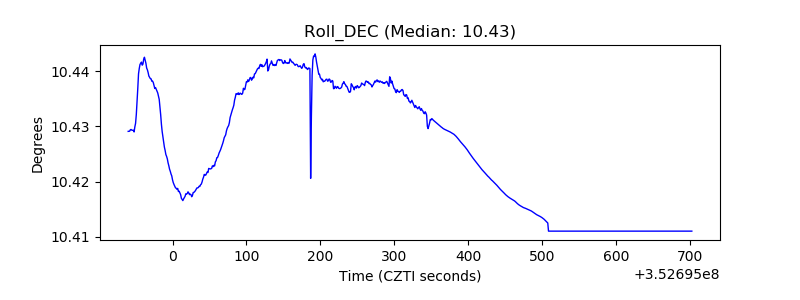 |
| _Roll_RA | 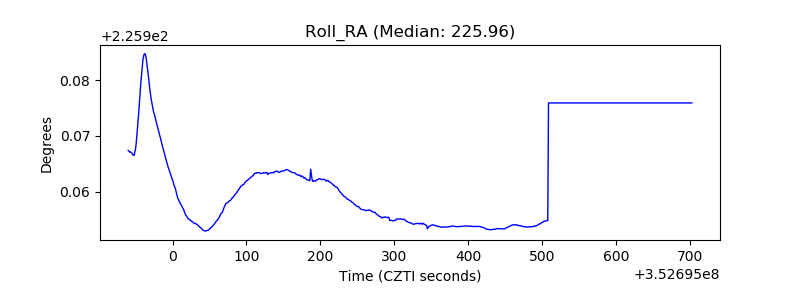 |
| Veto Counter | 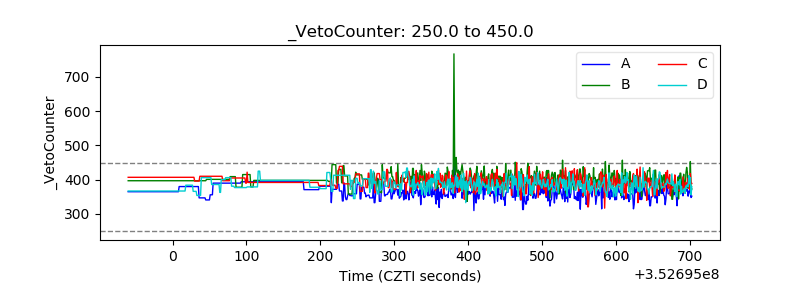 |