| Param | Original file | Final file |
|---|---|---|
| Filename | modeM0/AS1T03_280T01_9000004222cztM0_level2.fits | modeM0/AS1T03_280T01_9000004222cztM0_level2_quad_clean.evt |
| Size (bytes) | 248,434,560 | 92,963,520 |
| Size | 236.9 MB | 88.7 MB |
| Events in quadrant A | 1,609,250 | 330,515 |
| Events in quadrant B | 1,513,422 | 330,815 |
| Events in quadrant C | 1,567,326 | 314,553 |
| Events in quadrant D | 1,213,276 | 218,200 |
| Mode M9 | |||
|---|---|---|---|
| Quadrant | BADHDUFLAG | Total packets | Discarded packets |
| A | 0 | 49 | 0 |
| B | 0 | 49 | 0 |
| C | 0 | 49 | 0 |
| D | 0 | 49 | 0 |
| Mode M0 | |||
|---|---|---|---|
| Quadrant | BADHDUFLAG | Total packets | Discarded packets |
| A | 0 | 49690 | 0 |
| B | 0 | 53934 | 0 |
| C | 0 | 57893 | 0 |
| D | 0 | 108430 | 0 |
| Mode SS | |||
|---|---|---|---|
| Quadrant | BADHDUFLAG | Total packets | Discarded packets |
| A | 0 | 480 | 0 |
| B | 0 | 480 | 0 |
| C | 0 | 480 | 0 |
| D | 0 | 480 | 0 |
| Quadrant | Total seconds | Saturated seconds | Saturation percentage |
|---|---|---|---|
| A | 23515 | 110 | 0.467787% |
| B | 23515 | 430 | 1.828620% |
| C | 23515 | 581 | 2.470763% |
| D | 23515 | 5923 | 25.188178% |
Noise dominated data is calculated using 1-second bins in cleaned event files. If a bin has >2000 counts, and if more than 50% of those come from <1% of pixels, then it is considered to be noise-dominated and hence unusable.
| Quadrant | # 1 sec bins | Bins with >0 counts | Bins with >2000 counts | High rate bins dominated by noise | Noise dominated (total time) | Noise dominated (detector-on time) | Marked lightcurve |
|---|---|---|---|---|---|---|---|
| A | 28455 | 23515 | 0 | 0 | 0.00% | 0.00% |  |
| B | 28455 | 23512 | 0 | 0 | 0.00% | 0.00% |  |
| C | 28455 | 23512 | 0 | 0 | 0.00% | 0.00% |  |
| D | 28455 | 23503 | 0 | 0 | 0.00% | 0.00% |  |
Top three noisy pixels from each quadrant. If the there are fewer than three noisy pixels in the level2.evt file, extra rows are filled as -1
| Pixel properties | Quadrant properties | ||||||
|---|---|---|---|---|---|---|---|
| Quadrant | DetID | PixID | Counts | Sigma | Mean | Median | Sigma |
| A | 0 | 29 | 1616 | 12.0 | 419 | 396 | 101.6 |
| A | 0 | 30 | 1279 | 8.69 | 419 | 396 | 101.6 |
| A | 7 | 110 | 1232 | 8.23 | 419 | 396 | 101.6 |
| B | 2 | 9 | 1146 | 9.47 | 402 | 386 | 80.3 |
| B | 5 | 225 | 1029 | 8.01 | 402 | 386 | 80.3 |
| B | 5 | 128 | 1023 | 7.94 | 402 | 386 | 80.3 |
| C | 1 | 80 | 1242 | 8.04 | 414 | 393 | 105.5 |
| C | 1 | 81 | 1223 | 7.86 | 414 | 393 | 105.5 |
| C | 3 | 202 | 1179 | 7.45 | 414 | 393 | 105.5 |
| D | 15 | 46 | 1001 | 7.27 | 347 | 319 | 93.9 |
| D | 6 | 67 | 897 | 6.16 | 347 | 319 | 93.9 |
| D | 10 | 189 | 861 | 5.77 | 347 | 319 | 93.9 |
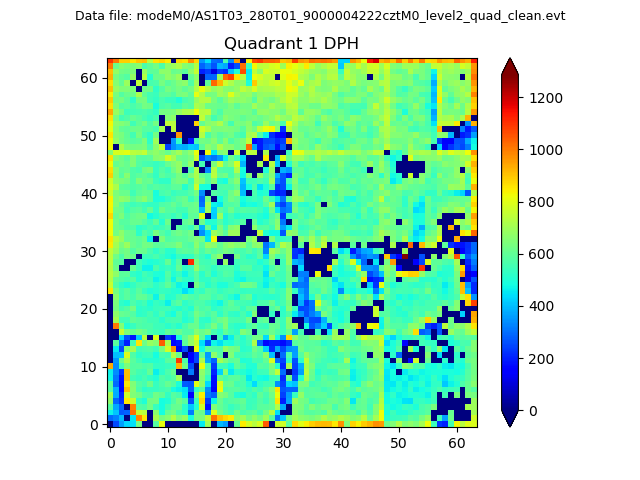
Histogram calculated using DETX and DETY for each event in the final _common_clean file
| Quadrant A |  |
 |
Quadrant B |
|---|---|---|---|
| Quadrant D |  |
 |
Quadrant C |
| Plot type | Count rate plots | Images |
|---|---|---|
| Comparison with Poisson distribution Blue bars denote a histogram of data divided into 1 sec bins. Red curve is a Poisson curve with rate = median count rate of data. |
 |
 |
| Quadrant-wise count rates Data is divided into 100 sec bins |
 |
|
| Module-wise count rates for Quadrant A Data is divided into 100 sec bins |
 |
 |
| Module-wise count rates for Quadrant B Data is divided into 100 sec bins |
 |
 |
| Module-wise count rates for Quadrant C Data is divided into 100 sec bins |
 |
 |
| Module-wise count rates for Quadrant D Data is divided into 100 sec bins |
 |
 |
| Parameter | Plot |
|---|---|
| CZT HV Monitor |  |
| D_VDD |  |
| Temperature 1 |  |
| Veto HV Monitor |  |
| Veto LLD |  |
| Alpha Counter |  |
| _CPM_Rate |  |
| CZT Counter |  |
| +2.5 Volts monitor |  |
| +5 Volts monitor |  |
| _ROLL_ROT |  |
| _Roll_DEC |  |
| _Roll_RA |  |
| Veto Counter |  |