| Param | Original file | Final file |
|---|---|---|
| Filename | modeM0/AS1T03_280T01_9000004222_29379cztM0_level2.evt | modeM0/AS1T03_280T01_9000004222_29379cztM0_level2_quad_clean.evt |
| Size (bytes) | 67,032,000 | 12,473,280 |
| Size | 63.9 MB | 11.9 MB |
| Events in quadrant A | 280,434 | 86,113 |
| Events in quadrant B | 291,434 | 88,123 |
| Events in quadrant C | 321,558 | 83,206 |
| Events in quadrant D | 1,092,090 | 69,524 |
| Mode M0 | |||
|---|---|---|---|
| Quadrant | BADHDUFLAG | Total packets | Discarded packets |
| A | 0 | 1216 | 0 |
| B | 0 | 1219 | 0 |
| C | 0 | 1284 | 0 |
| D | 0 | 3666 | 2 |
| Mode SS | |||
|---|---|---|---|
| Quadrant | BADHDUFLAG | Total packets | Discarded packets |
| A | 0 | 12 | 0 |
| B | 0 | 12 | 0 |
| C | 0 | 12 | 0 |
| D | 0 | 12 | 0 |
| Quadrant | Total seconds | Saturated seconds | Saturation percentage |
|---|---|---|---|
| A | 608 | 0 | 0.000000% |
| B | 608 | 1 | 0.164474% |
| C | 608 | 2 | 0.328947% |
| D | 607 | 202 | 33.278418% |
Noise dominated data is calculated using 1-second bins in cleaned event files. If a bin has >2000 counts, and if more than 50% of those come from <1% of pixels, then it is considered to be noise-dominated and hence unusable.
| Quadrant | # 1 sec bins | Bins with >0 counts | Bins with >2000 counts | High rate bins dominated by noise | Noise dominated (total time) | Noise dominated (detector-on time) | Marked lightcurve |
|---|---|---|---|---|---|---|---|
| A | 608 | 608 | 0 | 0 | 0.00% | 0.00% | 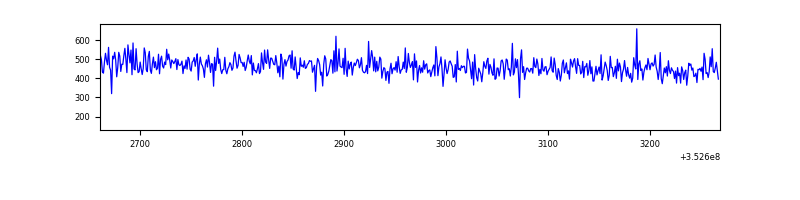 |
| B | 608 | 608 | 0 | 0 | 0.00% | 0.00% | 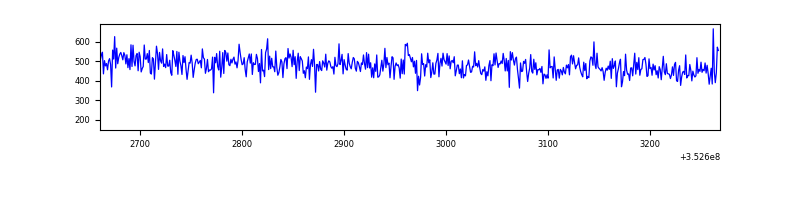 |
| C | 608 | 608 | 0 | 0 | 0.00% | 0.00% | 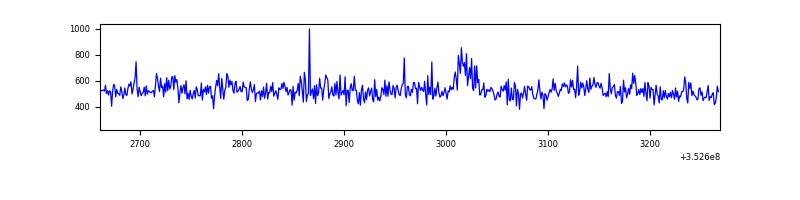 |
| D | 607 | 607 | 228 | 228 | 37.56% | 37.56% | 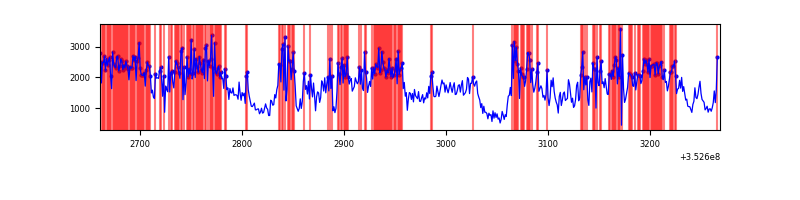 |
Top three noisy pixels from each quadrant. If the there are fewer than three noisy pixels in the level2.evt file, extra rows are filled as -1
| Pixel properties | Quadrant properties | ||||||
|---|---|---|---|---|---|---|---|
| Quadrant | DetID | PixID | Counts | Sigma | Mean | Median | Sigma |
| A | 13 | 254 | 1181 | 65.94 | 72 | 71 | 16.8 |
| A | 3 | 137 | 648 | 34.28 | 72 | 71 | 16.8 |
| A | 0 | 226 | 571 | 29.7 | 72 | 71 | 16.8 |
| B | 12 | 111 | 1768 | 103.52 | 74 | 72 | 16.4 |
| B | 14 | 111 | 1414 | 81.92 | 74 | 72 | 16.4 |
| B | 11 | 111 | 1382 | 79.96 | 74 | 72 | 16.4 |
| C | 3 | 233 | 21903 | 1138.05 | 72 | 72 | 19.2 |
| C | 14 | 238 | 12124 | 628.27 | 72 | 72 | 19.2 |
| C | 4 | 175 | 2068 | 104.05 | 72 | 72 | 19.2 |
| D | 12 | 33 | 719999 | 41460.15 | 64 | 62 | 17.4 |
| D | 1 | 52 | 102678 | 5909.51 | 64 | 62 | 17.4 |
| D | 8 | 195 | 11206 | 641.77 | 64 | 62 | 17.4 |
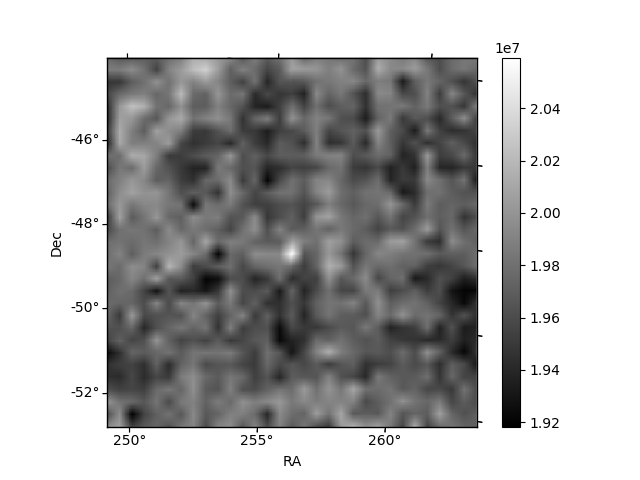
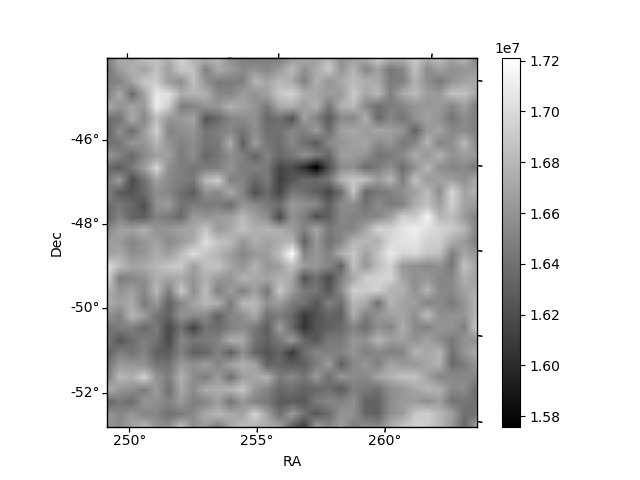
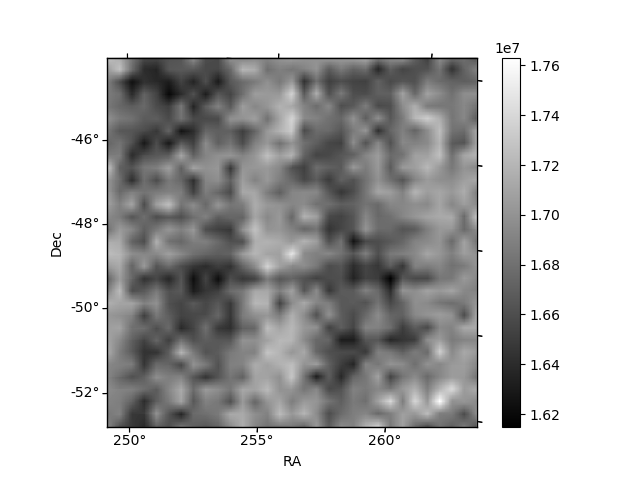
Histogram calculated using DETX and DETY for each event in the final _common_clean file
| Quadrant A | 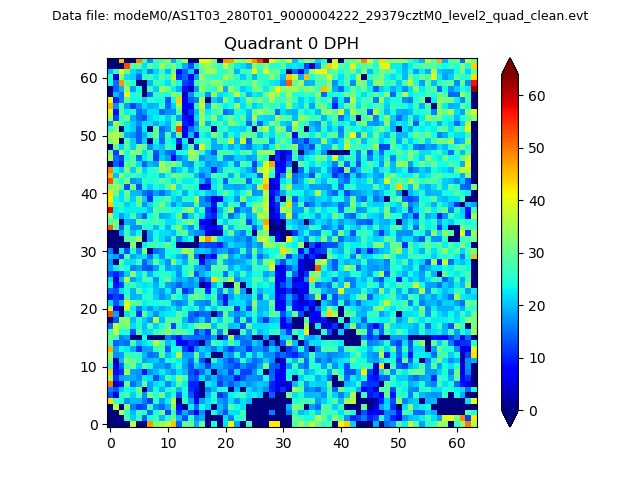 |
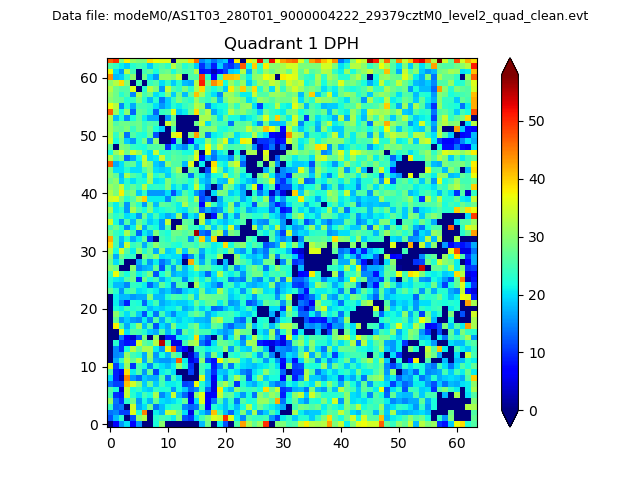 |
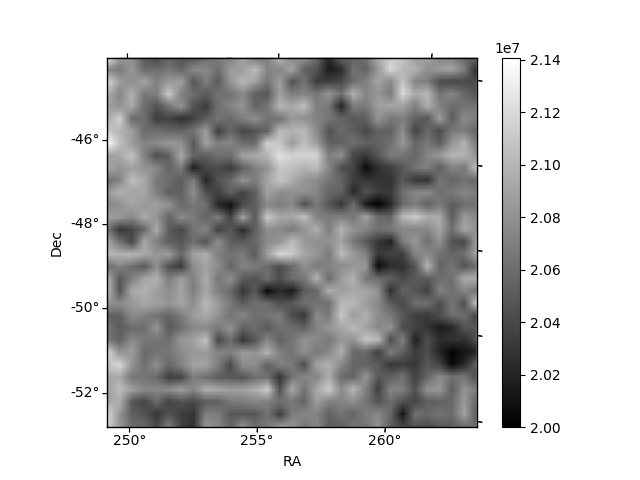
Quadrant B |
|---|---|---|---|
| Quadrant D | 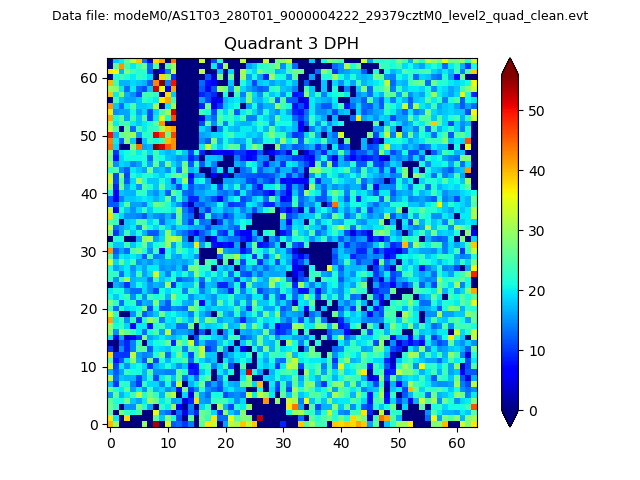 |
 |
Quadrant C |
| Plot type | Count rate plots | Images |
|---|---|---|
| Comparison with Poisson distribution Blue bars denote a histogram of data divided into 1 sec bins. Red curve is a Poisson curve with rate = median count rate of data. |
 |
 |
| Quadrant-wise count rates Data is divided into 100 sec bins |
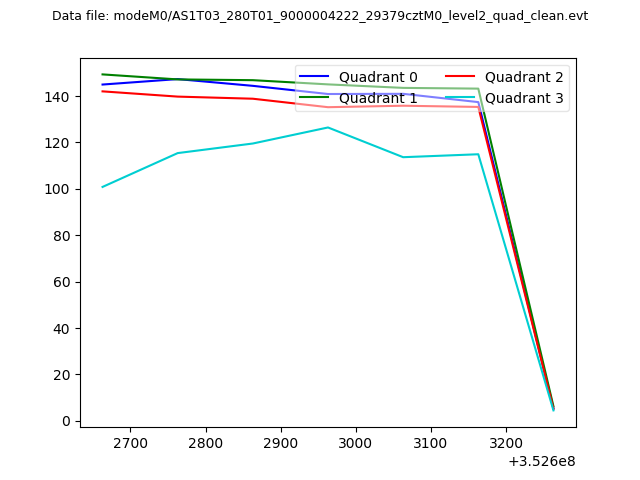 |
|
| Module-wise count rates for Quadrant A Data is divided into 100 sec bins |
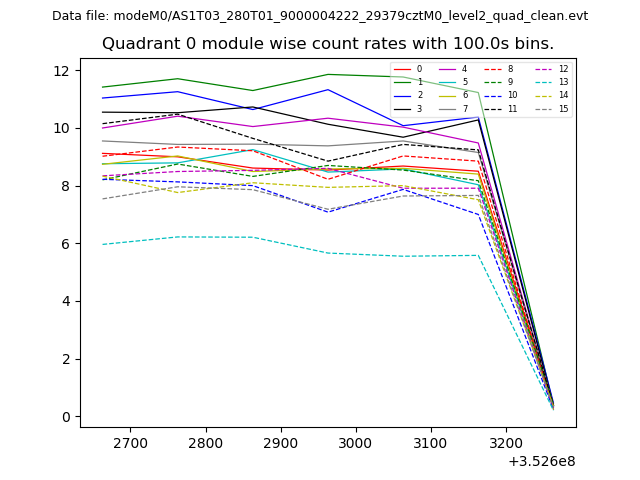 |
 |
| Module-wise count rates for Quadrant B Data is divided into 100 sec bins |
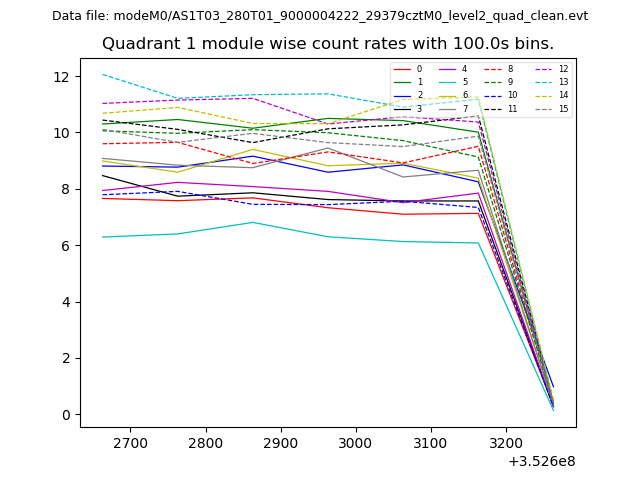 |
 |
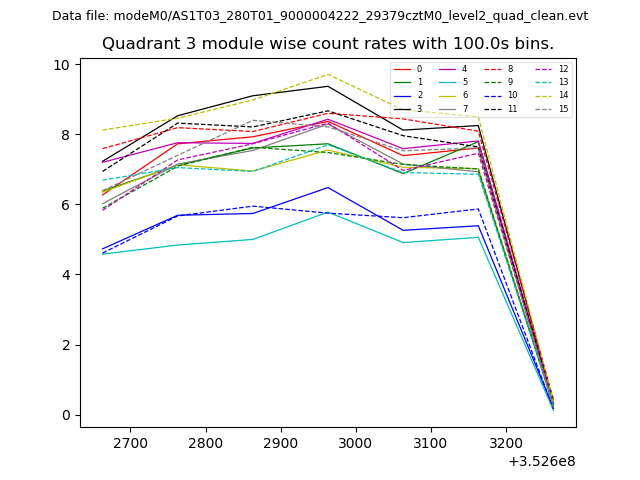
| Module-wise count rates for Quadrant C Data is divided into 100 sec bins |
 |
 |
| Module-wise count rates for Quadrant D Data is divided into 100 sec bins |
 |
 |
| Parameter | Plot |
|---|---|
| CZT HV Monitor | 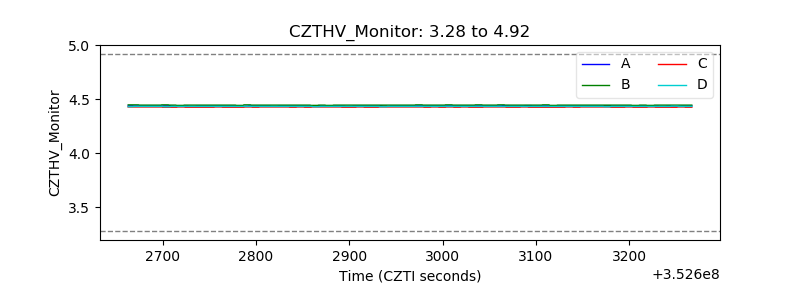 |
| D_VDD | 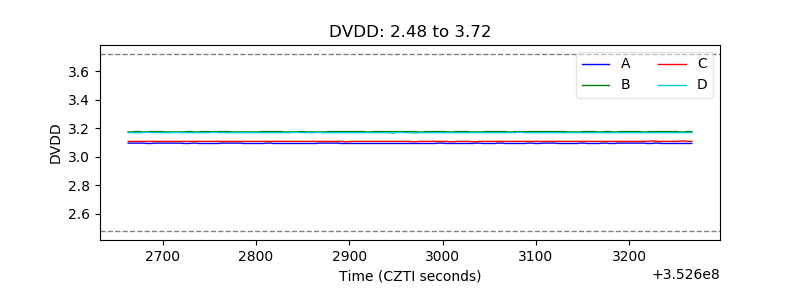 |
| Temperature 1 | 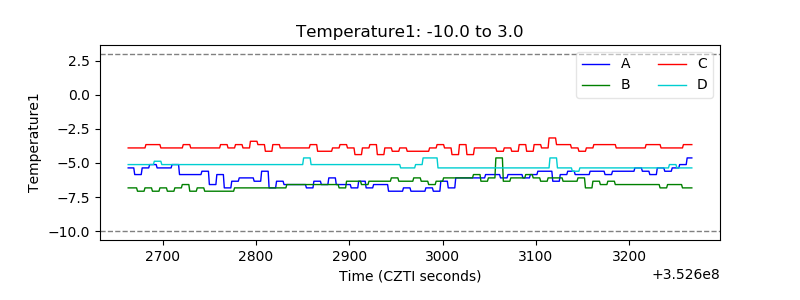 |
| Veto HV Monitor |  |
| Veto LLD | 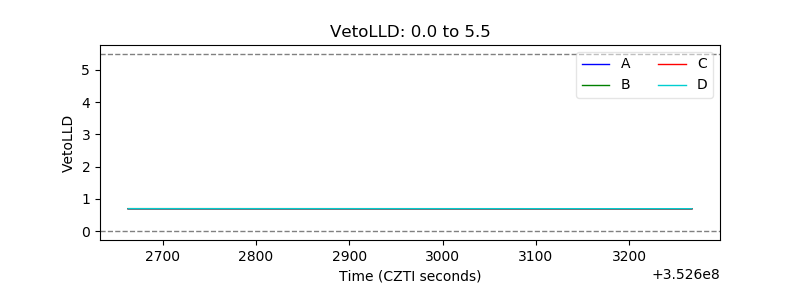 |
| Alpha Counter |  |
| _CPM_Rate | 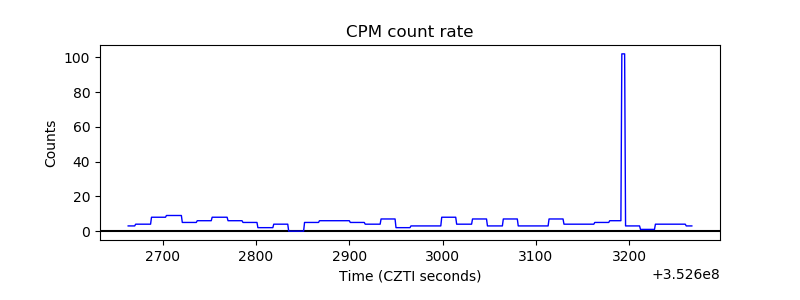 |
| CZT Counter |  |
| +2.5 Volts monitor |  |
| +5 Volts monitor |  |
| _ROLL_ROT | 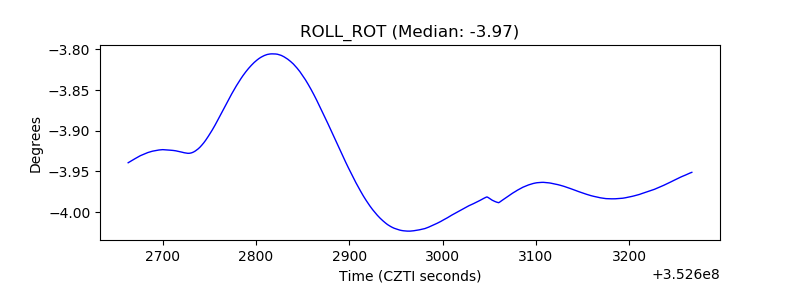 |
| _Roll_DEC | 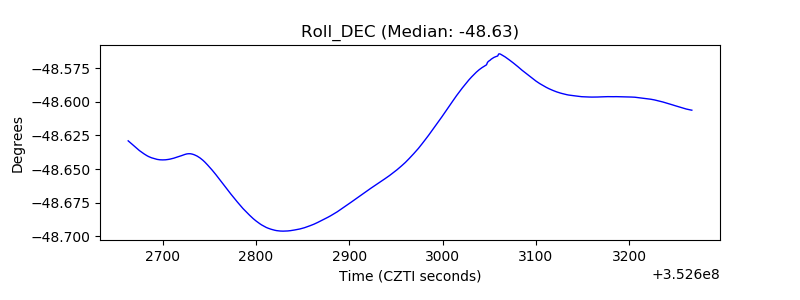 |
| _Roll_RA |  |
| Veto Counter | 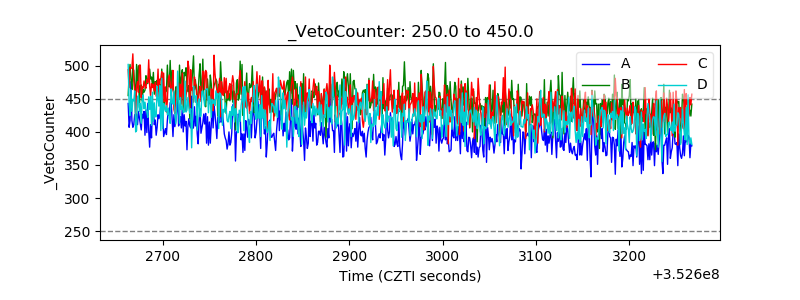 |