| Param | Original file | Final file |
|---|---|---|
| Filename | modeM0/AS1T03_280T01_9000004222_29381cztM0_level2.evt | modeM0/AS1T03_280T01_9000004222_29381cztM0_level2_quad_clean.evt |
| Size (bytes) | 522,817,920 | 85,752,000 |
| Size | 498.6 MB | 81.8 MB |
| Events in quadrant A | 2,771,058 | 569,838 |
| Events in quadrant B | 3,007,683 | 581,600 |
| Events in quadrant C | 3,073,884 | 557,039 |
| Events in quadrant D | 6,592,331 | 487,289 |
| Mode M9 | |||
|---|---|---|---|
| Quadrant | BADHDUFLAG | Total packets | Discarded packets |
| A | 0 | 11 | 0 |
| B | 0 | 11 | 0 |
| C | 0 | 11 | 0 |
| D | 0 | 11 | 0 |
| Mode M0 | |||
|---|---|---|---|
| Quadrant | BADHDUFLAG | Total packets | Discarded packets |
| A | 0 | 11827 | 1 |
| B | 0 | 12584 | 1 |
| C | 0 | 12532 | 1 |
| D | 0 | 23500 | 1 |
| Mode SS | |||
|---|---|---|---|
| Quadrant | BADHDUFLAG | Total packets | Discarded packets |
| A | 0 | 118 | 0 |
| B | 0 | 118 | 0 |
| C | 0 | 118 | 0 |
| D | 0 | 118 | 0 |
| Quadrant | Total seconds | Saturated seconds | Saturation percentage |
|---|---|---|---|
| A | 5726 | 14 | 0.244499% |
| B | 5726 | 78 | 1.362207% |
| C | 5726 | 78 | 1.362207% |
| D | 5726 | 1011 | 17.656305% |
Noise dominated data is calculated using 1-second bins in cleaned event files. If a bin has >2000 counts, and if more than 50% of those come from <1% of pixels, then it is considered to be noise-dominated and hence unusable.
| Quadrant | # 1 sec bins | Bins with >0 counts | Bins with >2000 counts | High rate bins dominated by noise | Noise dominated (total time) | Noise dominated (detector-on time) | Marked lightcurve |
|---|---|---|---|---|---|---|---|
| A | 6826 | 5727 | 0 | 0 | 0.00% | 0.00% | 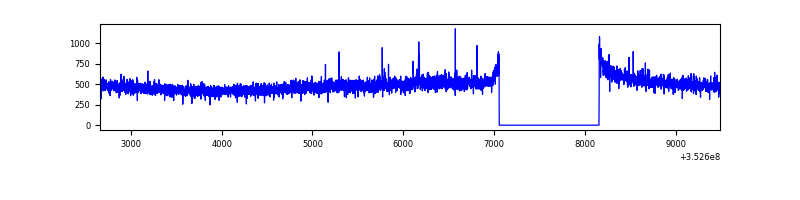 |
| B | 6826 | 5727 | 32 | 32 | 0.47% | 0.56% | 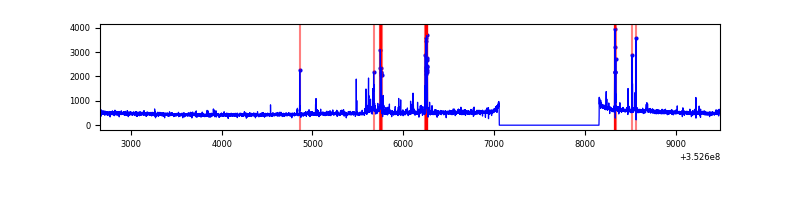 |
| C | 6826 | 5727 | 0 | 0 | 0.00% | 0.00% | 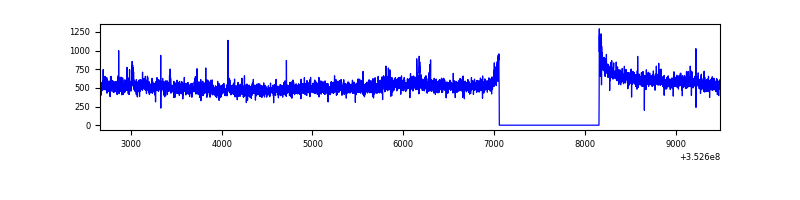 |
| D | 6826 | 5727 | 887 | 887 | 12.99% | 15.49% | 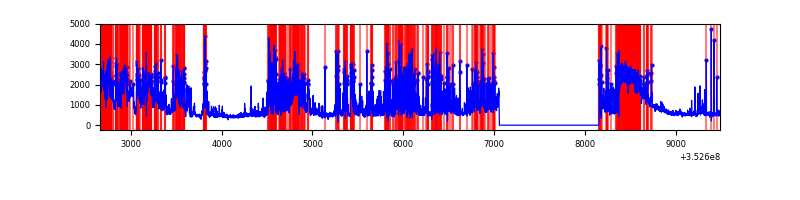 |
Top three noisy pixels from each quadrant. If the there are fewer than three noisy pixels in the level2.evt file, extra rows are filled as -1
| Pixel properties | Quadrant properties | ||||||
|---|---|---|---|---|---|---|---|
| Quadrant | DetID | PixID | Counts | Sigma | Mean | Median | Sigma |
| A | 13 | 254 | 11290 | 74.02 | 715 | 702 | 143.0 |
| A | 15 | 174 | 10159 | 66.12 | 715 | 702 | 143.0 |
| A | 3 | 137 | 6575 | 41.06 | 715 | 702 | 143.0 |
| B | 0 | 229 | 100394 | 737.75 | 712 | 696 | 135.1 |
| B | 5 | 255 | 82642 | 606.39 | 712 | 696 | 135.1 |
| B | 5 | 172 | 17977 | 127.88 | 712 | 696 | 135.1 |
| C | 3 | 233 | 203790 | 1230.72 | 700 | 705 | 165.0 |
| C | 14 | 238 | 114986 | 692.56 | 700 | 705 | 165.0 |
| C | 2 | 114 | 13608 | 78.19 | 700 | 705 | 165.0 |
| D | 12 | 33 | 2611542 | 16762.38 | 657 | 640 | 155.8 |
| D | 1 | 52 | 901109 | 5781.14 | 657 | 640 | 155.8 |
| D | 13 | 153 | 209362 | 1340.03 | 657 | 640 | 155.8 |
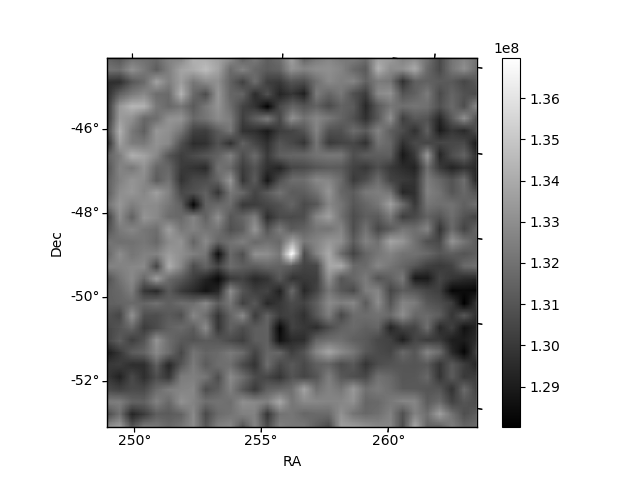
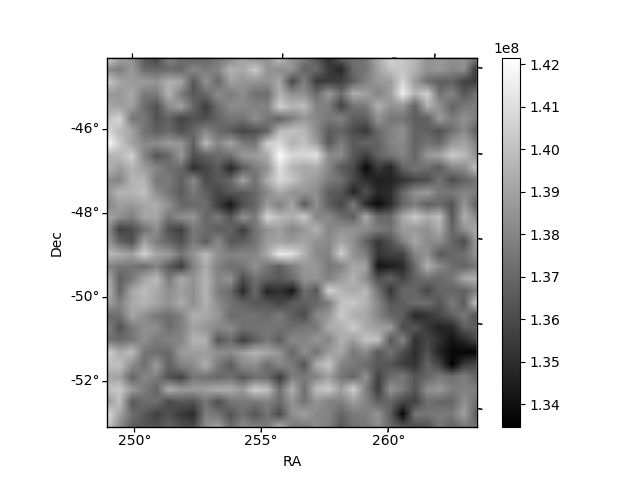
Histogram calculated using DETX and DETY for each event in the final _common_clean file
| Quadrant A |  |
 |
Quadrant B |
|---|---|---|---|
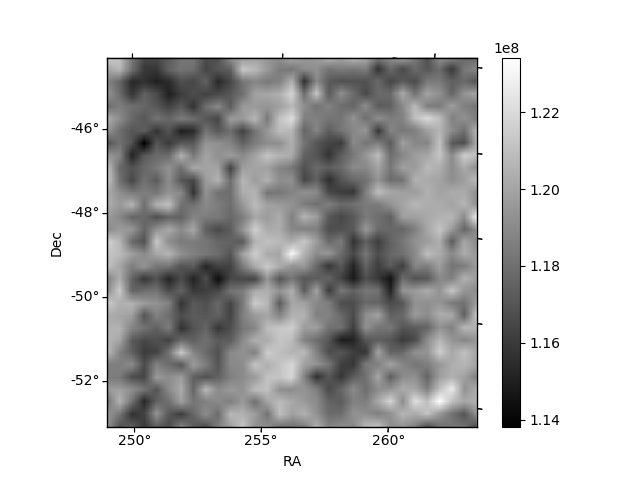
| Quadrant D |  |
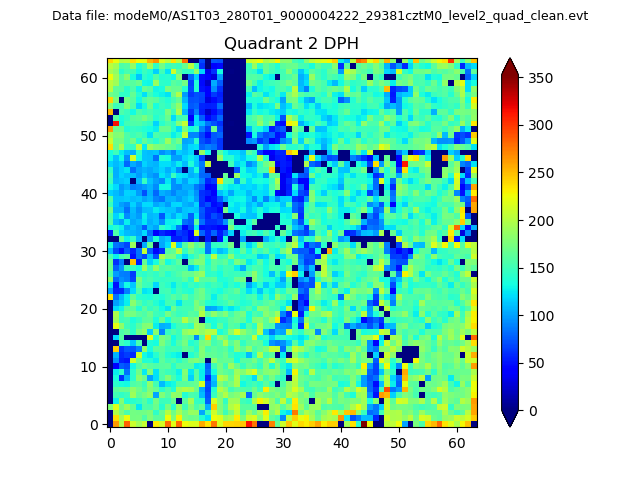 |
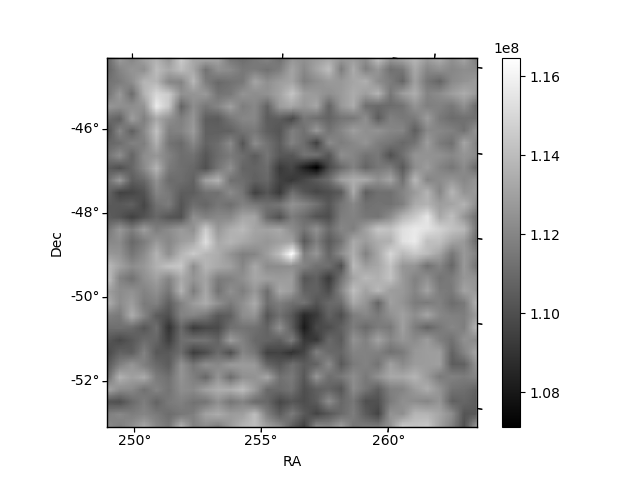
Quadrant C |
| Plot type | Count rate plots | Images |
|---|---|---|
| Comparison with Poisson distribution Blue bars denote a histogram of data divided into 1 sec bins. Red curve is a Poisson curve with rate = median count rate of data. |
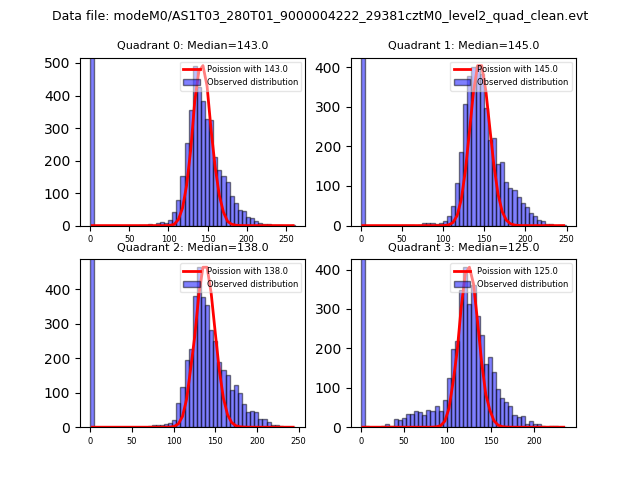 |
 |
| Quadrant-wise count rates Data is divided into 100 sec bins |
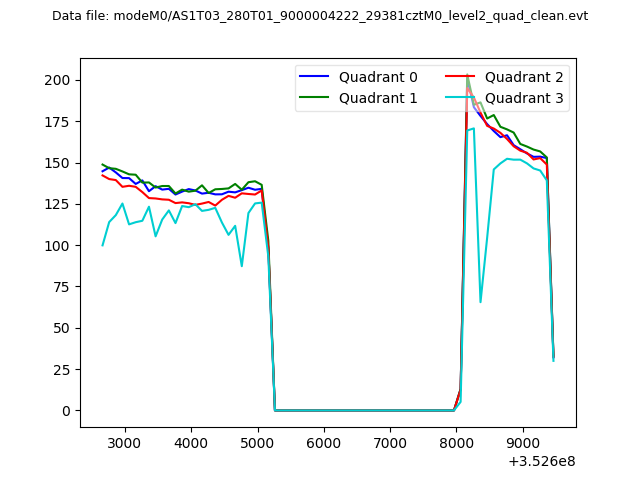 |
|
| Module-wise count rates for Quadrant A Data is divided into 100 sec bins |
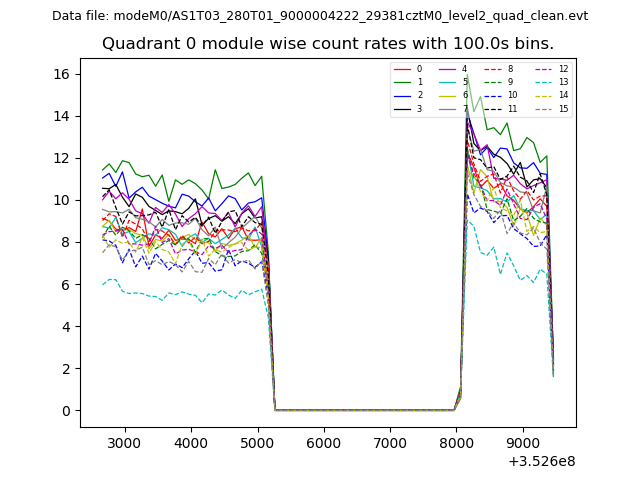 |
 |
| Module-wise count rates for Quadrant B Data is divided into 100 sec bins |
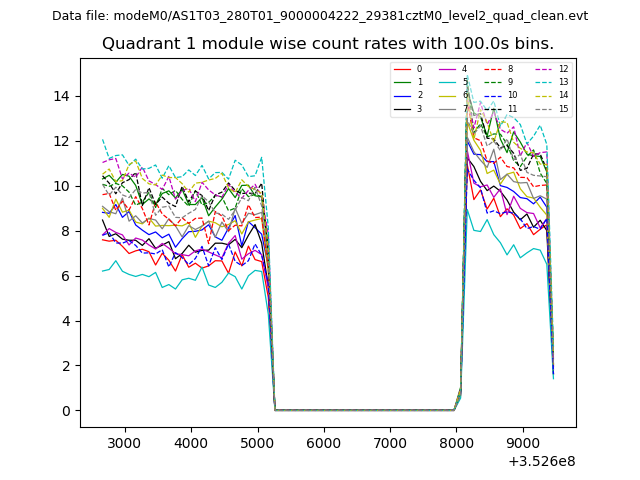 |
 |
| Module-wise count rates for Quadrant C Data is divided into 100 sec bins |
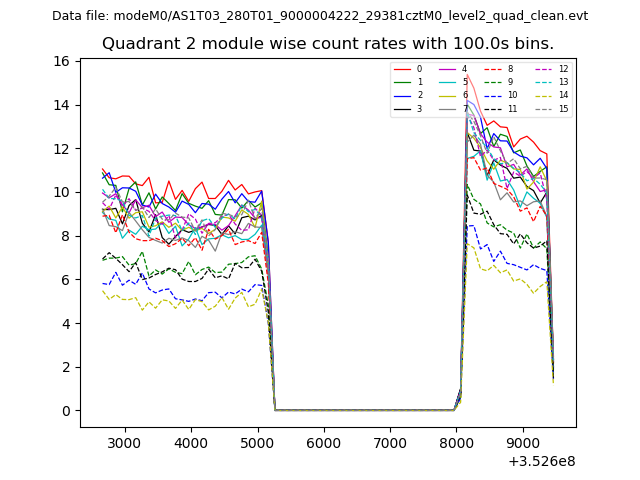 |
 |
| Module-wise count rates for Quadrant D Data is divided into 100 sec bins |
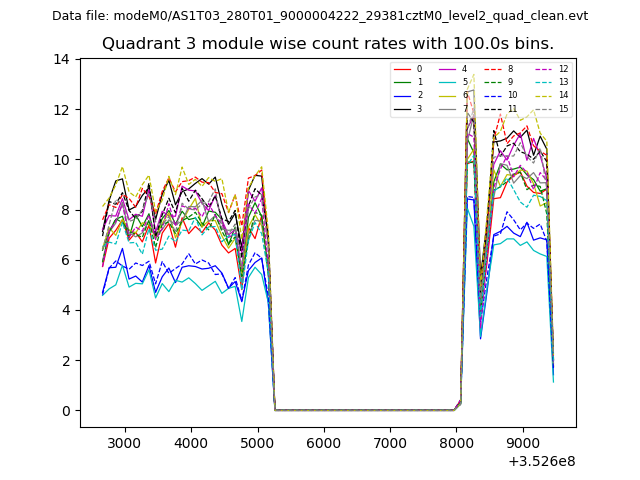 |
 |
| Parameter | Plot |
|---|---|
| CZT HV Monitor | 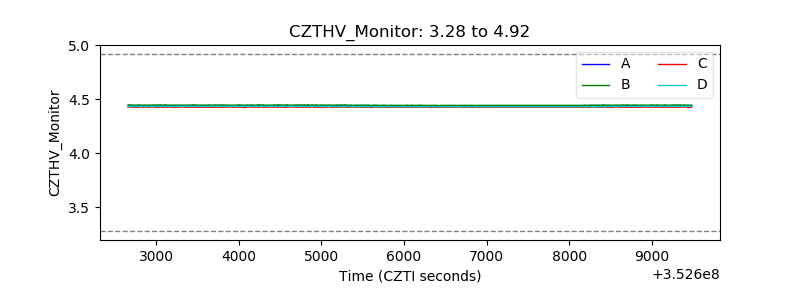 |
| D_VDD | 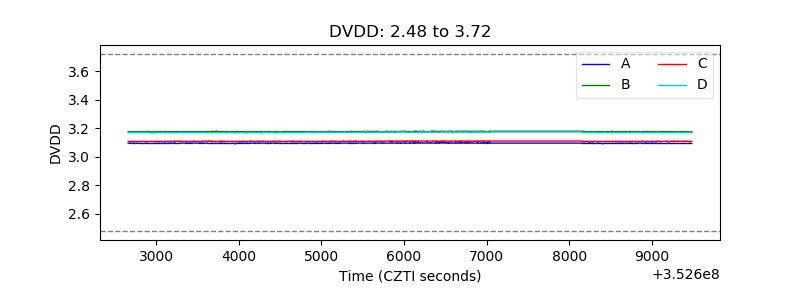 |
| Temperature 1 | 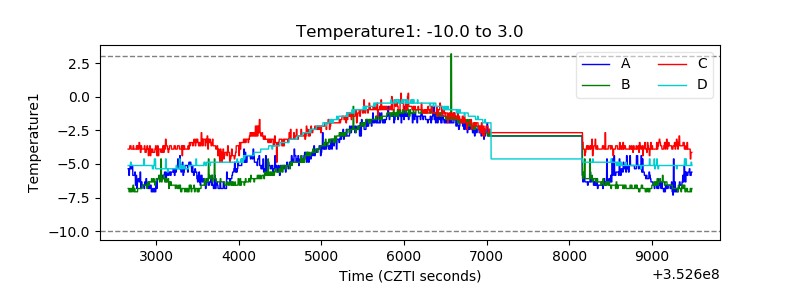 |
| Veto HV Monitor | 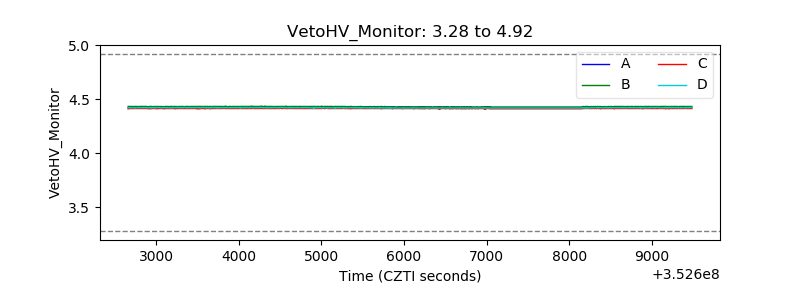 |
| Veto LLD |  |
| Alpha Counter | 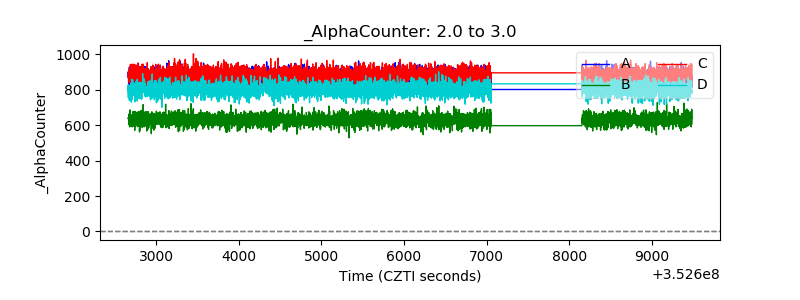 |
| _CPM_Rate | 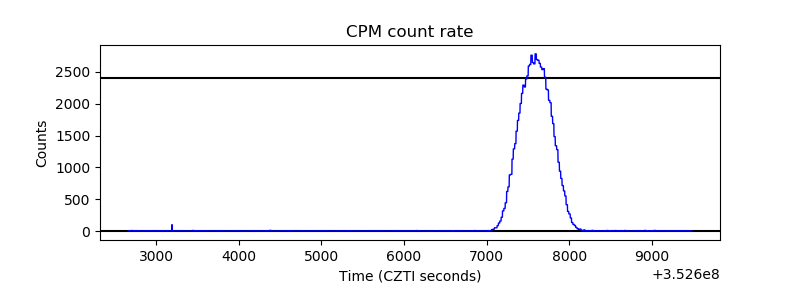 |
| CZT Counter | 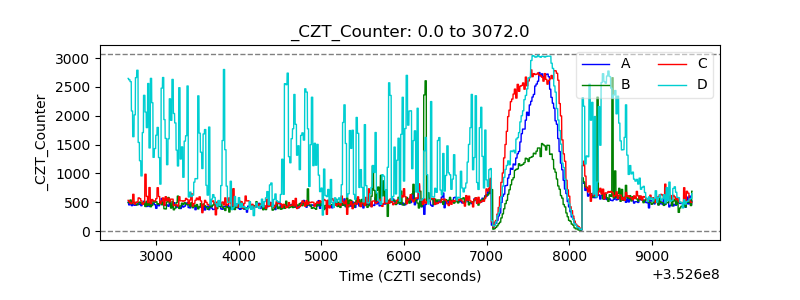 |
| +2.5 Volts monitor |  |
| +5 Volts monitor |  |
| _ROLL_ROT | 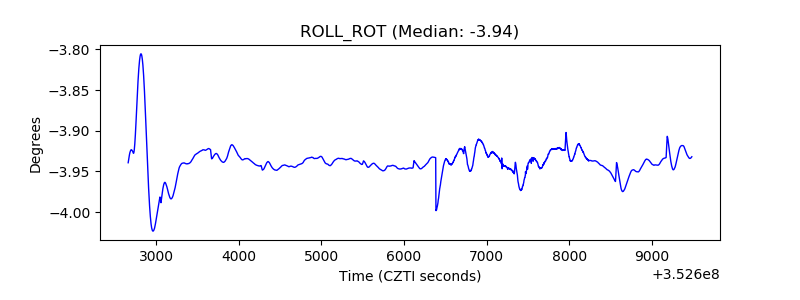 |
| _Roll_DEC | 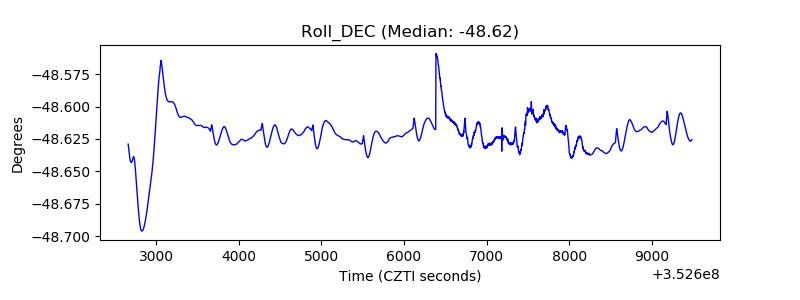 |
| _Roll_RA | 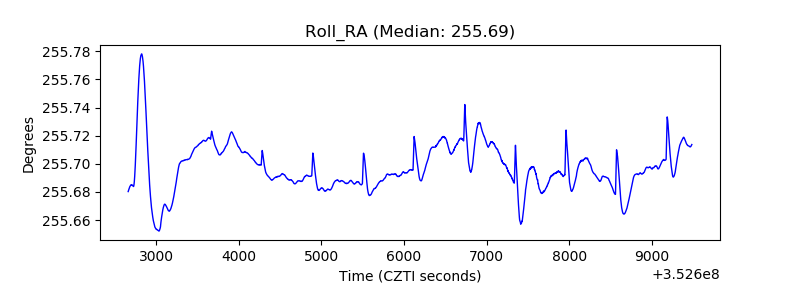 |
| Veto Counter | 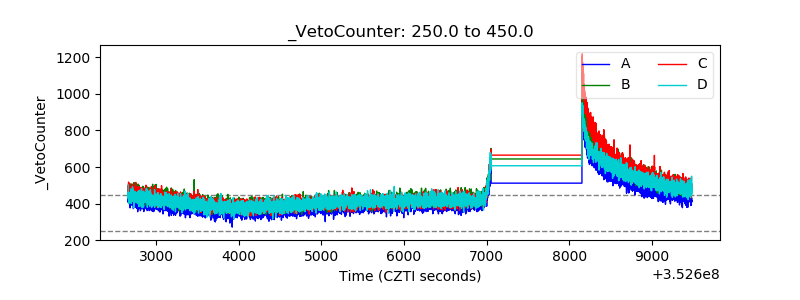 |